
ABSTRACT
Exopolysaccharides act as mediators of cross-talk between probiotics and the host. Here, we found that EPS derived from probiotic Lactobacillus casei WXD030 strain (L-EPS) could modulate immune responses in vitro and in vivo. L-EPS could significantly enhance the proliferation and phagocytic activity as well as induce the production of NO, TNF-α, IL-1β and IL-6 in RAW264.7 cells. Furthermore, L-EPS could induce the maturation of BMDCs. In addition, L-EPS could largely increase the titres of OVA-specific antibodies and markedly enhanced T cell proliferation. Notably, L-EPS also increased expression of IL-4 and INF-γ expression in CD4+T cells. Consistently, when used as an adjuvant in vivo with the foot-and-mouth disease vaccine, L-EPS largely enhanced the FMDV-specific antibody production. Collectively, these results suggested that L-EPS derived from probiotic L. casei strain had adjuvant activity, which may be a safe and efficacious adjuvant candidate suitable for a wide spectrum of prophylactic and therapeutic vaccines.
1. Introduction
Vaccination has been proved to be the most cost-effective strategy for controlling a wide variety of infectious diseases (Wu, He, & Kang, Citation2017; Zhang et al., Citation2018). Various approaches have been developed recently in order to improve vaccine potency, particularly with the respect to choose of a better adjuvant. To date, despite various adjuvants, such as lipopolysaccharide (LPS) and Freund’s complete adjuvant (FCA), have been identified and extensively studied, they are not widely applied due to their toxicity (Abel et al., Citation2009; Pohanka, Vobornikova, & Fusek, Citation2016). Hence, only partial adjuvants, such as alum, are licensed for clinical use (Mbow, Gregorio, Valiante, & Rappuoli, Citation2010). So the development of effective and safer adjuvants offers to promote the better prophylactic and therapeutic vaccines. There is growing evidence that many polysaccharides derived from higher plants or mushrooms as potential adjuvant due to their immunostimulatory activities and low toxicity (Chen et al., Citation2018; Mbow et al., Citation2010; Meng, Cheng, Han, Chen, & Wang, Citation2017). Meanwhile, microbial exopolysaccharides (EPSs) provide many beneficial physiological effects, such as anti-tumor activity, anti-inflammatory, and anti-oxidant activity (Khalil et al., Citation2018; Lenoir et al., Citation2016; Rochat et al., Citation2007; Schiffer et al., Citation2011). So the EPSs derived from microbial are a new candidate adjuvant for vaccines. Lactobacilli, including Lactobacillus casei (L. casei), commonly used probiotic bacteria, show the immunomodulatory properties (Chiang, Liu, Tseng, Mau, & Pan, Citation2012; Giahi, Elmadfa, Hoseini, & Klein, Citation2013). EPSs are major components of extracellular polymeric substances and the lactobacilli biofilm matrix (Ciszek-Lenda et al., Citation2011; Oleksy & Klewicka, Citation2018). However, in contrast to peptidoglycans or teichoic acids, EPSs derived from lactobacillus adjuvant was seldom reported.
This study aims to explore adjuvant effects of L. casei EPS in vivo and in vitro. A systematic investigation on the adjuvant effects of EPS derived from the L. casei WXD030 strain was evaluated. Our findings proved the potential immunomodulatory activity of EPS and expanded its application scope.
2. Materials and methods
2.1. Bacterial strains and cell line
L. casei WXD030 was newly isolated from traditional dairy products in Inner Mongolia, China. It was identified as L. casei based on the physiological characteristics and 16S rDNA sequences analysis. This microorganism was deposited in China General Microbiological Culture Collection Center (CGMCC No. 12415). The murine macrophage RAW264.7 cell line was purchased from the Cell Resource Center, Chinese Academy of Medical Sciences, China. The RAW264.7 cells were cultured in DMEM containing 10% foetal bovine serum, 2 mM L-Glutamine, and 1% antibiotics at 5% CO2, 37 °C.
2.2. Animals
Female BALB/c mice, 6–8 weeks of age, were purchased from the Beijing Vital River Laboratory Animal Technology Co., Ltd. (Beijing, China). Animals were kept in a specific pathogen-free facility at the Inner Mongolia University. Animal care and animal experiments complied with the ethical and experiment regulations for animal care at Inner Mongolia University.
2.3. Chemicals and reagents
DEAE-Sepharose Fast Flow column (D 2.6 × 40 cm) and Sepharose CL-6B gel column (D 1.6 × 100 cm) were purchased from GE, USA. PE-conjugated mAb to CD11c, FITC-conjugated mAb to CD80, CD86, CD40 and MHC II were obtained from eBioscience (San Diego, CA, USA). IL-6, TNF-α, IL-12p70, IL-10, IL-4 and IFN-γ enzyme-linked immunosorbent assay (ELISA) kits were obtained from R&D Systems (MN, USA). Griess Reagent System were purchased from Promega (Wisconsin, USA). Ovalbumin (OVA) was purchased from Sigma Chemical Co., USA, which was passed through a Detoxi-GelTM Endotoxin Removing Gel to reduce endotoxin level below 1 EU per mg of protein, and then quantified with a protein assay kit. Imject® Alum adjuvant (no. 77161) was obtained from Thermo Fisher Scientific (New York, NY, USA). Goat anti-mouse IgG, IgG1, IgG2a and IgG2b were purchased from Sigma Chemical Co. Montanide ISA206 adjuvant and inactivated FMDV type Asia 1 antigen (21.00 μg of 146S protein per mL) were kindly provided by Jin Yu Bao Ling Bio-Pharmaceutical Co. Ltd. (Huhhot, China).
2.4. Extraction, purification and characterization of L-EPS
2.4.1. L-EPS extraction and purification
The L. casei WXD030 EPS were extracted by a slightly modified method described by Ai et al. (Ai et al., Citation2008). The crude EPS were purified by a DEAE-Sepharose Fast Flow column, and the carbohydrate content in the eluent was determined by the phenol-sulfuric acid method using glucose as a standard (Matsuzaki et al., Citation2015). One polysaccharide fraction named L-EPS was obtained by the elution of Tris-HCl buffer with a linear gradient of NaCl concentration. The fraction was further purified on a Sepharose CL-6B gel column. The eluent containing EPS was detected, collected, dialyzed against the deionized water for 2 d at 4°C and then lyophilized.
2.4.2. Spectroscopy analysis
L-EPS solution was scanned on a spectrophotometer UV-1800 from 180 to 400 nm. FT-IR spectra were measured in KBr pellets using the Nicolet-Magna 750 spectrophotometer operating at resolution 4 cm−1 for spectroscopy analysis of L-EPS.
2.4.3. Average molecular weight of L-EPS
The average molecular weight of L-EPS was determined by multi-angle laser light scattering instrument (MALLS) (18°). 200 μL of the purified fraction of 1 mg/mL was loaded, and eluted with 0.1 M sodium chloride buffer at a flow rate of 0.5 mL/min. The eluent was monitored with a refractive index detector (RID).
2.4.4. Monosaccharide analysis
The monosaccharide composition of L-EPS was detected by ion chromatography (IC). L-EPS was hydrolysed as described (Wang, Li, Liu, Chen, & Wei, Citation2015). The dried hydrolysate was dissolved in deionized water. Distilled water, 250 mM NaOH solution and 1 M sodium acetate solution was used as the mobile phase with a gradient elution procedure at a flow rate of 0.5 mL/min at 30°C.
2.5. The immuno-stimulatory effect of L-EPS on macrophage in vitro
2.5.1. Macrophage proliferation assay
The RAW264.7 cells were seeded at 20,000 cells/well in 96-well plate for 4 h at 37°C. Subsequently, different concentrations of L-EPS (0, 125, 250 and 500 μg/mL), as well as LPS (1 μg/mL) were treated for 48 h. At the end of incubation, MTS solution (20 μL) was added to each well and then further incubated for 2 h. Absorbance was recorded at 450 nm on the microplate reader.
2.5.2. Determination of phagocytosis activity
The RAW264.7 cells were added into 96-well plate at 20,000 cells/well and treated with different concentrations of L-EPS (0, 125, 250 and 500 μg/mL), as well as LPS (1 μg/mL) for 48 h. Afterwards, the culture medium was discarded and 200 μL of 0.1% neutral red solution was added to each well and stain for 30 min in an incubator. After incubation, remove the solution and then 200 μL lysis solution was added to each well and incubated for overnight at 4°C. Absorbance was recorded at 490 nm on the microplate reader.
2.5.3. Nitric oxide (NO) production
The RAW264.7 cells were seeded at 20,000 cells/well in 96-well plate. After pre-incubation for 4 h, different concentrations of L-EPS (0, 125, 250 and 500 μg/mL), as well as LPS (1 μg/mL) were treated for 48 h. Afterwards, the conditioned medium was collected and analysed using a Griess Reagent System according to the manufacturer’s protocol.
2.6. Generation of murine bone marrow-derived DCs
The bone marrow-derived DCs (BMDCs) of mice were prepared following the method described by Lutz et al. (Lutz et al., Citation1999) with minor modifications. Briefly, total bone marrow cells were collected from the femurs and tibias of mice. Cells were adjusted to a density of 3 × 10⁶ cells/mL and plated into T75 tissue plastic dish in a volume of 10 mL RPMI-1640 containing 10% (v/v) foetal bovine serum, 20 μg/L murine recombinant GM-CSF, 10 μg/L murine recombinant IL-4 and penicillin/streptomycin. Cells were maintained at 37°C and 5% CO2, and 10 mL fresh BMDCs media was added on day 3. Loosely and nonadherent cells were collected and used as immature BMDCs on day 8.
2.7. BMDCs activation and cytokine secretion
Immature BMDCs (iDCs) harvested on day 8 were plated at 2 × 10⁵ cells/well in 6-well plates overnight and treated with L-EPS (500 μg/mL) or 1 μg/mL LPS (positive control). After incubation for 24 h, BMDCs were collected by gentle pipetting, then the surface expression of CD11c, CD40, CD80, CD86 and MHC II was assessed by labelling with fluorescently tagged monoclonal antibodies. Cells were analysed by flow cytometry, collecting 1 × 10⁴ events per sample, using the FACSort cell analyser.
For the determination of cytokine production of BMDCs or RAW264.7 cells treated with L-EPS, 48 h supernatants were harvested to measure IL-1β, IL-6, IL-12p70, IL-10 and TNF-α by ELISA. The cytokine levels were determined by an automated plate reader at 450 nm.
2.8. Immunization procedures
To investigate the adjuvant effects of different concentrations of L-EPS on antigen-immunization with OVA. The OVA antigen was diluted in PBS (pH 7.4) and then added to each adjuvant: 100, 200, or 400 μg of L-EPS and/or alum adjuvant. The ratio of the adjuvant to the total volume was 50:50 for alum adjuvant (volume v/v). The mice in three different doses groups (eight mice per group) of L-EPS were subcutaneously immunized respectively with 0.2 mL PBS containing 100, 200 or 400 μg of L-EPS (Lee, Hwang, & Yun, Citation2009; Zhang et al., Citation2016; Zhang et al., Citation2017) and 20 μg of OVA; in alum adjuvant group with 0.2 mL of alum adjuvant containing 20 μg of OVA; in L-EPS group with 0.2 mL of PBS containing 200 μg of L-EPS; in OVA group with 0.2 mL of PBS containing 20 μg of OVA; PBS-treated mice as a control group. Blood samples were collected from the retinal vein at day 0, 14 and 28. The samples were stored at 4°C overnight and centrifuged at 3000 rpm for 20 min to isolate the serum. Spleen was obtained after the booster vaccination in order to detect splenocyte proliferation and cytokine production.
To further explore the adjuvant effects of L-EPS on foot and mouth disease virus (FMDV) vaccine. The 146S antigen was diluted in PBS (pH 7.4) and then added to 400 μg of L-EPS and/or Montanide ISA206. The ratio of the adjuvant to the total volume was 50:50 for Montanide ISA206 adjuvant (volume v/v). The mixture was stirred in a water incubator at 300 rpm for 20 min at 30°C to form a water-in-oil-in-water blend. The dropping method was used to test the stability of the vaccines. The amounts of antigen were the same in the different vaccine formulations throughout the study. The selected 40 mice used in experimental vaccination were classified into five groups. 1st group (8 mice) were subcutaneously immunized with 0.2 mL PBS and used as a control group. 2nd group (8 mice) were subcutaneously immunized with 0.2 mL FMDV antigen (146S, 1 μg). 3rd group (8 mice) were subcutaneously immunized with 0.1 mL FMDV antigen (146S, 1 μg) mixed with Montanide ISA206 (0.1 mL). 4th group (8 mice) were subcutaneously immunized with 0.1 mL FMDV antigen (146S, 1 μg) mixed with L-EPS (400 μg EPS in 0.1 mL of PBS). 5th group (8 mice) were subcutaneously immunized with 0.1 mL FMDV antigen (146S, 1 μg) mixed with Montanide ISA206 (0.1 mL) and L-EPS (400 μg). The mice were immunized on days 0 and 14 for each group. All the sera were collected, prepared, and stored in the same way as for experiment 1, for the detection of FMDV-specific IgG.
2.9. Measurement of IgG antibody and isotypes
The assay to measure OVA/FMDV antibodies was performed as described previously (Yoshino & Sagai, Citation1999). Briefly, a total of 100 μL/well of OVA or 146S (5 μg/mL) was coated in 96-well plates overnight at 4°C. Wells were subsequently blocked with 5% BSA for 2 h at 37°C and serial dilutions of the sera sample were added. As secondary antibodies, 100 µL of IgG, IgG1, IgG2a and IgG2b were added and incubated at 37°C for 2 h. The dilutions for these antibodies were at 1:5000 for IgG, IgG1, IgG2a, and IgG2b. After five washes with PBST, 50 µL of the TMB solution were added to each well. The reaction was stopped by addition of 0.2 M of H2SO4 and the resulting OD at 450 nm was analysed with a microplate reader. The endpoint titre was defined as the highest dilution with an OD value higher than the cut-off value (2.1-fold higher than the negative control signal). Logarithms to base 2 (log2) were used for data involving extremely high titres and for the graphical presentation of data.
2.10. T cell proliferation
Mice were sacrificed on day 7 after the second immunization and T cells from the spleen were prepared as described previously (Lyons & Parish, Citation1994). Single T cell suspensions were incubated in 96-well plates at 5 × 10⁴ cells/well in a 5% CO2 incubator. T cell proliferative responses were measured by the carboxyfluorescein succinimidyl ester (CFSE) dilution assay. Briefly, cells were labelled with CFSE as described (Lyons & Parish, Citation1994) and incubated with OVA in a 96-well flat-bottom plate. After 3 d, the cells were collected and proliferation was analysed by flow cytometer.
2.11. Intracellular cytokine staining
Single T cell suspension (1 × 10⁶ cells/mL) were cultured in RPMI-1640 containing 10% (v/v) foetal bovine serum at 37°C for 6 h in the presence of brefeldin A. At the end of stimulation, cells were harvested and surface stained for CD4-FITC, then fixed and permeabilized with 0.1% saponin. Subsequently, cells were stained with intracellular cytokines IFN-γ-PE and IL-4-PE. Approximately 1 × 10⁵ events were acquired on a FACS and data were analysed using De Novo software.
2.12. Splenic DCs staining
To analyse the effect of L-EPS on DCs maturation from splenocyte, mice were sacrificed on day 1, 2 and 3 after the first immunization and DCs in the spleen were prepared as described previously (Duriancik & Hoag, Citation2009). The cell suspension was added to a 1.5 mL Eppendorf tube, to which CD11c-PE and CD40-FITC, CD80-FITC, CD86-FITC and MHC II-FITC were successively added. Armenian hamster IgG isotype control FITC was added to the isotype control tube. Each tube was incubated in the dark at 4°C for 30 min and then washed 5 times with PBS. The samples obtained were used for sorting DCs by flow cytometry.
2.13. Statistical analysis
All experiments were carried out in triplicate. Data were processed and analysed using GraphPad Software. Significance was determined at p-values below 0.05 by analysis of variance (ANOVA). The difference between three or more groups was analysed by one- or two-way ANOVA multiple comparisons. Statistical significance was determined at (*) p < 0.05, (**) p < 0.01.
3. Results
3.1. Analysis of L-EPS
L. casei WXD030 formed smooth, humid and ropy colonies on MRS agar plate after incubation anaerobically at 37°C for 24 h. The polysaccharides were prepared from the fermented broth by removing the bacteria cells and proteins, followed by centrifugation, ethanol precipitation, dialysis, and lyophilization. Finally, about 750 mg/L fluffy exopolysaccharides were obtained.
The crude polysaccharides were then isolated by ion-exchange chromatography and one fraction was obtained ((A)). Then the fraction was further purified by gel filtration chromatography ((B)). There was one single and relatively symmetrical peak appeared on the elution profile for the fraction, indicating the fraction of L-EPS obtained by ion-exchange chromatography and gel filtration chromatography was homogeneous.
Figure 1. The characterization of L-EPS. (A) Elution profile of EPS produced by strain L. casei WXD030 on DEAE-sepharose fast flow column. (B) Elution profile of EPS on Sepharose CL-6B gel column. (C) UV spectra of L-EPS, in the range of 180–400 nm. (D) FT-IR spectra of L-EPS in the range of 600–4000 cm−1. (E) Chromatography of L-EPS by multi-angle laser light scattering instrument (18°). (F) Ion chromatography of L-EPS hydrolysates. The peaks correspond to Glucosamine (peak 1), arabinose (peak 2), D-galactosamine (peak 3), galactose (peak 4), glucose (peak 5), mannose (peak 6) and glucuronic acid (peak 7).
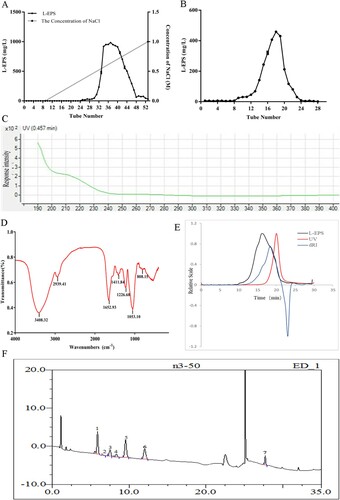
The UV spectra are shown in (C). The L-EPS fraction had no absorption at 280 or 260 nm in the UV spectrum, indicating the absence of protein and nucleic acid. L-EPS was characterized by FT-IR spectroscopy as shown in (D). The characteristic strong broadband around 3408.32 cm−1 indicated the presence of O–H stretching in hydrogen bonds, which was indicative of strong inter- and intra-molecular interactions of the EPS chains. The signal at 2939.41 cm−1 was due to the C–H stretching vibration. The relatively strong absorption peak at around 1652.93 cm−1 indicated characteristic absorption of C=O (Ge, Duan, Fang, Zhang, & Wang, Citation2009). The signals at 1411.84 and 1226.68 cm−1 were assigned to C–O stretching vibrations and O–H deformation vibrations. The absorptions at 1053.10 cm−1 attributed to the stretching vibrations of the pyranose ring. The sample absorption peak at 808.15 cm−1 was the characteristic absorption of mannose (Widjanarko, Nugroho, & Estiasih, Citation2011), which is consistent with monosaccharide composition analysis. Therefore, the FT-IR spectrum analysis suggested it was highly likely that the L-EPS belonged to the hetero-polysaccharide containing pyranose and mannose saccharides.
The average molecular weight of L-EPS was determined by multi-angle laser light scattering instrument (MALLS) (18°). As shown in (E), a single peak was observed on the chromatogram and the molecular weight of L-EPS was determined to be 37.37 kDa. The monosaccharide composition of EPS was analysed using ion chromatography. As shown in (F), seven monosaccharides, including glucosamine, arabinose, D-galactosamine, galactose, glucose, mannose and glucuronic acid, were identified according to the elution time of relative monosaccharide standards. L-EPS was mainly composed of glucose, glucosamine, mannose, in an approximate molar ratio of 1.4:1.1:1.
3.2. The immuno-stimulatory effect of L-EPS on macrophage in vitro
3.2.1. Effect of L-EPS on macrophage proliferation
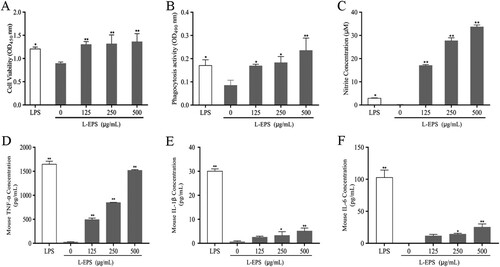
To evaluate the immunomodulatory potentials of L-EPS on macrophage in vitro, we firstly investigated the effect of cells proliferation in the presence of L-EPS with various concentrations (0, 125, 250, and 500 μg/mL). After 48 h incubation with L-EPS, cell viability was evaluated by a modified MTS assay in RAW 264.7 cells. As shown in (A), compared with the control group (0 μg/mL), L-EPS exhibited a significant stimulatory effect on RAW 264.7 cells proliferation at the concentration of 125, 250, and 500 μg/mL for 48 h (p < 0.01).
Figure 2. Effect of L-EPS on RAW 264.7 cells. Cells were cultured with different concentrations (0, 125, 250, 500 μg/mL) of L-EPS for 48 h. LPS (1 μg/mL) was used as positive control. The supernatant nitric oxide levels were determined by Griess reaction and the contents of cytokines were determined using ELISA kits. The minimum detectable dose (MDD) of NO is typically less than 2.5 μM (125 pmol) nitrite. The minimum detectable dose (MDD) of mouse TNF-alpha is typically less than 2 pg/mL. The minimum detectable dose (MDD) of mouse IL-1 beta is typically less than 4.8 pg/mL. The minimum detectable dose (MDD) of mouse IL-6 is typically less than 1.8 pg/mL. (A) Cell proliferation of RAW 264.7 cells pretreated with various concentrations of L-EPS. (B) Effect of various concentrations of L-EPS on RAW 264.7 cells phagocytosis activity. (C) NO production of RAW 264.7 cells pretreated with various concentrations of L-EPS. (D) TNF-α secretion of RAW 264.7 cells pretreated with various concentrations of L-EPS. (E) IL-1β secretion of RAW 264.7 cells pretreated with various concentrations of L-EPS. (F) IL-6 secretion of RAW 264.7 cells pretreated with various concentrations of L-EPS. *p < 0.05, **p < 0.01 compared with the control group (0 μg/mL). Error bars represent ± SEM.
3.2.2. Phagocytosis assay
We subsequently evaluated the effect of L-EPS on the phagocytic activity of RAW264.7 cells by the neutral red uptake assay. (B) showed that L-EPS at a concentration of 125, 250 and 500 μg/mL significantly increased the phagocytosis of RAW264.7 cells for 48 h compared with the control (p < 0.05, p < 0.05, p < 0.01, respectively). The results demonstrated that L-EPS can induce the initiation of immune reaction.
3.2.3. Effects of L-EPS on NO production and cytokine secretion of macrophage
In order to investigate the effects of L-EPS on macrophage response, Griess assay was used to assess NO production in RAW264.7 cells ((C)). L-EPS at a concentration of 500 μg/mL showed the best NO production effect on RAW 264.7 cells for 48 h among all L-EPS-treatment groups. The results demonstrated that L-EPS exhibited remarkable immunomodulatory activities by upregulation of NO secretion in RAW 264.7 cells.
Macrophage activation by immunomodulators is considered to be via the production of cytokines (Schepetkin, Faulkner, Nelson-Overton, Wiley, & Quinn, Citation2005). Thus, the effects of L-EPS on macrophage TNF-α, IL-1β and IL-6 production were analysed in this study. As shown in (D–F), the levels of TNF-α, IL-1β and IL-6 secretion in the culture medium from L-EPS-treated RAW264.7 cells were elevated in a dose-dependent manner.
3.3 L-EPS Induces Maturation and Cytokine Secretion on Murine BMDCs in vitro
BMDCs were generated by cultivating bone marrow cells with the murine GM-CSF and IL-4 recombinant colony-stimulating factor. Routinely, ∼90% of the suspension cell population was CD11c+ on the eighth day of cultivation ((A)), which correlates well with the original protocols for BMDC generation (Inaba et al., Citation1992; Lutz et al., Citation1999). BMDCs were treated for 24 h with L-EPS (500 μg/mL), the MHC II, CD40, CD80, and CD86 expressions on CD11c+ cells were detected by FACs. As shown in (B,C), upon BMDCs maturation by stimulation with LPS and L-EPS, the expression levels of MHC II, CD40, CD80 and CD86 were significantly increased (p < 0.05). This demonstrates that L-EPS measurably activate BMDCs in vitro since it is mature DCs that display antigen and orchestrate downstream adaptive immune responses.
Figure 3. Effects of L-EPS on the expression of cell-surface molecules in BMDCs. (A) BMDCs were differentiated in the presence of GM-CSF and IL-4 for 7 days. Then suspension cell population were marked with FITC-conjugated CD11c for the purification of DCs by flow cytometry. (B) BMDCs from naive BALB/C mice were cultured with PBS, LPS (1 μg /mL), or 500 μg/mL of L-EPS for 24 h. The expressions of CD80, CD86, CD40 and MHC II were determined by Flow cytometric. (C) Representative results from three independent experiments were shown, and the expression levels of cell-surface molecules were quantified as median fluorescence intensity (MFI). The levels of TNF-α (D), IL-6 (E), IL-10 (F) and IL-12p70 (G) were determined by ELISA. The minimum detectable dose (MDD) of mouse IL-10 is typically less than 5.22 pg/mL. The minimum detectable dose (MDD) of mouse IL-12 is typically less than 2.5 pg/mL. Pooled results from three independent experiments are shown as mean ± SEM are shown; Statistical differences were analysed by one-way ANOVA, with significance defined as *P < 0.05, **P < 0.01, compared to the PBS group. Error bars represent ± SEM.
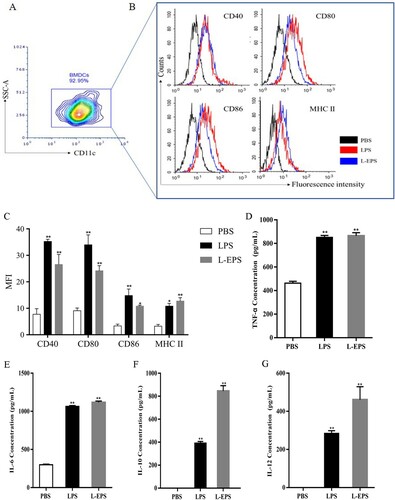
Mature DCs are able to produce pro-inflammatory cytokines, including IL-1β, IL-6, IL-12 and TNF-α, as well as anti-inflammatory cytokines such as IL-10. To investigate the cytokine profile of cultured DCs, the cell supernatant from mDCs-L-EPS was collected to measure IL-10, IL-12p70, IL-6 and TNF-α levels using an ELISA kit. As shown in (D–G), compared with the control group (0 μg/mL), the levels of IL-10, IL-12p70, IL-6 and TNF-α were significantly increased after L-EPS treated (p < 0.01).
3.4. Effect of L-EPS on the production of anti-OVA antibody
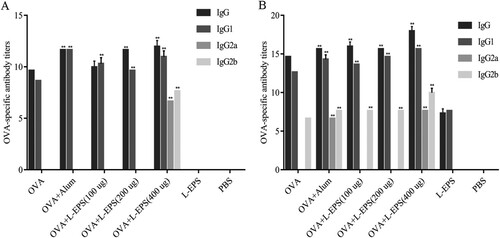
OVA-specific IgG, IgG1, IgG2a and IgG2b antibody levels in the sera were measured after immunization, and a significant enhancement in total serum IgG, IgG1, IgG2a and IgG2b was observed ((A,B)). OVA-immunized mice given different doses of L-EPS showed a dose-dependently enhanced in the secretion of IgG, IgG1, IgG2a and IgG2b, with a maximum response at 400 μg compared with OVA-alone group. The levels of IgG1 and IgG2a have been related to the Th1/Th2 predominance of immune responses because IFN-γ secreted by Th1 cells promotes IgG2a production by B cells, whereas IL-4 secreted by Th2 cells promotes IgG1 production. These findings indicated that OVA-immunized with L-EPS could elicit both Th1 and Th2 type immune responses in vivo.
Figure 4. Effect of L-EPS on anti-OVA IgG and IgG isotypes antibody production. Mice were s.c. injected with 100 μg of OVA with or without 100, 200, or 400 μg of L-EPS or alum adjuvant (Day 0). PBS or 200 μg of L-EPS alone was used as a control. IgG and IgG isotype response in serum samples of 14 (A) and 28 (B) days were detected by ELISA as described in Section 2.9. Each bar represents average values of eight mice, measured in duplicate. The endpoint titre was defined as the highest dilution with an OD value higher than the cut-off value (2.1-fold higher than the negative control signal). Logarithms to base 2 (log2) were used for data involving extremely high titres and for the graphical presentation of data. Significant differences designated as (*P < 0.05, **P < 0.01, OVA alone group vs. OVA + L-EPS or Alum-treated groups). Error bars represent ± SEM.
3.5. Effect of L-EPS on T cell proliferation
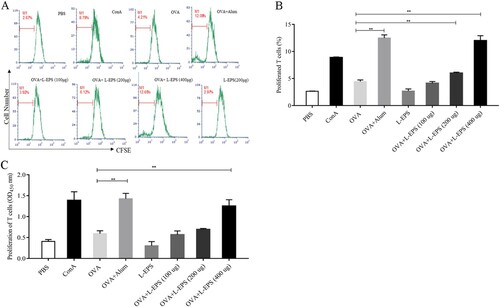
To further determine whether the L-EPS influences cell-mediated immunity, T cell suspensions were prepared from the immunized mice on day 7 after the second immunization. The cells were re-stimulated with OVA and Con A as a positive control. As shown in (A,B), mice immunized with OVA admixed with L-EPS showed dose-dependently increased compared with that in the OVA-alone group (p < 0.01), whereas the T cell proliferative response to OVA + L-EPS (400 μg) group was similar to that in the OVA + Alum group (p > 0.05). In addition, T cell proliferation was evaluated by a modified MTS assay. As shown in (C), compared with the OVA-alone group, OVA + L-EPS (400 μg) group exhibited a significant T cell proliferation in response to OVA (p < 0.01). These results suggested that the L-EPS could induce T cell proliferation.
Figure 5. T cell proliferation in response to L-EPS. Lymphocytes of the immunized mice were isolated on day 7 after the second immunization. The proliferation of T cells was detected by CFSE and MTS analysis. (A) The proliferation responses were analysed in FACS Calibur by setting the gate to the CFSE positive cells indicated as the M1 after 48 h stimulation. (B) The means and SEMs of the fluorescence intensity of proliferated T cells are shown from three experiments. (C) MTS analysis of T cell proliferation in response to L-EPS. Data are expressed as the mean ± standard error of the mean (n = 3). *P < 0.05, **P < 0.01, compared to the OVA alone group. Error bars represent ± SEM.
3.6. Effect of L-EPS on cytokine production in splenocyte
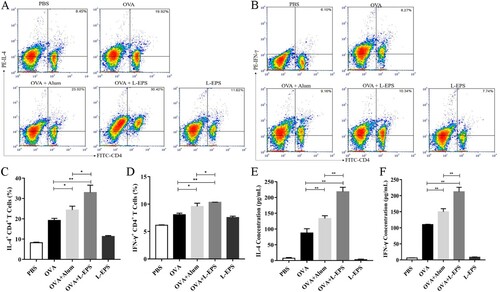
Cytokines play a pivotal role in driving immune responses upon infection or immunization (Arts et al., Citation2018). To examine the production of antigen-specific IFN-γ and IL-4 in CD4+ T cells, splenocytes were intracellular-stained with fluorescent labelled specific antibodies. As shown in (A–D), mice immunized with L-EPS + OVA showed a higher percentage of IFN-γ and IL-4 in CD4+ T cells after the immunizations (p < 0.01). Meanwhile, the percentage of IFN-γ and IL-4 in CD4+ T cells was significantly increased after the immunizations when compared with OVA + Alum group (p < 0.05). To further analyse the type of immune response observed in terms of cytokine levels, IFN-γ and IL-4 were measured from immunized splenocytes stimulated with OVA in vitro ((E–F)). The production of IL-4 and IFN-γ at 400 μg in L-EPS than those of the mice immunized with OVA control group (p < 0.01). Meanwhile, significant differences were observed between the OVA + L-EPS group and OVA + Alum group (p < 0.05). These results were consistent with Ig isotype levels, indicated that L-EPS exerts both Th1 and Th2 type immune responses.
Figure 6. Analysis of production of antigen-specific cytokines by intracellular staining and FACS analysis. T cells isolated and purified from spleen of BALB/c mice after the final boost were stimulated with OVA for 6 h in vitro culture. Intracellular staining and FACS analysis for IL-4 in CD4+ (A) and IFN-γ in CD4+ (B) cells were performed. Representation of the percentage of intracellular cytokines of each group (C, D). The supernatants from T cells were collected for measurement of IL-4 and IFN-γ by ELISA (E, F). The minimum detectable dose (MDD) of mouse IL-4 is typically less than 2 pg/mL. The minimum detectable dose (MDD) of mouse IFN-gamma is typically less than 2 pg/mL. The data shown were representatives of three independent experiments. *P < 0.05, **P < 0.01 using paired Student’s test. Error bars represent ± SEM.
3.7. Effect of L-EPS on promoting DCs maturation
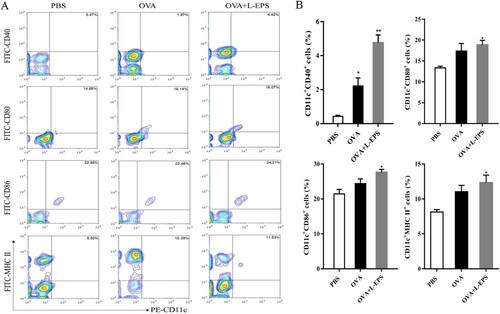
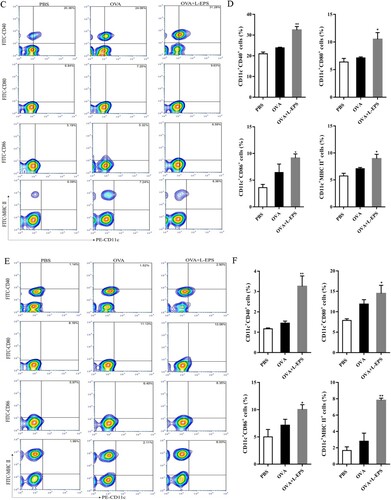
DCs served as a major link between innate and adaptive immunity, then the effect of L-EPS on splenic dendritic cells in vivo was investigated. The expressions of MHC II, CD40, CD86 and CD80 on DCs from the spleen of mice immunized with OVA and OVA + L-EPS were detected by flow cytometry. Mice were sacrificed on 24, 48 and 72 h after the first immunization and DCs in the spleen were prepared. As shown in (A,B), mice immunized with OVA + L-EPS for 24 h induced an increased number of CD11c+MHC II+, CD11c+CD40+, CD11c+CD80+, and CD11c+CD86+ cells, compared to mice treated with PBS (p < 0.05). Similarly, mice immunized with OVA + L-EPS for 48 h ((C–D)) and 72 h ((E–F)) significantly enhanced the levels of MHC II, CD40, CD80 and CD86 on DCs compared to the PBS group (P < 0.05). The results indicated that L-EPS as an adjuvant could promote DCs maturation.
Figure 7. Phenotypes of DCs after immunization by flow cytometry. Splenocytes from immunized mice in each group 24, 48 and 72 h after the first immunization were isolated. Splenocytes were stained with PE-anti-CD11c and FITC-anti-CD40, FITC-anti-CD80, FITC-anti-CD86 and FITC-anti-MHC-II mAbs. The percent of double-positive CD11c+ CD40+, CD11c+ CD80+, CD11c+ CD86+ and CD11c+ MHC II+ cells was plotted. (A) The percent of double-positive cells from immunized mice in group at 24 h after immunization. (B) Representative results from three independent experiments were shown, and the expression levels of cell-surface molecules in group at 24 h after immunization were quantified as median fluorescence intensity (MFI). (C) The percent of double-positive cells from immunized mice in group at 48 h after immunization. (D) Representative results from three independent experiments were shown, and the expression levels of cell-surface molecules in group at 48 h after immunization were quantified as median fluorescence intensity (MFI). (E) The percent of double-positive cells from immunized mice in group at 72 h after immunization. (F) Representative results from three independent experiments were shown, and the expression levels of cell-surface molecules in group at 72 h after immunization were quantified as median fluorescence intensity (MFI). The data represent the mean ± SEM of double-positive cells percentages and were analysed by one-way ANOVA. *P < .05, **P < .01, compared to the PBS group. Error bars represent ± SEM.
3.8. Effect of L-EPS on the production of FMDV-Specific IgG levels
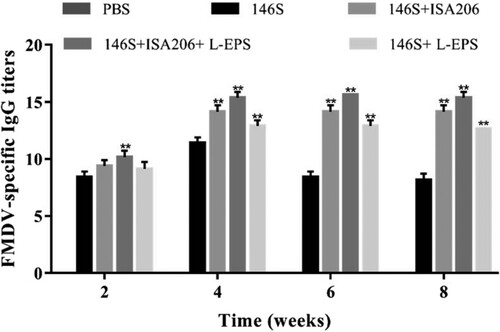
The immune response against FMDV was studied in a murine model. Five groups of 40 mice were vaccinated with FMDV antigen (146S) mixed with PBS, Montanide ISA206, L-EPS (400 μg) or Montanide ISA206 containing L-EPS (400 μg) at 2-week intervals. The results showed that the vaccine in L-EPS supplemented with Montanide ISA206 induced significantly higher serum IgG levels than did the antigen (146S) in PBS during the period from 1 week before to 6 weeks after the second immunization. There was no significant difference in IgG responses between the mice vaccinated with FMDV vaccine in L-EPS and the mice treated with the vaccine in Montanide ISA206 ().
Figure 8. Duration of serum FMDV-specific IgG responses. Mice (n = 8/group) were s.c. immunized with FMDV antigen (146S, 1 μg) and FMDV antigen (146S, 1 μg) plus PBS, L-EPS (400 μg), ISA206, or ISA206 plus L-EPS (400 μg) on days 1 and 14. Serum were collected 2, 4, 6 and 8 weeks after boosting for analysis of FMDV-specific IgG levels by an indirect ELISA. The values are presented as means ± SEM. P-value <0 .05 was considered significantly different (*P < 0.05, **P < 0.01 vs. 146S group). Error bars represent ± SEM.
4. Discussion
Bacterial EPSs are known as a key mediator of cross-talk between probiotic and host immune system (Lenoir et al., Citation2016; Rochat et al., Citation2007; Schiffer et al., Citation2011). EPSs derived from lactobacillus also provide beneficial functions to human health, including anti-tumor activities, anti-inflammatory properties and immune-modulating activities (Ciszek-Lenda et al., Citation2012; Khalil et al., Citation2018; Liu et al., Citation2011; Yasuda, Serata, & Sako, Citation2008). Here, we characterized the structure of the EPSs produced by L. casei WXD030 and evaluated the adjuvant effects and mechanism of L-EPS in vitro and in vivo. Subcutaneous administration of L-EPS significantly promoted humoral and cellular immune responses by increasing serum antibodies and T cell proliferation, enhancing the expression of cytokines, up-regulating the DC maturation.
Macrophages are known to play a critical role in innate immunity and attack, destroy and ingest foreign substances by producing cytokines and NO (Jeong, Kim, & Min, Citation2018). In this study, we investigated the immuno-stimulatory effects of L-EPS on RAW264.7 cells by examining the phagocytic activity and the production of NO and cytokines. The results suggested that L-EPS could enhance the phagocytic capacities of RAW264.7 cells. NO is involved in the activation of macrophages and also mediates a number of biological functions as an intracellular messenger molecule. Meanwhile, cytokines, like TNF-α, IL-1β and IL-6, are mainly produced by activated macrophages also play an important role in the immune system (Liu, Li, Xu, & Li, Citation2017; Yang et al., Citation2015). Not surprisingly, in the present study, L-EPS was found to stimulate the production of NO, TNF-α, IL-6 and IL-1β in RAW 264.7 macrophages.
DCs operate at the interface of innate and acquired immunity, and they are critical to the initiation of the adaptive immune response by activating naïve T cells. In this study, MHC II, CD80, CD86, and CD40 were highly expressed on the cell surface of L-EPS treated DCs. Similarly, OVA plus L-EPS induced remarkably higher DCs recruitment in the spleen compared to the PBS-treated mice. We found that the L-EPS could promote the maturation of DCs in vitro and in vivo. Mature DCs secrete a wide spectrum of cytokines and chemokines such as IL-12 and IL-10 that are capable of increasing T cell activation (Feng et al., Citation2017). Our data showed the yields of TNF-α and IL-12 were increased in a dose-dependent manner and L-EPS could also induce the DCs to secrete high levels of IL-6 and IL-10.
We further investigated the effects of L-EPS on antigen-specific antibody and cytokine production in a murine model sensitized with OVA antigen. The splenocyte proliferation is significantly higher in the group of L-EPS plus OVA immunization than that in other groups. Meanwhile, L-EPS could increase the titres of OVA-specific IgG, IgG1, IgG2a, and IgG2b. That is, the adjuvant efficacy of L-EPS was the same as alum. Unlike alum adjuvant, L-EPS possessed the potential adjuvant activity to both cellular and humoral immunity.
Th1 responses support cell-mediated immunity, whereas Th2 responses support humoral immunity against infection (Rubab & Ali, Citation2016). Both Th1 responses and Th2 responses are required for the protective immunity. The widely applied adjuvants, such as alum and oil/water emulsions, can only elicit Th2 immune response. We selected IL-4 and IFN-γ as the indicators to indirectly evaluate the levels of immunities in mice. L-EPS could induce more IL-4 and IFN-γ secretions than alum. Moreover, compared to alum adjuvant, L-EPS also up-regulated IFN-γ and IL-4 expression in CD4+ T cells. Thus, strong helper T-cell responses and cytokine secretions were observed as a result of L-EPS vaccination, suggesting that L-EPS could more efficiently stimulate lymphocytes to secret the Th1-type cytokine and the Th2-type cytokine than alum adjuvant.
We further investigated the effect of L-EPS as the adjuvant on enhancement of antibody responses of foot-and-mouth disease (FMD) vaccine in a mouse model. FMD is a highly contagious and economically important disease of cloven-hoofed livestock (Wu et al., Citation2017). Studies showed that humoral immune responses are important in protection against FMD (Li et al., Citation2016). The present study showed that L-EPS promoted a significantly greater serum IgG response than FMDV group. It was very interesting that we found Montanide ISA206 combination with L-EPS (400 μg) promoted a significantly greater serum IgG response induced by FMD vaccine than did L-EPS or Montanide ISA206 as adjuvant respectively, indicating the synergistic adjuvant activities of L-EPS and Montanide ISA206.
In conclusion, our results demonstrated L-EPS is a safe and efficacious adjuvant and can be potentially used to develop subunit vaccines. In order to understand the potential of L-EPS as an adjuvant, the mechanism of L-EPS should be further explored.
Acknowledgement
We are grateful to Xia Wu from the State Key Laboratory of Reproductive Regulation & Breeding of Grassland Livestock, Inner Mongolia University, for his help in FACS analysis.
Disclosure statement
No potential conflict of interest was reported by the authors.
Additional information
Funding
References
- Abel, L. C. J., Chen, S., Ricca, L. G., Martins, M. F., Garcia, M., Ananias, R. Z., & Longo-Maugéri, I. M. (2009). Adjuvant effect of LPS and killed Propionibacterium acnes on the development of experimental gastrointestinal nematode infestation in sheep. Journal of Nanchang University, 31(10), 604–612.
- Ai, L., Zhang, H., Guo, B., Chen, W., Wu, Z., & Wu, Y. (2008). Preparation, partial characterization and bioactivity of exopolysaccharides from Lactobacillus casei LC2W. Carbohydrate Polymers, 74(3), 353–357. doi: https://doi.org/10.1016/j.carbpol.2008.03.004
- Arts, R. J. W., Moorlag, S. J. C. F. M., Novakovic, B., Li, Y., Wang, S.-Y., Oosting, M., Netea, M. G. (2018). BCG vaccination protects against experimental viral infection in humans through the induction of cytokines associated with trained immunity. Cell Host & Microbe, 23(1), 89-100. e105. doi: https://doi.org/10.1016/j.chom.2017.12.010
- Chen, Q., Qi, C., Peng, G., Liu, Y., Zhang, X., & Meng, Z. (2018). Immune-enhancing effects of a polysaccharide PRG1-1 from Russula griseocarnosa on RAW264.7 macrophage cells via the MAPK and NF-κB signalling pathways. Food and Agricultural Immunology, 1–12. doi: https://doi.org/10.1080/09540105.2018.1461198
- Chiang, S.-S., Liu, C.-F., Tseng, K.-C., Mau, J.-L., & Pan, T.-M. (2012). Immunomodulatory effects of dead Lactobacillus on murine splenocytes and macrophages. Food and Agricultural Immunology, 23(2), 183–202. doi: https://doi.org/10.1080/09540105.2011.609246
- Ciszek-Lenda, M., Nowak, B., Oeróttek, M. G., Górska-Fr¥Czek, S., Gamian, A., & Marcinkiewicz, J. (2012). Immunosuppressive effect of systemic administration of Lactobacillus rhamnosus KL37C-derived exopolysaccharide on the OVA-specific humoral response. Central-European Journal of Immunology, 37(4), 338–344. doi: https://doi.org/10.5114/ceji.2012.32722
- Ciszek-Lenda, M., Strus, M., Górska-Frączek, S., Targosz-Korecka, M., Śróttek, M., Heczko, P. B., & Marcinkiewicz, J. (2011). Experimental immunology strain specific immunostimulatory potential of lactobacilli-derived exopolysaccharides. [journal article]. Central European Journal of Immunology, 36(3), 121–129.
- Duriancik, D. M., & Hoag, K. A. (2009). The identification and enumeration of dendritic cell populations from individual mouse spleen and Peyer’s patches using flow cytometric analysis. Cytometry Part A, 75A(11), 951–959. doi: https://doi.org/10.1002/cyto.a.20794
- Feng, C., Feng, M., Jiao, R., Liu, D., Jin, Y., Zhao, X., & Xiao, R. (2017). Effect of dezocine on IL-12 and IL-10 secretion and lymphocyte activation by culturing dendritic cells from human umbilical cord blood. European Journal of Pharmacology, 796, 110–114. doi: https://doi.org/10.1016/j.ejphar.2016.12.035
- Ge, Y., Duan, Y., Fang, G., Zhang, Y., & Wang, S. (2009). Polysaccharides from fruit calyx of Physalis alkekengi var. francheti: Isolation, purification, structural features and antioxidant activities. Carbohydrate Polymers, 77(2), 188–193. doi: https://doi.org/10.1016/j.carbpol.2008.12.020
- Giahi, L., Elmadfa, I., Hoseini, M., & Klein, P. (2013). Heat-inactivated Lactobacillus rhamnosus and Lactobacillus delbrueckii induce efficient maturation and differential cytokine production in human monocyte derived dendritic cells. Food and Agricultural Immunology, 24(1), 95–109. doi: https://doi.org/10.1080/09540105.2011.651445
- Inaba, K., Inaba, M., Romani, N., Aya, H., Deguchi, M., Ikehara, S., & Steinman, R. M. (1992). Generation of large numbers of dendritic cells from mouse bone marrow cultures supplemented with granulocyte/macrophage colony-stimulating factor. Journal of Experimental Medicine, 176(6), 1693–1702. doi: https://doi.org/10.1084/jem.176.6.1693
- Jeong, S. H., Kim, J., & Min, H. (2018). In vitro anti-inflammatory activity of the Artemisia montana leaf ethanol extract in macrophage RAW 264.7 cells. Food and Agricultural Immunology, 1–11. doi: https://doi.org/10.1080/09540105.2018.1439454
- Khalil, E. S., Manap, M. Y., Mustafa, S., Amid, M., Alhelli, A. M., & Aljoubori, A. (2018). Probiotic characteristics of exopolysaccharides-producing Lactobacillus isolated from some traditional Malaysian fermented foods. CyTA – Journal of Food, 16(1), 287–298. doi: https://doi.org/10.1080/19476337.2017.1401007
- Lee, S. H., Hwang, H. S., & Yun, J. W. (2009). Production of polysaccharides by submerged mycelial culture of entomopathogenic fungus Cordyceps takaomontana and their apoptotic effects on human neuroblastoma cells. Korean Journal of Chemical Engineering, 26(4), 1075–1083. doi: https://doi.org/10.1007/s11814-009-0179-6
- Lenoir, M., del Carmen, S., Cortes-Perez, N. G., Lozano-Ojalvo, D., Muñoz-Provencio, D., Chain, F., & Bermúdez-Humarán, L. G. (2016). Lactobacillus casei BL23 regulates Treg and Th17 T-cell populations and reduces DMH-associated colorectal cancer. Journal of Gastroenterology, 51(9), 862–873. doi: https://doi.org/10.1007/s00535-015-1158-9
- Li, R., Ma, Y., Zhai, L., Lu, Y., Chi, X., Wu, J., & Hu, S. (2016). Enhanced immune response to foot-and-mouth disease vaccine by oral administration of ginseng stem-leaf saponins. Immunopharmacology and Immunotoxicology, 38(4), 257–263. doi: https://doi.org/10.1080/08923973.2016.1184680
- Liu, L., Li, H., Xu, R.-H., & Li, P.-L. (2017). Expolysaccharides from Bifidobacterium animalis RH activates RAW 264.7 macrophages through toll-like receptor 4. Food and Agricultural Immunology, 28(1), 149–161. doi: https://doi.org/10.1080/09540105.2016.1230599
- Liu, C. F., Tseng, K. C., Chiang, S. S., Lee, B. H., Hsu, W. H., & Pan, T. M. (2011). Immunomodulatory and antioxidant potential of Lactobacillus exopolysaccharides. Journal of the Science of Food & Agriculture, 91(12), 2284–2291.
- Lutz, M. B., Kukutsch, N., Ogilvie, A. L. J., Rössner, S., Koch, F., Romani, N., & Schuler, G. (1999). An advanced culture method for generating large quantities of highly pure dendritic cells from mouse bone marrow. Journal of Immunological Methods, 223(1), 77–92. doi: https://doi.org/10.1016/S0022-1759(98)00204-X
- Lyons, A. B., & Parish, C. R. (1994). Determination of lymphocyte division by flow cytometry. Journal of Immunological Methods, 171(1), 131–137. doi: https://doi.org/10.1016/0022-1759(94)90236-4
- Matsuzaki, C., Hayakawa, A., Matsumoto, K., Katoh, T., Yamamoto, K., & Hisa, K. (2015). Exopolysaccharides produced by Leuconostoc mesenteroides strain NTM048 as an immunostimulant to enhance the mucosal barrier and influence the systemic immune response. Journal of Agricultural and Food Chemistry, 63(31), 7009–7015. doi: https://doi.org/10.1021/acs.jafc.5b01960
- Mbow, M. L., Gregorio, E. D., Valiante, N. M., & Rappuoli, R. (2010). New adjuvants for human vaccines. Current Opinion in Immunology, 22(3), 411–416. doi: https://doi.org/10.1016/j.coi.2010.04.004
- Meng, M., Cheng, D., Han, L., Chen, Y., & Wang, C. (2017). Isolation, purification, structural analysis and immunostimulatory activity of water-soluble polysaccharides from Grifola frondosa fruiting body. Carbohydrate Polymers, 157, 1134–1143. doi: https://doi.org/10.1016/j.carbpol.2016.10.082
- Oleksy, M., & Klewicka, E. (2018). Exopolysaccharides produced by Lactobacillus sp.: Biosynthesis and applications. Critical Reviews in Food Science and Nutrition, 58(3), 450–462. doi: https://doi.org/10.1080/10408398.2016.1187112
- Pohanka, M., Vobornikova, I., & Fusek, J. (2016). Freund's complete adjuvant effect on BALB/c mice: An insight into inflammation and oxidative stress after immunity challenge. Bratislavske Lekarske Listy, 117(5), 268–271.
- Rochat, T., Bermúdez-Humarán, L., Gratadoux, J.-J., Fourage, C., Hoebler, C., Corthier, G., & Langella, P. (2007). Anti-inflammatory effects of Lactobacillus casei BL23 producing or not a manganese-dependant catalase on DSS-induced colitis in mice. Microbial Cell Factories, 6(1), 22. doi: https://doi.org/10.1186/1475-2859-6-22
- Rubab, I., & Ali, S. (2016). Dried fruit extract of Terminalia chebula modulates the immune response in mice. Food and Agricultural Immunology, 27(1), 1–22. doi: https://doi.org/10.1080/09540105.2015.1055554
- Schepetkin, I. A., Faulkner, C. L., Nelson-Overton, L. K., Wiley, J. A., & Quinn, M. T. (2005). Macrophage immunomodulatory activity of polysaccharides isolated from Juniperus scopolorum. International Immunopharmacology, 5(13–14), 1783–1799. doi: https://doi.org/10.1016/j.intimp.2005.05.009
- Schiffer, C., Lalanne, A. I., Cassard, L., Mancardi, D. A., Malbec, O., Bruhns, P., & Daëron, M. (2011). A strain of Lactobacillus casei inhibits the effector phase of immune inflammation. The Journal of Immunology, 187(5), 2646–2655. doi: https://doi.org/10.4049/jimmunol.1002415
- Wang, Y., Li, Y., Liu, Y., Chen, X., & Wei, X. (2015). Extraction, characterization and antioxidant activities of Se-enriched tea polysaccharides. International Journal of Biological Macromolecules, 77(6182), 76–84. doi: https://doi.org/10.1016/j.ijbiomac.2015.02.052
- Widjanarko, S. B., Nugroho, A., & Estiasih, T. (2011). Functional interaction components of protein isolates and glucomannan in food bars by FTIR and SEM studies. African Journal of Food Science, 5, 12–21.
- Wu, M., He, M., & Kang, Y. (2017). Vitamin C supplementation improved the efficacy of foot-and-mouth disease vaccine. Food and Agricultural Immunology, 1–14. doi: https://doi.org/10.1080/09540105.2017.1406459
- Yang, T., Peleli, M., Zollbrecht, C., Giulietti, A., Terrando, N., Lundberg, J. O., & Carlström, M. (2015). Inorganic nitrite attenuates NADPH oxidase-derived superoxide generation in activated macrophages via a nitric oxide-dependent mechanism. Free Radical Biology and Medicine, 83, 159–166. doi: https://doi.org/10.1016/j.freeradbiomed.2015.02.016
- Yasuda, E., Serata, M., & Sako, T. (2008). Suppressive effect on activation of macrophages by Lactobacillus casei strain Shirota genes determining the synthesis of cell wall-associated polysaccharides. Applied & Environmental Microbiology, 74(15), 4746–4755. doi: https://doi.org/10.1128/AEM.00412-08
- Yoshino, S., & Sagai, M. (1999). Induction of systemic Th1 and Th2 immune responses by oral administration of soluble antigen and diesel exhaust particles. Cellular Immunology, 192(1), 72–78. doi: https://doi.org/10.1006/cimm.1998.1427
- Zhang, A., Yang, X., Li, Q., Yang, Y., Zhao, G., Wang, B., & Wu, D. (2018). Immunostimulatory activity of water-extractable polysaccharides from Cistanche deserticola as a plant adjuvant in vitro and in vivo. PLOS ONE, 13(1), e0191356. doi: https://doi.org/10.1371/journal.pone.0191356
- Zhang, A., Yang, Y., Wang, Y., Zhao, G., Yang, X., Wang, D., & Wang, B. (2017). Adjuvant-active aqueous extracts from Artemisia rupestris L. Improve immune responses through TLR4 signaling pathway. Vaccine, 35(7), 1037–1045. doi: https://doi.org/10.1016/j.vaccine.2017.01.002
- Zhang, W., Zheng, X., Cheng, N., Gai, W., Xue, X., Wang, Y., & Xia, X. (2016). Isatis indigotica root polysaccharides as adjuvants for an inactivated rabies virus vaccine. International Journal of Biological Macromolecules, 87, 7–15. doi: https://doi.org/10.1016/j.ijbiomac.2016.02.023