
ABSTRACT
One-step fluorescence immunochromatographic assay (FICA) has been developed using fluorescent microspheres-labelled monoclonal antibody (McAb) probe for the rapid detection of copper ions in herbal plants and soil samples were investigated in this study. The results can be read by the fluorescence reader according to the fitted standard curve equation. Under optimal conditions, detecting copper ions with FICA can be done within 15 min with a LOD (limit of detection) of 0.2 μg/L, and was very useful for the rapid onsite testing. A total of 31 solid samples were pre-treated by microwave digestion combined with cation exchange solid phase extraction and prepared as test samples for FICA and ICP-AES. The two methods showed good relativity with correlation coefficients of 0.924 and 0.969 in herbal plants and soil samples for copper detection, respectively. We hope that our research can help promote the daily monitoring of heavy metal pollution effectively.
1. Introduction
Although heavy metals are widely distributed in the natural world, the rapid expansion of cities and the industrial development have led to a large amount of heavy metals being released into our living environment, some of them have even entered our body through polluted drinking water and herbs as part of our food chains. Heavy metals can cause various diseases and exhibit teratogenic, carcinogenic and mutagenic effects that could seriously endanger the health of humans and animals (Qu et al., Citation2018; Resende et al., Citation2018; Sharma et al., Citation2018). Copper is a trace element essential to the human body and is relatively weak in toxicity (Sohrabi et al., Citation2017). However, due to its wide application in industry, agriculture and animal husbandry, the potential hazards of copper pollution have attracted lots of attention. Copper pollution prominent in the interior and exterior of “blue oysters” and “green oysters” in offshore and estuary areas indicated that the marine environment is seriously affected (Wang et al., Citation2011). In addition, high doses of copper in feeds can enter the body of livestock and result in poisoning or death. This can also threaten human health through bio-accumulation effect (Xiong et al., Citation2010). Therefore, the inspection and detection of heavy metals such as copper should be considered seriously.
Current analytical methods for metal ion detections involve techniques such as AAS (Atomic Absorption Spectroscopy), AFS (Atomic Fluorescence Spectrometry), ICP (Inductively Coupled Plasma), etc.; however, the applications of these physical or chemical methods require precise apparatuses and professional staffs, and are therefore, not ideal for detecting metal ions in urgent incidents or in large-scale environmental quality screening tests (Elmizadeh et al., Citation2017; Lin et al., Citation2016; Pulgarín et al., Citation2016). In contrast, immunological detection methods are convenient, rapid, low-cost, high-sensitivity and specificity, which make them the preferred approach for rapid onsite detection of metal ions in large quantities (Liu et al., Citation2012; Ouyang et al., Citation2016; Yao et al., Citation2016).
Based on monoclonal antibody technology, it’s the key to immunological detection of heavy metals by designing an effective complete copper antigen to immunize mice and screen for highly specific monoclonal antibodies against copper antigens. In addition, effective pre-treatment of environmental samples is also critical. In this study, microwave digestion combined with cation exchange solid phase extraction was used to pretreat herbal plants and soil samples. Chelating agents in the eluent were added to conjugate the copper ions released from the solid samples to make them become haptenic molecules with reactogenicity that can be specifically recognized by anti-copper McAb.
Fluorescence Immunochromatographic Assay Quantitative Detection is an emerging technology in the Point of Care Testing (POCT) field and is capable of accomplishing rapid and sensitive quantitative detection of indicators (Zhang et al., Citation2011). By coupling the fluorescent microspheres with antibodies, the intensity of signal generated as a result of antigen–antibody specific binding reaction is correlated with the content level of reactants or products. In addition, the level of analytes can also be derived from the signal intensity by calculations. The fluorescence-labelled microspheres exhibit high particle size uniformity and stability upon covalent binding to the antibodies. The detection sensitivity of FICA is also higher than that of the colloidal gold technology due to the amplified excitation light irradiation signals (Wang et al., Citation2014; Zhou et al., Citation2014).
In this study, we developed a rapid quantitative detection method of fluorescence immunochromatographic test strips using self-made high-quality anti-copper McAb for copper detection. The copper ions from the environmental samples were digested and then separated and enriched by the solid phase extraction column with some modifications. A total of 31 real samples were applied to test the performances of the FICA and were compared with ICP-AES very well. This approach could be an efficient, convenient, accurate and inexpensive new method for detecting heavy metals.
2. Materials and methods
2.1. Reagents and instruments
Copper and other metal standard solutions were purchased from National Steel Material Testing Center, Iron and Steel Research Institute. GBW07602 (GSV-1) and GBW07404 (GSS-4) were purchased from National Standards Network. Bifunctional chelator p-SCN-Bn-NOTA (2-S-(4-Isothiocyanatobenzyl)-1,4,7-triazacyclononane-1,4,7-triacetic acid) and Monofunctional chelator NOTA were purchased from Macrocyclics Co. Ovalbumin (OVA) was purchased from Sigma Chemical Co. BCA protein assay kit was purchased from Beyotime Institute of Biotechnology. Cu-NOTA-OVA and anti-copper McAb were prepared in our laboratory. Centricon-30 concentrator was purchased from Millipore Co. Polystyrene nano fluorescent microspheres, EDC (1-ethyl-3-(3-dimethyl-aminopropyl) carbodiimide hydrochloride), NHS (N-hydroxysulfosuccinimide), nitrocellulose membrane (NCM), glass fibre mat and dedicated diluted solution were from Guangzhou Wondfo Biotechnology Co. Cation exchange resin (MK212) was purchased from GSA Co. Ultrapure water was used for all solution preparation unless otherwise stated.
The main apparatuses used in this study include MARS 6 microwave digestion instrument (PyNN Co.), GS-1 acid stimulator (Nanjing RNK Science and tech Co.), X-Series 2 ICP-AES (Thermo Fisher Scientific Co.), PinAAcle AA900 T AAS (PerkinElmer Co.), ULTRA 55 Field emission scanning electron microscope (Carl Zeiss Co.), UV-visible spectrophotometer (Beijing Persee General Instrument Co.), SCIENTZ-IID ultrasonic cell crusher (Ningbo Scientz Biotechnology Co.), IsoFlow Dispenser film spraying machine (Imagene Technology Co.), Spray pad machine and High speed cutting machine (Hangzhou Autokun Technology Co.), Finecare-II immune-fluorescence quantitative detector (Guangzhou Wondfo Biotechnology Co.).
2.2. Preparation and identification of the coating antigen and monoclonal antibody
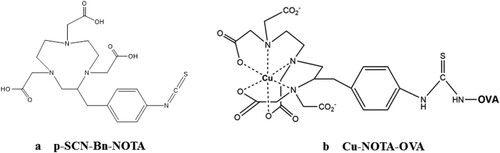
The Coupling of Cu2+ with the carrier protein OVA via the bifunctional chelator p-SCN-Bn-NOTA was performed as follows: prepared the NOTA solution with DMSO and the OVA solution with 0.1 mol/L HEPES buffer (pH 8.9). The copper standard solution was diluted with ultrapure water. Then, NOTA solution was added dropwise to the OVA solution at an appropriate molar ratio, and allowed to chelate in an ice bath for 4 h. Subsequently, the Cu2+ solution was added in drops to NOTA-OVA solution at a suitable molar ratio and stirred for 30 min in an ice bath until the reaction solution turned to light blue with slight turbidity. The uncoupled p-SCN-Bn-NOTA and Cu2+ were removed from Cu-NOTA-OVA by ultrafiltration through a centricon-30 concentrator. To prepare mouse ascites type antibody, recovered cryopreserved cell strains that stably secreted anti-copper McAb and expanded in culture were used. The antibody was precipitated using saturated ammonium sulphate and purified by Protein G affinity column. Pre-prepared and qualified synthetic antigens, along with monoclonal antibodies in our laboratory, were employed in this study.
The concentration of protein conjugate was determined by the BCA protein assay, and the total copper content in the Cu-NOTA-OVA was determined by ICP-AES. Cu-NOTA-OVA was lyophilized and stored at−20°C until use. The chemical structures of p-SCN-Bn-NOTA and Cu-NOTA-OVA are shown in .
Figure 1. Chemical structures of p-SCN-Bn-NOTA (a) and Cu-NOTA-OVA (b).
2.3. Preparation and identification of fluorescent microspheres-labelled anti-copper McAb
To prepare fluorescent microsphere-McAb complexes, suitable commercial polystyrene fluorescent microspheres were selected and coupled to anti-copper McAb through EDC-NHS mediated method. First, EDC and NHS solution was added in turns into the ultrasonically dispersed fluorescent microsphere liquid. The mixture was then quickly reversed and evenly activated at room temperature for 15 min. Subsequently, the supernatant was removed after centrifugation and ultrasonically dispersed after the addition of the reaction solution. Then, the anti-copper McAb was added after cleaning of the activator twice, and the solution was mixed at room temperature away from light for 2–2.5 h. The supernatant was again removed after centrifugation, and 1% BSA blocking solution was mixed into the solution at room temperature away from light for 1 h to block building sites. Finally, the supernatant was removed after another centrifugation and ultrasonically dispersed at low-temperature after addition of the protection solution, then stored at 4°C away from light. Absorption peaks of McAb before and after labelling with fluorescent microspheres were detected by UV-vis spectrophotometer.
2.4. Preparation of immunochromatographic test strips
First, the coated antigen Cu-NOTA-OVA and rabbit IgG were diluted to a working concentration of 0.5 μg/μl. Then, the antigen and secondary antibody were uniformly sprayed on the NCM at 0.15 μl/mm and dried at 50°C for 24 h in order to prepare the T-line and C-line. Next, the fluorescent microsphere-McAb complexes and goat-anti-rabbit (GAR) antibody were diluted to a working concentration of 0.04 μg/μl and 0.01 μg/μl, respectively, and sprayed onto the glass fibre mat at 4 μl/cm and dried at 50°C for 12 h. In the method, the C-line system adopted a separate set of rabbit-derived antibodies, which can avoid interference of the T-line to the C-line, so as to ensure the relative stability of the C-line values. After that, the dried glass fibre mat, NCM, and absorbent paper were sequentially attached to the PVC board. Finally, the test strips were cut into 4 mm wide pieces, plastic shells were added to assemble the test strip cards, and the cards were kept dry (Humidity ≤ 30%) at room temperature away from light.
2.5. Establishment of FICA
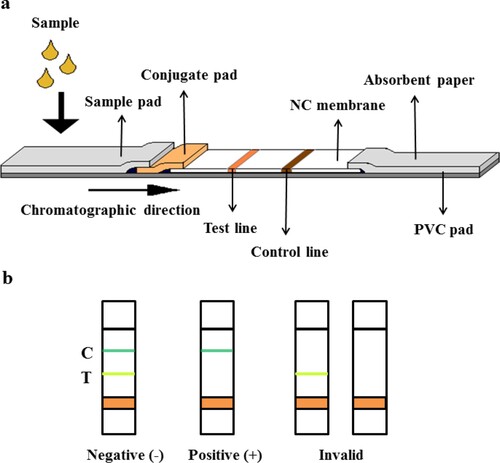
Serial concentrations (0–100 ng/ml) of the standard solutions (Cu-NOTA) were prepared, and 75 μl of it was added to the sample adding area per card. The T-line and C-line signal values were determined by the immune-fluorescence quantitative detector after 15 min of reaction. Each test was performed on 10 parallel groups to obtain a mean value, and the relevant linear parameter was calculated by the competition inhibition standard curve. The principle of the immunochromatographic test strip reaction was illustrated in .
Figure 2. The cross-section structure of fluorescence immunochromatographic test strip (a) and the results judgment of immunochromatographic test strips (b).
2.6. Repeatability, specificity and stability evaluation of FICA
Three batches of test strips were produced. In the linear range of FICA, concentrations of standard solutions ranged from 3 to 30 ng/ml were used to detect the fluorescence signals of intra-assay and inter-assay for 10 parallel repetitions. The accuracy and precision of FICA were evaluated by comparing the detected concentrations from these repeated experiments.
The cross-reactivity of anti-copper McAb against monofunctional NOTA and hapten of other different metal ions such as lead and cadmium was examined. The experiment was repeated 3 times in parallel to calculate cross-reactivity and evaluate the specificity of FICA. Cross-reactivity of each metal ions was calculated by the formula CR (%) = [IC50 (copper ions) / IC50 (other metal ions)] × 100%.
Accelerated aging test was designed to explore the stability of the test strips. According to the Arrhenius equation, 1 year at 25°C is equivalent to 9 days at 60°C, or 91 days (about 3 months) at 37°C (Sierra, Citation2012). The test strips were kept dry at 37°C away from light for 1–4 weeks. Concentrations of standard solutions ranged from 3 to 30 ng/ml were used to detect the fluorescence signals at each week for 3 parallel repetitions. The stability of FICA was evaluated by comparing the detected concentration and results from SPSS analysis.
Concentrations of standard solutions ranged from 3 to 30 ng/ml were prepared with tap water, CB buffer, and dedicated diluted solution, respectively. The experiment was repeated 3 times in parallel and the recovery concentrations were calculated to evaluate the impact of systematic errors in the FICA.
2.7. Pre-treatment of herbal plants and soil samples
Solid herbal plants and soil samples were dried to a constant weight, and pulverized to uniform small particle powder using a pulverizer and a mortar, respectively. Then, 0.2000 g of the powder was mixed with 8 ml HNO3 to pre-digest the sample in acid stimulator at 130°C for 30 min. A suitable digestion programme was selected. The specific digestion procedures included: increased temperature to 130°C for 10 min and kept constant for 3 min; increased to 160°C for 3 min and kept for 5 min; increased to 180°C for 3 min and kept for 30 min; followed by cooling. After that, acid remover was used to vaporize the remaining acid and diluted the herbal plants and soil samples to 10 and 25 ml, respectively. The digestion solution was filtered through filter paper and 0.22 μm filter in turns. Standard substances including GBW07602 (GSV-1, bush branches) and GBW07404 (GSS-4, soil) were digested along with herbal plants and soil samples. The copper content of these substances was detected by AAS. The digestion recovery rates were calculated to assess the quality of the digestion process (Huang, Citation2012; Ipeaiyeda & Ayoade, Citation2017; Meunier et al., Citation2006).
2.8. Separation, enrichment and detection of copper ions in the samples
According to the principle of solid phase extraction, the cation exchange resin was modified for the separation and enrichment of copper ions. The purchased MK212 resin has been treated by the manufacturer through sodium salt: The polystyrene materials as solid phase carrier were treated with NaCl to carry sodium ions, and each column contained 200 mg of resin filler. The column was fixed vertically by the shelf during use, and rinsed with 1 ml of ultrapure water before loading samples. A gap was left below it for collecting the elution solutions. Then, 5 ml aliquots of sample solutions that has been adjusted to a pH of 5.5 was taken flow through the column, and the target copper ions could be adsorbed by the exchange resin. At the same time, other ions with poor adsorption capacity of the exchange resin would flow out directly from the column. After that, the impurities were removed by rinsing with 2 ml of ultrapure water, then the copper ions were eluted with 400 μl of NOTA-HCl solution (2 μg/μl, pH 5.0) from the column and coupled with monofunctional NOTA chelators to form hapten complexes correspondingly. After collecting the final eluate, copper content in the sample solutions was detected with FICA after adjusting to neutral (pH 7.0). Results from ICP-AES instrument test were used as a reference, and the SPSS program was used for correlation analysis to evaluate the reliability of FICA.
3. Results and discussion
3.1. Morphology of fluorescent microspheres
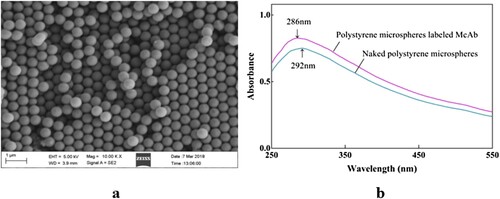
The fluorescent microspheres were observed by SEM. The average particle size was homogeneously distributed with diameters around 500 nm (as shown in (a)). The morphology was as expected and the size was uniform which indicated that the fluorescent microspheres were suitable for antibody protein labelling.
Figure 3. Particle size and appearance of fluorescent microspheres (a) and characteristic absorption peaks of fluorescent microspheres before and after labelling to McAb (b).
3.2. Changes in characteristic absorption peaks of fluorescent microspheres before and after labelling to McAb
A maximum absorption peak at 292 and 286 nm were observed in the naked polystyrene microspheres and the microsphere-McAb complexes, respectively. The characteristic absorption peak of the microspheres after labelling to McAb was shifted to the left compared to that of the naked microspheres (as shown in (b)) which indicated that the polystyrene microspheres were successfully labelled to McAb.
3.3. Standard curve of FICA
The fluorescence signals of test strips with sample solutions were examined with an immune-fluorescence quantitative detector and converted into digital signals. The intensity of the two signals was positively correlated. The left and right peaks were representative of the T-line and C-line, respectively ((a)).
Figure 4. The T-line and C-line signal of fluorescence immunochromatographic test strips (a) and the standard curve of FICA (b).
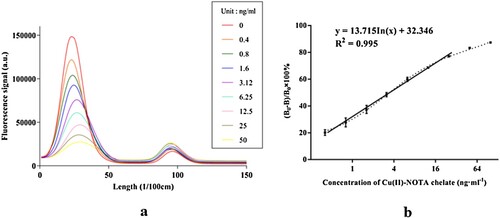
The detection inhibition rate (B0 − B)/B0 × 100% (B0 represents the T/C signal ratio of 0 ng/ml and B represents the other concentrations) and the concentration of Cu-NOTA chelate were plotted as the ordinate and abscissa, respectively. Then the standard curve of FICA was determined. As shown in (b), the standard curve regression equation was y = 13.715 In(x) + 32.346 (R2 = 0.995), the sensitivity of detection (IC50) was 3.6 ng/ml, the limit of detection (IC10) was 0.2 ng/ml, and the linear range was 0.4–50 ng/ml. The above detection parameters met the minimum copper detection requirement of 0.01 mg/L as specified in Hygiene Standards of Drinking Water (GB5749), Environmental Quality Standard for Surface Water (GB3838), Environmental Quality Standard for Soils (GB15618), Chinese Pharmacopoeia (2015), and ASTM D1688-2012 (US).
3.4. Accuracy and precision
The detected recovery rates of intra-assay and inter-assay accuracy tests were 93.5–108.7% and 92.5–112.5%, respectively. The precision of RSD values for intra-assay and inter-assay were less than 10% and 15%, respectively. The accuracy and precision results indicated that our method met the standard requirements of fluorescence quantitative immunochromatographic assay ((a)).
Figure 5. Accuracy and precision test of intra-assay and inter-assay (a), specificity test (b) and stability test (c) of FICA.
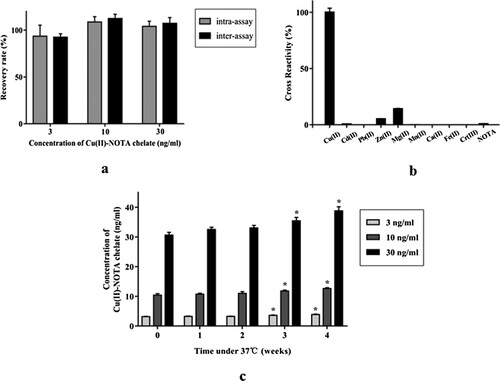
3.5. Specificity
As shown in (b), the anti-copper McAb exhibited slight cross-reactivity at rates of 14.2% and 5.3% for Mg2+ and Zn2+, respectively. Interference could be eliminated or minimized by using solid phase extraction separation column during pre-treatment of samples. In the use of sodium-type cation exchange resin, except for a small amount of ferrous iron ions, lead ions and most of the copper ions were adsorbed by the column, the other interference ions could be directly discharged after being loaded. Cross-reactivity with other metal ions was at less than 1%. We, therefore, concluded that the specificity of FICA met the test requirements.
3.6. Stability
The stability of FICA was evaluated by accelerated aging test at 37°C. Correlation between the detected values and the reference values of the test strips at each week were assessed by SPSS program. From the 3rd week of accelerated destruction onward (including the 4th week), significant differences between the detected and reference values of the standard solutions were observed (P value < 0.05) ((c)). Based on these results, we suggested that the test strips were stable within the valid period of 2 months when stored at room temperature (25°C) in dry environments (humidity ≤ 30%).
3.7. Add recovery rate
As shown in , the add recovery rates of tap water, CB buffer and dedicated diluted solution were 162.4% to 253.0%, 115.8% to 127.7% and 99.1% to 108.3%, respectively. By comparison, the matrix buffer system of the detected solution exhibited greater impact on the detection results, potentially due to ionic strength, pH, and other additives in the buffer system that played a key role in the binding and release of the protein immobilized on the test strips. In the detection of actual samples, the dedicated diluted solution was usually required to dilute the prepared sample in order to reduce the interference caused by the complex sample solution matrix to the detection system.
Table 1. The add recovery rates of copper ions detected by FICA.
3.8. Digestion recovery rate
The standard and detected content of copper ions in the two standard substances were shown in . The digestion recovery rates of GBW07602 and GBW07404 were 88.8% and 107.4%, respectively, indicating that the digestion process was qualified.
Table 2. The digestion recovery rates of the bush branches and soil standard substances.
3.9. Detected results of copper content in herbal plants and soil samples
The copper content of the pre-treated samples of herbal plants (13 parts) and soils (18 parts) was detected by FICA and ICP-AES, respectively. The results were shown in . (Specific test results were detailed in Appendix forms.)
Figure 6. The copper content detected by FICA and ICP-AES in herbal plants (a) and soil (b) samples. * The copper content of several soil samples beyond the maximum limit standard of 200 mg/kg which regulated in Environmental quality standard for soils (GB15618).
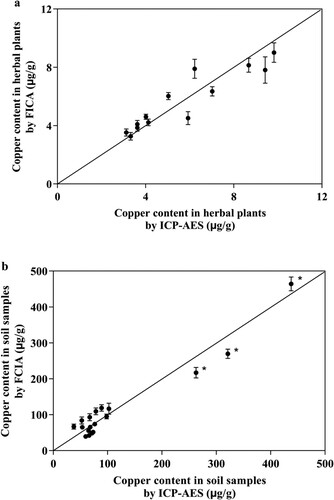
According to SPSS program, the correlation coefficients of copper content in herbal plants and soil samples as detected by FICA and ICP-AES were 0.924 and 0.969, respectively. The P value was greater than 0.05, indicating that there were no significant differences in the detection results from the two methods. We, therefore, concluded that FICA can be used for simple, fast and quantitative detection of copper content in various environmental samples like plants, soils, and water, etc.
4. Conclusion
This study described and validated the establishment of a convenient, fast and low-cost fluorescence immunochromatographic assay for the rapid and quantitative detection of copper ions within 15 min with a LOD (limit of detection) of 0.2 μg/L. Comparison of routine and immunological detection methods for copper ions was shown in .
Table 3. Comparison of different detection methods for copper ions (Kong et al., Citation2010; Quinn et al., Citation2018; Xing, Feng et al. Citation2013).
Sample pre-treatment remains a challenge for rapid detection of heavy metals due to their existing form of solid compounds in actual environmental samples. The heavy metals in solid samples need to be effectively released into the liquid phase environment before analysis, and various interference factors should be removed as far as possible. Immunological detection techniques are theoretically applicable to any analytes capable of producing antibodies. Therefore, heavy metal immunological detection technology can be further promoted by designing and preparing antigens and antibodies of different heavy metals.
Overall, the FICA method was specific, stable and sensitive. It allowed for the rapid detection of copper content in herbal plants, soil and water samples, and met the requirements of rapid onsite detection. A few key issues remained to be addressed in future studies, including exploring individual and convenient pre-treatment of different environmental samples, reduce the interference of matrix in complex samples, and optimize the stability of fluorescence immunochromatographic test strips.
Disclosure statement
No potential conflict of interest was reported by the authors.
Additional information
Funding
Related Research Data
References
- Elmizadeh, H., et al. (2017). Ligand-Capped CdTe quantum dots as a fluorescent nanosensor for detection of copper ions in environmental water sample. Journal of Fluorescence, 27(6), 1–11. doi: 10.1007/s10895-017-2174-3
- Huang, F. (2012). Determination of 16 rare earth elements in soil by MicrowaveDigestion-inductively coupled plasma mass spectrometry. Chinese Journal of Inorganic Analytical Chemistry, 2(1), 43–46.
- Ipeaiyeda, A. R., & Ayoade, A. R. (2017). Flame atomic absorption spectrometric determination of heavy metals in aqueous solution and surface water preceded by co-precipitation procedure with copper(II) 8-hydroxyquinoline. Applied Water Science, 7(8), 4449–4459. doi: 10.1007/s13201-017-0590-9
- Kong, T., et al. (2010). Synthesis and identification of artificial antigens for cadmium and copper. Food Chemistry, 123(4), 1204–1209. doi: 10.1016/j.foodchem.2010.05.087
- Lin, Y., et al. (2016). Detection of heavy metal by paper-based microfluidics. Biosensors & Bioelectronics, 83, 256–266. doi: 10.1016/j.bios.2016.04.061
- Liu, X., et al. (2012). Colloidal gold nanoparticle probe-based immunochromatographic assay for the rapid detection of chromium ions in water and serum samples. Analytica Chimica Acta, 745(10), 99.
- Meunier, N., et al. (2006). Comparison between electrocoagulation and chemical precipitation for metals removal from acidic soil leachate. Journal of Hazardous Materials, 137(1), 581–590. doi: 10.1016/j.jhazmat.2006.02.050
- Ouyang, H., et al. (2016). An ultra-facile and label-free immunoassay strategy for detection of copper (II) utilizing chemiluminescence self-enhancement of Cu (II)-ethylenediaminetetraacetate chelate. Biosensors & Bioelectronics, 85, 157–163. doi: 10.1016/j.bios.2016.05.007
- Pulgarín, J. A. M., et al. (2016). An easy and fast IC-CL procedure for the monitoring of Cu(II) and Co(II) in environmental samples. International Journal of Environmental Science & Technology, 14(2), 1–8.
- Qu, L., et al. (2018). Risk analysis of heavy metal concentration in surface waters across the rural-urban interface of the Wen-Rui Tang River, China. Environmental Pollution, 237(3), 639. doi: 10.1016/j.envpol.2018.02.020
- Quinn, C., et al. (2018). Solid-phase extraction coupled to a paper-based technique for trace copper detection in drinking water. Environmental Science & Technology, 52(6), 3567. doi: 10.1021/acs.est.7b05436
- Resende, C. D. M., et al. (2018). Evaluation of toxicity, mutagenicity and carcinogenicity of samples from domestic and industrial sewage. Chemosphere, 201, 342–350. doi: 10.1016/j.chemosphere.2018.03.016
- Sharma, S. (2018). Heavy metal contamination in soil, food crops and associated health risks for residents of Ropar Wetland, Punjab, India and its environs. Food Chemistry, 255, 15–22. doi: 10.1016/j.foodchem.2018.02.037
- Sierra, C. A. (2012). Temperature sensitivity of organic matter decomposition in the Arrhenius equation: Some theoretical considerations. Biogeochemistry, 108(1–3), 1–15. doi: 10.1007/s10533-011-9596-9
- Sohrabi, M., et al. (2017). Trace element and heavy metal levels in colorectal cancer: Comparison between cancerous and non-cancerous tissues. Biological Trace Element Research, 183(22), 1–8.
- Wang, W. X., et al. (2011). Copper and zinc contamination in oysters: Subcellular distribution and detoxification. Environmental Toxicology & Chemistry, 30(8), 1767–1774. doi: 10.1002/etc.571
- Wang, Z., et al. (2014). Development and application of a quantitative fluorescence-based immunochromatographic assay for fumonisin b1 in maize. Journal of Agricultural and Food Chemistry, 62(27), 6294–6298. doi: 10.1021/jf5017219
- Xing, C., et al. (2013). Visual sensor for the detection of trace Cu(II) ions using an immunochromatographic strip. Immunological Investigations, 42(3), 221–234. doi: 10.3109/08820139.2012.752378
- Xiong, X., et al. (2010). Copper content in animal manures and potential risk of soil copper pollution with animal manure use in agriculture. Resources Conservation & Recycling, 54(11), 985–990. doi: 10.1016/j.resconrec.2010.02.005
- Yao, C., et al. (2016). A plasmonic ELISA for the naked-eye detection of chromium ions in water samples. Analytical & Bioanalytical Chemistry, 409(4), 1–8.
- Zhang, J. F., et al. (2011). Recent progress in fluorescent and colorimetric chemosensors for detection of precious metal ions (silver, gold and platinum ions). Chemical Society Reviews, 42(42), 3416–3429. doi: 10.1039/c1cs15028f
- Zhou, J., et al. (2014). Development of a microsphere-based fluorescence immunochromatographic assay for monitoring lincomycin in milk, honey, beef, and swine urine. Journal of Agricultural and Food Chemistry, 62(49), 12061–12066. doi: 10.1021/jf5029416
Appendix
The detection results of copper content in herbal plants and soil samples were shown in Table A1 and Table A2, respectively. Due to the matrix differences of various types of samples, the original results of FICA and ICP-AES need to be calibrated to the final results.