
ABSTRACT
Melatonin (MT) is a hormone secreted by the pineal gland which regulates sleep rhythm and is widely used in health foods. However, MT is sometimes added illegally and excessively in certain health foods, which might cause undesirable side-effects. In this work, an easy-to-use immunochromatographic assay (ICA) based on mouse monoclonal antibody (mAb) for rapid detection of MT was developed for the purpose of safety. Under the optimal conditions, the developed ICA exhibited a visual limit of detection (VLOD) of 10,000 ng/mL and a LOD of 50 ng/mL (strip reader) with the linear range from 50 ng/mL to 5000 ng/mL. Good correlation was obtained between the results of ICA and standard liquid chromatography (LC) in matrix test and blind samples test. The developed ICA can be applied for rapid detection of samples within 30 min, and is potentially an excellent tool for screening of MT in health foods.
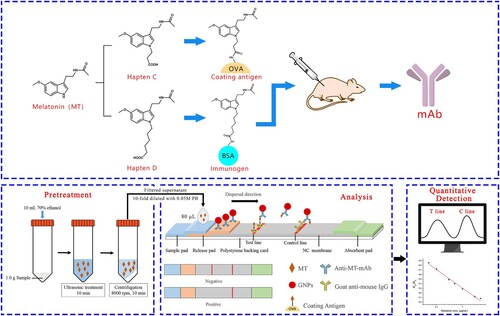
GRAPHICAL ABSTRACT
Introduction
Melatonin (MT, ), an endogenous hormone secreted from the pineal gland, is involved in controlling circadian rhythms, mitigating sleeping disorders and jet-lag (Reiter, Citation1993). At present, MT is approved by many countries as a sleeping-aid ingredient in some health foods or functional foods (Ball & Patel, Citation2012; COMMISSION REGULATION (EU), Citation2012; EFSA, Citation2010; EFSA, Citation2011). However, it has been reported that excessive amounts of MT are illegally added in some health food products for the purpose of therapeutic efficacy improvement (Lu, Gong & Tan, Citation2015). Moreover, moderate side effects of MT have been reported, such as nightmares, hypotension, sleep disorders, abdominal pain, etc. (Guardiola-Lemaitre, Citation1997). Therefore, in order to control the quality and safety of the related health foods in the market, rapid analytical methods for the determination of MT need to be developed.
Figure 1. ICA for MT quantitative detection.
Several instrumental methods have been successfully applied for the determination of MT, including high performance liquid chromatography (HPLC) (Muñoz, Ceinos, Soengas & Míguez, Citation2009; Talebianpoor et al., Citation2014), ultraviolet spectroscopy (UV) (Amin, Zaky, Khater & El-Beshbeshy, Citation1999; Surmeian & Aboul-Enein, Citation1998), fluorescence spectroscopy (Sun, Wu, Wang & Yu, Citation2013), and electrochemical assays (Cortujo-Antuna, Martinez-Montequin, Fernandez-Abedul & Costa-Garcia, Citation2003; Qu, Wang, Hu & Cui, Citation2005). High accuracy and precision are the main advantages of these methods. However, traditional instrumental methods are not suitable for rapid screening of a large number of samples because of high cost and long analysis times. Immunoassays based on antigen–antibody specific recognition are well-established methods which have been employed for rapid screening of antibiotics, pesticides and other harmful chemicals due to their high sensitivity, speed, low cost and applicability for large numbers of samples (Luo et al., Citation2015). In our previous work, a competitive indirect enzyme-linked immuno-sorbent assay (ci-ELISA) based on rabbit polyclonal antibody was developed for rapid quantification of MT in medicinal foods (Chen et al., Citation2017). In order to shorten the detection time, a colloidal gold immunochromatographic (ICA) method was further developed by our group. In comparison to ELISA, the ICA method without incubation steps is faster (within 5 min), lower in cost, and easier to use, which had been successfully application in food immunoassay (Li et al., Citation2019; Yang et al., Citation2019; Xie, Zhang & Le, Citation2017). The ICA strip test has been developed into a popular platform for application in food, feed and agricultural products safety due to its potential for rapid (one-step assay), portable, on-site, visual detection without the need for handling reagents (Man et al., Citation2017; Paek, Lee, Cho & Kim, Citation2000). In this work, a direct competition immunochromatographic assay based on monoclonal antibody labelled by colloidal gold nanoparticles (GNPs) was developed for rapid quantification of MT. Furthermore, the detection results from ICA strip can be evaluated by either strip reader or naked eyes. Therefore, the developed ICA has the potential to be used as a rapid screening tool for large scale determination of MT.
Materials and methods
Reagents
Melatonin (≥98%), ethyl bromoacetate, ethyl 3-bromopropionate, ethylene glycol dimethyl ether, sodium hydride (60%), D-tryptophan, L-tryptophan, dicyclohexylcarbodiimide (DCC), and N-hydroxysuccinimide (NHS) were obtained from Aladdin Chemistry Co., Ltd. (Shanghai, China). Ethyl 4-(bromomethyl) benzoate was supplied by Alfa Aesar Chemical Co., Ltd (Shanghai, China). N-acetyl-L-tryptophan, N-acetyl-D-tryptophan, tryptamine and 5-hydroxy-L-tryptophan were obtained from Yuan Ye Biotechnology Co., Ltd. (Shanghai, China). PEG 4000 and PEG 20000 were purchased from Sigma-Aldrich (Shanghai, China). HRP conjugated goat anti-mouse IgG(H + L) was obtained from TransGen Biotech Co., Ltd. (Beijing, China). Serotonin hydrochloride was purchased from Beijing Solarbio Science & Technology Co., Ltd. (Beijing, China). Ethyl 6-bromohexanoate and 5-methoxytryptamine were supplied by Heowns Biochem Technologies Co. Ltd. (Tianjin, China). Bovine serum albumin (BSA), ovalbumin (OVA), hydrogen tetrachloroaurate hydrate (HAuCl4), and goat anti-mouse IgG were obtained from Sigma-Aldrich (St. Louis, MO, USA). Nitrocellulose (NC) membrane (10 μm, CNPF-SN12, 25 mm) was purchased from Advanced Microdevices Pvt. Ltd. (Ambala Cantt., India). Glass-fibre, sample pad, absorbent pad and release pad were procured from Millipore (USA). N,N-dimethylformamide (DMF), Tween-20, and ethanol (EtOH) were obtained from Damao Chemical Reagent Co., Ltd. (Tianjin, China). All other reagents were of analytical reagent grade or higher purity.
Instruments
Sample centrifugation was performed on a Heraeus Fresco 21 Microcentrifuge (Thermo Scientific, Shanghai, China). The concentration of antibody was determined using NanoDrop 2000c spectrophotometer (Thermo Scientific, Shanghai, China). HGS 510 dispensing platform and HGS 201 guillotine cutter were supplied by Autokun (Hangzhou, China). Membrane strip reader (DY6510) was supplied by Wanlian Biotechnologies Co. Ltd. (Guangzhou, China). Transmission electron microscopy (TEM) images were obtained using JEM-2100F microscope (JEOL, Japan). Ultraviolet absorption spectra (UV) were recorded on a UV-3010 spectrophotometer (Hitachi, Tokyo, Japan). LC analyses were performed using Shimadzu LC-20AT system (Kyoto, Japan) equipped with a Shimadzu UV Detector (Model SPD-20A).
Buffers and solutions
The following buffers and solutions were used in this study: (1) 0.01% HAuCl4 solution for GNPs synthesis; (2) Phosphate buffer (PB, pH 7.4, 0.05 M) was used for ICA development; and (3) Borate buffer (BB, 0.01 M with 1% BSA) was used for redissolving the conjugated mAb-GNPs.
Production of anti-MT monoclonal antibody (mAb)
Mice immunization and antiserum characterization were studied in our previous work (Chen, Fu, Luo, Sun, Yang, Zeng, Shen & Xu, Citation2017). The mouse that exhibited the best inhibition (%) for the immunogen was chosen as the donor of spleen cells for hybridoma production. Through cell fusion technology, the above spleen cells were fused with SP2/0 murine myeloma cells to form hybridomas by PEG 4000 at 37°C. The hybridoma cells were cultured in five 96-well plates for preliminary screening by ic-ELISA method on the 10th day. Briefly, the coating antigens (1 μg/mL, 100 μL/well) in carbonate buffer were added to 96-well polystyrene ELISA plates and incubated at 37°C overnight. Then, the wells were washed twice with PBST solution prior to adding 5% skimmed milk in PBST (100 μL/well) to block the uncoated sites for 3 h at 37°C and dried at 37°C for 1 h. Melatonin standards in PBS (50 μL, 1 μg/mL) and the diluted culture fluid from 96-well plates (50 μL, 1 μg/mL) were added to each well and incubated at 37°C for 40 min, and then the wells were washed five times with PBST. The secondary antibody (HRP conjugated goat anti-mouse IgG) was diluted 1:5000 in PBST (100 μL/well), and was then added to the wells and incubated for 40 min at 37°C. The wells were washed again five times with PBST before TMB solution was added to the wells (100 μL/well) and incubated for 10 min. Finally, 50 μL of 10% H2SO4 was added to quench the reaction and the optical density was measured at 450 nm. The percent inhibition of antibody binding was used to characterize the binding ability of antibodies. It was calculated as follows: inhibition = [(B0 – B)/B0] × 100%; where B0 is the mean absorbance of the wells in the absence of a competitor; and B is the mean absorbance of wells in the presence of a competitor. The highest inhibition rate and titre antibody-producing clone (3C3) was sub-cloned five times by limiting dilution with lower concentration of MT in each sub-cloning (from 1 to 0.01 μg/mL). Then, hybridomas secreting MT specific antibodies were expanded and selected to produce ascitic antibodies. The obtained ascitic mAb was purified by ammonium sulphate precipitation method and stored at −20 °C. The purified mAb concentration was detected by NanoDrop 2000c.
Preparation of GNPs
The GNPs were produced by the sodium citrate reduction method (Wang et al., Citation2007). Briefly, 100 mL of 0.01% HAuCl4 solution in ultra-purified water was boiled thoroughly for 1 min. Then, 1.5 mL of 1% sodium citrate solution was rapidly added under continuous agitation. The colour of the mixed solution gradually changed from light yellow to black, and finally to brilliant red. After the colour change, the solution was boiled for another 3 min, cooled and stored at 4 °C with 0.05% sodium azide as preservative. Transmission electron microscopy (TEM) was employed to characterize the GNPs.
Preparation of anti-MT-mAb-GNPs conjugate
The mAb was 10-fold diluted with 0.05 M PB and added to 0.5 mL GNPs solution with an optimized concentration of K2CO3. The mixture was vortexed for 5 min before adding 20 μL of 10% BSA, and then vortexed for another 20 min. After vortex shaking, the mixture was centrifuged at 4°C and the supernatant was removed. The precipitate (prepared mAb-GNPs under optimized conditions) was re-dissolved in 100 μL of 0.01 M BB (with 1% BSA) for ICA preparation. The absorbance of re-dissolved solution was measured at 522 nm for solubility evaluation.
Development of ICA
The ICA strip was prepared according to the method of Liang et al. (Liang et al., Citation2017). The developed ICA strip was composed of five sections: the sample pad, release pad, polystyrene backing card, NC membrane and the absorbent pad (). The test line (T Line) and control line (C Line) were drawn with the coating antigen and the goat anti-mouse IgG, respectively. The mAb-GNPs conjugate solution was dispensed by Biostrip dispenser HGS 510 onto glass fibre pad to form the release pad, which was then dried at 37°C for 4 h. The sample pad was soaked in 0.05 M PB (containing 0.1% PEG 20000, 0.1% Tween-20, 1% mycose, 6% sucrose) and dried at 37°C for 4 h. Finally, the strip was placed in a sealed plastic bag before use.
Preparation of samples
Health food samples (tablet, capsule and soft capsule) containing MT were purchased from a local supermarket in Guangzhou, China. For capsule and soft capsule samples, the contents were removed and collected. The tablet samples were ground into powder form. The pretreated samples (1.0 g) were extracted by 10 mL 70% ethanol with ultrasonication for 10 min and centrifuged at 8000 rpm for 10 min (). The supernatant was diluted 1:10 with 0.05 M PB for ICA and diluted 1:5 with mobile phase (methanol: water: trifluoroacetic acid = 50: 50: 0.05, v: v: v) for LC analysis. All prepared samples were filtered through a 0.22 μm membrane before ICA and LC analysis.
Assay validation
Each prepared sample was divided into two parts and subjected to MT analysis by both ICA and LC methods.
ICA. The calibration curve was constructed as follows: The MT stock solution was diluted serially and the resulting MT standard solutions (80 μL) were used as competitor in the ICA. The colour intensities of T line (AT) and C line (AC) were measured by DY6510 strip reader after 5 min. The calibration curve was constructed by plotting the AC/AT ratio against logarithm of MT concentration. For sample analysis, 80 μL of the prepared samples was added as competitor in the ICA as described above.
LC method. LC was performed by reference to Chinese National Standards Method (Yang, Wang, Fang, Wu & Li, Citation2003). The LC system consisted of a Shimadzu LC-20AT system equipped with a Shimadzu UV Detector Model SPD-20A (Shimadzu Corp., Kyoto, Japan). Chromatographic separation was achieved using an Intersil C18 chromatographic column (150 mm × 4.6 I.D., 5 μm particle size; Webber Consulting, Ltd, Göd, Hungary). The flow rate was 0.8 mL/min at 25°C and the injection volume was 10 μL. MT absorbance peak was measured at 222 nm and the chromatogram was recorded for 6 min 32 s (see the supplemental file, Figure S1). According to the chromatogram data, the calibration curve for MT was constructed with the linear range from 0.025 to 400 μg/mL (Figure S2). The LOD of the LC method was 0.025 μg/mL (Figure S3).
Results and discussion
Characterization of GNPs
The GNPs were prepared by the sodium citrate reduction method from reductive gold atoms. As shown in Figure S4, the average diameter of the prepared GNPs was about 20 nm, which suggests that the GNPs were stable in solution, thus indicating their successful preparation (Hou et al., Citation2015; Wang et al., Citation2014). The small diameter of GNPs could be explained by the fact that the sodium citrate capped the colloidal gold nano particles and prevented them from forming larger particles (Wang et al., Citation2015). Moreover, the small diameter GNPs were suitable for mAb labelling and provided uniform, clear and equable colour on T and C lines of NC membrane for quantitative determination. The following experimental results indicated that the prepared GNPs were effective and suitable for the developed ICA.
Optimization of ICA
To improve the sensitivity of ICA for MT in quantitative determination, the method was optimized in terms of several parameters, including K2CO3 and mAb concentrations, centrifugal speed and time, and mAb-GNPs dilution/coating concentration.
The concentration of K2CO3 in the conjugated buffer was optimized. At the K2CO3 concentration of less than 1 mol/L, the colour of mAb-GNPs turned to grey or purple after 20 min of conjugation. Also, the mAb-GNPs precipitate was partially re-dissolved after centrifugation, which indicated that the mAb-GNPs were denatured. Furthermore, the absorbance of re-dissolved mAb-GNPs solution increased as the K2CO3 concentration increased up to 3 mol/L ((A)). Since the absorbance of mAb-GNPs was constant over the K2CO3 concentration range of 3∼5 mol/L, 3 mol/L was selected as the optimum and cost-effective concentration.
Figure 2. Absorbance of redissolved solution in optimal condition: (A) concentration of K2CO3. (B) Concentration of mAb. (C) Centrifugal speed. (D) Centrifugal time.
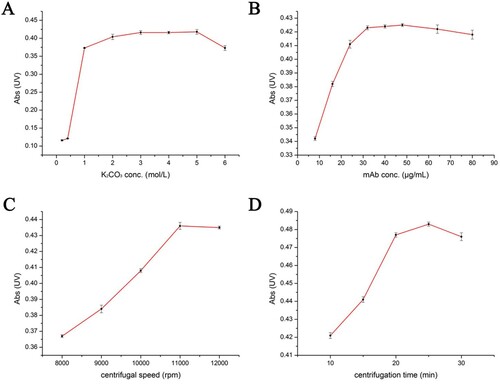
Based on the optimization result of K2CO3 concentration, the conjugated mAb concentration was further optimized. As shown in (B), as the conjugated mAb concentration increased, the absorbance of re-dissolved mAb-GNPs solution increased due to improved solubility. The minimum mAb concentration (32 μg/mL) required to achieve stable mAb-GNPs solution was selected as the optimum concentration.
In order to separate mAb-GNPs from the conjugated buffer, centrifugation was employed as an easy and effective treatment. In general, separation efficiency can be improved by using higher centrifugation speed and longer centrifugation time. Thus, the centrifugation speed and time were also optimized ((C,D)). After centrifugation treatment, the mAb-GNPs precipitate was re-dissolved. The absorbance of re-dissolved solution increased with the increase in centrifugation speed and time. The absorbance reached the maximum value at 11,000 rpm and 20 min, respectively, indicating that the highest yield was obtained. Therefore, the centrifugal speed of 11,000 rpm and centrifugation time of 20 min were selected as the optimum conditions for separation.
The concentration of coating antigen can affect the sensitivity of ICA in the competitive format. The heterologous coating antigen in this developed ICA method was selected based on the ci-ELISA results of our previous work (Chen, Fu, Luo, Sun, Yang, Zeng, Shen & Xu, Citation2017) (). The coating antigen/mAb-GNPs dilution was screened for highest sensitivity on T line. As shown in , whether tested with negative (0.05 M PB) or positive (10 μg/mL MT) solution, the intensity of T line decreased with the increase in coating antigen or mAb-GNPs dilution. The most obvious visual intensity difference between the negative and positive solution was obtained with 0.67 μg/mL as the concentration of coating antigen with undiluted mAb-GNPs.
Table 1. Optimization of coating antigen/mAb-GNPs dilution.
Sensitivity and specificity of ICA
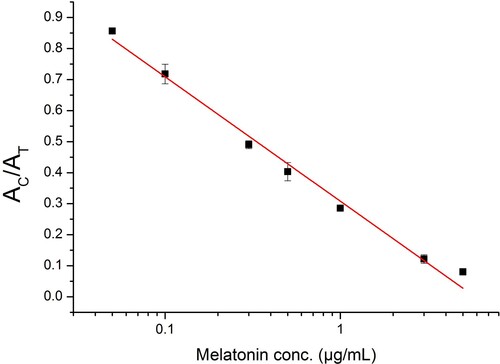
Under the optimal conditions, ICA was performed with addition of serial concentrations of MT standard solution (80 μL/card). The AT decreased as the concentration of MT increased and completely disappeared at 10 μg/mL, which was confirmed to be the VLOD of ICA (). Further, the calibration curve of ICA for quantitation of MT was constructed by plotting AT/AC ratio against logarithm of MT concentration. As shown in , the calibration curve showed a linear range from 0.05 to 5 μg/mL and the LOD was defined as the limit of quantitation (LOQ, 0.05 μg/mL).
Figure 3. Sensitivity of ICA The test results of a serial concentrations of MT standard solution.
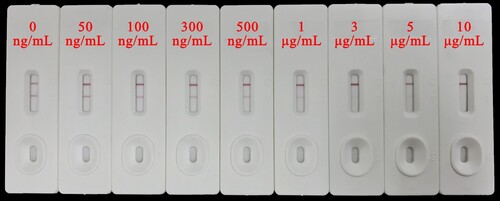
Figure 4. Calibration curve of ICA for MT.
The specificity of the developed ICA is shown in . No cross-reactivity (CR) was observed with any of the related compounds tested, except for 5-methoxytryptamine (5-MT) at 500 μg/mL level. The methoxy group is considered to be the key moiety for immunological recognition, which explains why higher affinity was observed for 5-MT than any of the other related compounds. Hypothetically, false positive would be caused if samples contain high concentrations of 5-MT. However, as the precursor of MT, 5-MT is not present in MT products. Therefore, the high CR for 5-MT at high concentration can be ignored, and the developed ICA can be considered suitable for MT detection in health foods.
Table 2. Cross reactivity with MT related compounds by the ICA strip.
Recovery test with spiked samples
Three levels of MT (5, 20 and 40 mg/g) were spiked for validation of ICA. The three spiked samples were analysed by ICA and LC and the results are summarized in . Average recoveries of 71.11% to 116.2% were observed using the ICA method with a coefficient of variance (CV) ranging from 5.22% to 16.4%. The average recoveries obtained by LC method ranged from 97.2% to 114.88% with CVs between 3.24% and 7.36%. The results showed that the accuracy of the ICA was comparable to that of the LC method.
Table 3. Recoveries of MT by homologous ICA and LC (n = 3)a.
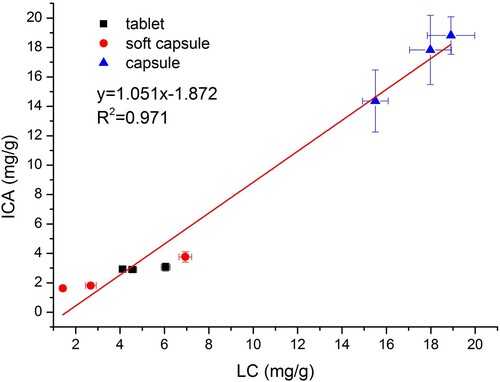
The developed ICA was then applied to detect MT in blind samples to assess its effectiveness. Samples (tablet, soft capsule and capsule) were collected from local supermarkets and analysed by the ICA and LC method. As shown in , good correlation was observed between the results of ICA and LC method in three types of samples, which demonstrated the reliability, reproducibility and accuracy of the developed ICA.
Figure 5. Correlation of LC results with ICA results.
Conclusion
An ICA based on mouse monoclonal antibody was developed for the rapid detection of MT in health foods. In comparison to ELISA, this developed one-step detection method was found to be faster (within 30 min, including pretreatment), cheaper ($0.5∼1 per sample) and easier to use (without incubation and separation). This ICA demonstrated good sensitivity for MT with VLOD of 10 μg/mL and LOD of 0.05 μg/mL, and a large detection range from 0.05 to 5 μg/mL. In instrument verification, the average recoveries were 71.11% to 116.2%, with the CV (%) ranging from 5.22% to 16.4%. A good correlation (R2 = 0.971) between the results of ICA and LC method was also demonstrated. In summary, this ICA can be potentially employed as an on-site, rapid and effective tool for screening of MT in a large number of health food samples.
Supplemental Material
Download ()Disclosure statement
No potential conflict of interest was reported by the authors.
Additional information
Funding
References
- Amin, A. S., Zaky, M., Khater, H. M., & El-Beshbeshy, A. M. (1999). New colorimetric methods for microdetermination of melatonin in pure and in dosage forms. Analytical Letters, 32(7), 1421–1434. doi: 10.1080/00032719908542907
- Ball, A. T., & Patel, B. A. (2012). Rapid voltammetric monitoring of melatonin in the presence of tablet excipients. Electrochimica Acta, 83, 196–201. doi: 10.1016/j.electacta.2012.07.100
- Chen, Z. J., Fu, H. J., Luo, L., Sun, Y. M., Yang, J. Y., Zeng, D. P., … Xu, Z. L. (2017). Development of competitive indirect ELISAs with a flexible working range for the simple quantification of melatonin in medicinal foods. Analytical Methods, 9(10), 1617–1626. doi: 10.1039/C6AY03380F
- COMMISSION REGULATION (EU) No 432/2012. (2012). Establishing a list of permitted health claims made on foods, other than those referring to the reduction of disease risk and to children’s development and health. Official Journal of the European Union, L136:1–40. Retrieved from http://eur-lex.europa.eu/legal-content/EN/TXT/?uri=CELEX:32012R0432.
- Cortujo-Antuna, J., Martinez-Montequin, S., Fernandez-Abedul, M., & Costa-Garcia, A. (2003). Sensitive adsorptive stripping voltammetric methodologies for the determination of melatonin in biological fluids. Electroanalysis, 15(9), 773–778. doi: 10.1002/elan.200390095
- EFSA. (2010). Scientific Opinion on the substantiation of health claims related to melatonin and alleviation of subjective feelings of jet lag (ID 1953), and reduction of sleep onset latency, and improvement of sleep quality (ID 1953) pursuant to Article 13(1) of Regulation (EC) No 1924/2006. EFSA Journal, 8(2), 1467. doi:10.2903/j.efsa.2010.1467
- EFSA. (2011). Scientific Opinion on the substantiation of a health claim related to melatonin and reduction of sleep onset latency (ID 1698, 1780, 4080) pursuant to Article 13(1) of Regulation (EC) No 1924/2006. EFSA Journal, 9(6), 2241. https://efsa.onlinelibrary.wiley.com/doi/10.2903/j.efsa.2011.2241.
- Guardiola-Lemaitre, B. (1997). Toxicology of melatonin. Journal of Biological Rhythms, 12(6), 697–706. doi: 10.1177/074873049701200627
- Hou, W. W., Wang, S. H., Wang, X. L., Han, X. A., Fan, H. J., Cao, S. L., … Yu, S. (2015). Development of colloidal gold immunochromatographic strips for detection of Riemerella anatipestifer. Plos One, 10(e01229523), doi: 10.1371/journal.pone.0122952
- Li, X. M., Chen, X. M., Wu, X. Z., Wang, J., Liu, Z. W., Sun, Y. M., … Lei, H. T. (2019). Rapid detection of adulteration of dehydroepiandrosterone in slimming products by competitive indirect enzyme-linked immunosorbent assay and lateral flow immunochromatography. Food and Agricultural Immunology, 30(1), 123–139. doi: 10.1080/09540105.2018.1550057
- Liang, Z. P., Ha, W. Z., Xiao, Z. L., Lei, H. T., Shen, Y. D., Sun, Y. M., … Xu, Z. L. (2017). Development of a simple, fast, and quantitative lateral flow immunochromatographic strip for folic acid. Food Analytical Methods, 10(7), 2444–2453. doi: 10.1007/s12161-017-0804-7
- Lu, L., Gong, X., & Tan, L. (2015). Fast screening of 24 sedative hypnotics illegally added in improving sleep health foods by high performance liquid chromatography-ion trap mass spectrometry. Chinese Journal of Chromatography, 33(3), 256–266. doi: 10.3724/SP.J.1123.2014.11001
- Luo, L., Yang, J. Y., Xiao, Z. L., Zeng, D. P., Li, Y. J., Shen, Y. D., … Xu, Z. L. (2015). A sensitivity-enhanced heterologous immunochromatographic assay based on a monoclonal antibody for the rapid detection of histamine in saury samples. RSC Advances, 5(96), 78833–78840. doi: 10.1039/C5RA15925C
- Man, Y., Liang, G., Jia, F. C., Li, A., Fu, H. L., Wang, M., … Pan, L. G. (2017). Development of an immunochromatographic strip test for the rapid detection of alternariol monomethyl ether in Fruit. Toxins, 9(5), 152. doi: 10.3390/toxins9050152
- Muñoz, J. L. P., Ceinos, R. M., Soengas, J. L., & Míguez, J. M. (2009). A simple and sensitive method for determination of melatonin in plasma, bile and intestinal tissues by high performance liquid chromatography with fluorescence detection. Journal of Chromatography B, 877(22), 2173–2177. doi: 10.1016/j.jchromb.2009.06.001
- Paek, S. H., Lee, S. H., Cho, J. H., & Kim, Y. S. (2000). Development of rapid One-step immunochromatographic assay. Methods (Orlando), 22(1), 53–60. doi: 10.1006/meth.2000.1036
- Qu, W. Q., Wang, F., Hu, S. H., & Cui, D. F. (2005). Electrocatalytic properties and voltammetric determination of melatonin at a nanostructured film electrode. Microchimica Acta, 150(2), 109–114. doi: 10.1007/s00604-005-0328-5
- Reiter, R. J. (1993). The melatonin rhythm: Both a clock and a calendar. Experientia, 49(8), 654–664. doi: 10.1007/BF01923947
- Sun, Y. M., Wu, H. L., Wang, J. Y., & Yu, R. Q. (2013). Determination of melatonin in functional food by three-dimensional fluorescence spectroscopy combined with second-order calibration method. Chemical Journal of Chinese Universities-Chinese, 34(5), 1084–1091. doi: 10.7503/cjcu20130009
- Surmeian, M., & Aboul-Enein, H. (1998). Simultaneous analysis of pyridoxine and melatonin in tablet formulation by derivative ultraviolet spectroscopy. Analytical Letters, 31(10), 1731–1741. doi: 10.1080/00032719808005255
- Talebianpoor, M., Khodadoust, S., Rozbehi, A., Toori, M., Zoladl, M., Ghaedi, M., … Hosseinzadeh, A. (2014). Application of optimized dispersive liquid-liquid microextraction for determination of melatonin by HPLC-UV in plasma samples. Journal of Chromatography B-Analytical Technologies in the Biomedical and Life Sciences, 960, 1–7. doi: 10.1016/j.jchromb.2014.04.013
- Wang, X. L., Li, K., Shi, D. S., Xiong, N., Jin, X., Yi, J. D., … Bi, D. R. (2007). Development of an immunochromatographic lateral-flow test strip for rapid detection of sulfonamides in eggs and chicken muscles. Journal of Agricultural and Food Chemistry, 55(6), 2072–2078. doi: 10.1021/jf062523h
- Wang, Y., Wang, L. F., Zhang, J. W., Wang, G. X., Chen, W. B., Chen, L., … Zhang, X. L. (2014). Preparation of colloidal gold immunochromatographic strip for detection of paragonimiasis skrjabini. Plos one, 9(e920343), doi: 10.1371/journal.pone.0092034
- Wang, R. X., Zuo, S. S., Wu, D., Zhang, J., Zhu, W. D., Becker, K. H., … Fang, J. (2015). Microplasma-assisted synthesis of colloidal gold nanoparticles and their use in the detection of Cardiac Troponin I (cTn-I). Plasma Processes and Polymers, 12(4), 380–391. doi: 10.1002/ppap.201400127
- Xie, Y., Zhang, L., & Le, T. (2017). An immunochromatography test strip for rapid, quantitative and sensitive detection of furazolidone metabolite, 3-amino-2-oxazolidinone, in animal tissues. Food and Agricultural Immunology, 28(3), 403–413. doi: 10.1080/09540105.2017.1293013
- Yang, J. J., Cheng, L. Q., Kang, K. R., Hao, D. L., Zhu, L. R., Liu, Y., … Huang, J. F. (2019). Rapid immunological detection of copper ions using fluorescence immunochromatographic assay. Food and Agricultural Immunology, 30(1), 60–73. doi: 10.1080/09540105.2018.1542421
- Yang, J. D., Wang, Z. T., Fang, C. R., Wu, G. H., & Li, P. (2003). Chinese national standard methods: Determination of melatonin in health foods. (GB/T 5009.170-2003).