
 ?Mathematical formulae have been encoded as MathML and are displayed in this HTML version using MathJax in order to improve their display. Uncheck the box to turn MathJax off. This feature requires Javascript. Click on a formula to zoom.
ABSTRACT
Adamantanes (ADAs) are tricyclic decane saturated derivatives, which are used in the protection against the influenza virus. However, their abuse in animal husbandry has affected human health. To help prevent drug resistance and protect food safety, a rapid, portable, sensitive, and reliable method for onsite detection of ADAs was developed. Herein, we have produced a broad-specificity anti-ADAs monoclonal antibody (mAb), the subclass of which is IgG2b, and its affinity constant is 7.25 × 10⁹ L/mol. From this, an antibody-based lateral flow immunoassay (LFIA) was developed for the rapid detection of five ADAs in food samples. When viewed with the naked eye, the LFIA had a visual detection limit of 0.1, 0.1, 1, 5, and 10 μg/kg and a cut-off value of 2.5, 2.5, 10, 100, and 100 μg/kg for somantadine, rimantadine, amantadine, 1-adamantanemethanol, 1-adamantyl methyl ketone respectively in chicken samples. The test results for the LFIA were very similar to that seen when using an enzyme linked immunosorbent assay (ELISA). Therefore, this paper-based LFIA provides a useful tool for rapid, onsite detection of ADAs in biological samples.
Introduction
Rapid, point-of-care (POC), and cost-effective detection methods are highly sought after by environment monitoring agencies, the health sector, and the food industry (Cate, Noblitt, Volckens, & Henry, Citation2015; Li, Tian, Al-Tamimi, & Shen, Citation2012; Mani, Kadimisetty, Malla, Joshi, & Rusling, Citation2013; Srisa-Art, Boehle, Geiss, & Henry, Citation2018; Wu et al., Citation2012). Among various of POC assays, paper-based testing devices have aroused great interest. Paper as a cheap, abundant, disposable, and easy to store material has become a desirable substrate for mass production of POC devices (Gong & Sinton, Citation2017; Nery & Kubota, Citation2013). In addition, the property of moving fluids by capillary action without the need for external pumping sources makes the advantages of paper in POC tests very attractive (Ge et al., Citation2012). As a result, sheet paper is the preferred platform for transforming conventional immunoassays for the diagnosis of disease, monitoring the environment, and detecting food toxins.
Amantadine (AMA) is an amino derivative of saturated tricyclic decane with confirmed antiviral effects (Eike et al., Citation2010). AMA has good efficacy for the prevention and early treatment of Asian influenza A virus and was the first Food and Drug Administration approved anti-influenza drug. Amantadine and its analogues including rimantadine (RMA), somantadine (SMA) have also been used to treat viral infection, Parkinson's disease, and Alzheimer's disease (Sharma, Lyons, & Pahwa, Citation2018; Singer, Papapetropoulos, Gonzalez, Roberts, & Lieberman, Citation2005). The favourable performance of AMA and its analogues for treating animal influenza made these drugs more popular in animal husbandry. As the use and dosage of these drugs increased, side effects appeared to gradually increase, especially drug resistance and residues in edible animal tissues. Therefore, it is essential to detect ADA residues in animal products to maintain human health and safety. The current analysis of ADAs mainly relies on instrumental assays (Farajzadeh, Nouri, & Alizadeh Nabil, Citation2013; Higashi, Uemori, & Fujii, Citation2005; Zhao et al., Citation2014). However, due to the use of expensive equipment, complex sample pre-treatment, length of time to assay, and the need for professional operators, these methods are unsuitable for rapid high throughput screening.
Here, a lateral flow immunoassay (LFIA) that used a paper sheet as the substrate for immobilized detection reagents for five different ADAs in biological samples was developed. Along with this LFIA, we have established a gold nanoparticle-based colorimetric signal readout system, in which the signals can be determined by eye or a portable scan reader. The test results of the LFIA when using real samples demonstrated that the LFIA is a simple, feasible, and efficient tool for onsite screening of these analytes.
Materials and methods
Chemicals and apparatus
Amantadine, RMA, SMA, 1-Adamantyl methyl ketone (AMK), 1-Adamantanemethanol (AMM), succinic anhydride, and ethyl 6-bromohexanoate were purchased from J&K Scientific Ltd. (Beijing, China). Bovine Serum Albumin (BSA), ovalbumin (OVA), 1-ethyl-3-(3-dimethylaminopropyl) carbodiimide (EDC), N-hydroxysuccinimide (NHS), Freund's complete adjuvant, Freund's incomplete adjuvant, and gold chloride trihydrate were obtained from Sigma-Aldrich (St Louis, MO, USA). RPMI-1640 cell culture media, hypoxanthine-aminopterin-thymidine supplement, hypoxanthine-thymidine supplement, polyethylene glycol 1500, and fetal calf serum were purchased from Gibco BRL (Paisley, UK). All the reagents and solvents were of analytical grade or higher.
The sample pad (glass fibre membrane, CB-SB08), poly-vinyl chloride (PVC) sheets, and the absorption pad (SX18) were obtained from Goldbio Tech Co., Ltd (Shanghai, China). The nitrocellulose (NC) membrane (Pura-bind RP) was from Whatman-Xinhua Filter Paper Co., Ltd (Hangzhou, China).
The spectrograms for the haptens were recorded by an ultra-high-performance liquid chromatography series quadrupole time of flight mass spectrometer (Waters Technologies, American). The membrane dispenser was obtained from Xinqidian Gene-Technology Co., Ltd (Beijing, China), and a CM4000 Guillotine Cutting Module was purchased from Shanghai Kinbio Tech Co., Ltd (Shanghai, China). Other instruments used in this study were the multiskan MKS microplate reader (Thermo Lab systems Company, Beijing, China) and UV/Vis scanner (Bokin instruments, Tsushima, Japan).
Preparation of the haptens and antigens
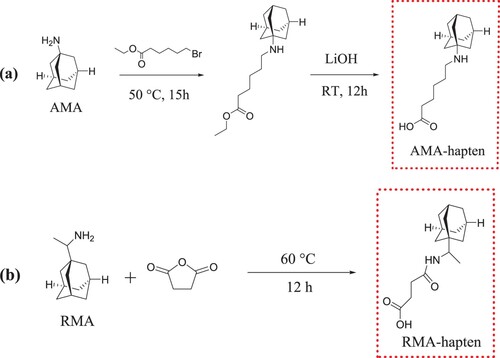
Two different haptens, AMA-hapten and RMA-hapten, were synthesized in this study. The synthetic pathways employed were as follows:
AMA-hapten (6-(((3s, 5s, 7s)-adamantan-1-yl) amino) hexanoic acid): A mixture of AMA (2.00 g, 13.2 mmol), ethyl 6-bromohexanoate (2.93 g, 13.2 mmol) and NaOH (0.60 g, 15.0 mmol) were dissolved in 20 mL of DMF and the solution was stirred at 50°C for 15 h. After cooling to room temperature (RT), 200 mL of ultrapure water was added into the reaction mixture, and then the solution was extracted three times with dichloromethane. The organic layer was dried over anhydrous Na2SO4, and then concentrated under reduced pressure to produce a crude product, which was purified by column chromatography to generate the intermediate product ethyl 6-(((3s,5s,7s)-adamantan-1-yl) amino) hexanoate. This intermediate product was dissolved in 20 mL of methanol aqueous solution (v/v, MeOH: H2O = 5:1), and 0.58 g of LiOH was added to the solution. Then, the mixture was stirred at RT for 12 h, and the product was concentrated under reduce pressure in 20 mL of ultrapure water. The pH of this solution was adjusted to pH 7.0 with 1 M hydrochloric acid solution. The precipitate was then collected and dried to give a final product the AMA-hapten.
RMA-hapten (4-((1-((3r, 5r, 7r)-adamantan-1-yl)ethyl)amino)-4-oxobutanoic acid) was synthesized by the succinic anhydride method, which was the same as we reported in our previous work (Wang, Xie, et al., Citation2017; Wang, Zheng, et al., Citation2017). A mixture of RMA (1 g, 5.5 mmol) and succinic anhydride (0.66 g, 6.6 mmol) in 15 mL anhydrous pyridine was prepared and refluxed at 60°C for 12 h. Then, the mixture was dried using rotary evaporation, and the residue was dissolved in 15 mL of methanol aqueous solution (v/v, MeOH: H2O = 1:2). The solution was extracted three times with ethyl acetate. The organic layer was collected, and a precipitate was generated after adding 1 M hydrochloric acid solution. The precipitate was washed with ultrapure water and dried in a drying oven, and the RMA-hapten was obtained as a white solid.
Due to the presence of carboxyl groups in haptens, we chose the active ester method (Chen et al., Citation2017a; Liu et al., Citation2018; Zhao et al., Citation2017) to couple the small molecules to the carrier proteins. Briefly, a mixture of AMA-hapten (10.5 mg, 0.04 mmol) and NHS (13.7 mg, 0.12 mmol) was dissolved in 2 mL of DMF. The solution was stirred for 15 min and then 22.8 mg of EDC (0.12 mmol) was added into the solution. The mixture continued to react for another six hours at RT and was added dropwise to a carrier protein solution (30 mg of BSA dissolved in 10 mL of carbonate-bicarbonate buffer, pH 9.6). After stirring overnight, the reaction was dialyzed against 0.01M PBS (pH 7.4) for more than 2 days and the final antigen was stored at −20°C.
The other immunogen RMA-hapten-BSA and the coating antigens AMA-hapten-OVA and RMA-hapten-OVA were prepared in the same way.
Preparation of the mAb
Ten female BALB/c mice (6 weeks of age) were used and divided into two groups. One group underwent subcutaneous injection with the immunogen AMA-hapten-BSA, and the other group was treated with RMA-hapten-BSA. This process was similar to that used in our previous studies (Wang et al., Citation2016; Xu et al., Citation2014). After the third immunization, blood was extracted from the tail vein of each mouse, and the titre and specificity were determined by indirect competitive enzyme-linked immunosorbent assay (ic-ELISA) (Suryoprabowo, Liu, Peng, Kuang, & Xu, Citation2015). The mouse whose serum showed the highest titre and the best specificity was injected intraperitoneally with 25 μg of immunogen mixed with 100 μL of 0.9% saline solution to boost the immunization.
After three days, cell fusion between splenocytes from the immunized mouse and SP2/0 myeloma cells was carried out under sterile conditions (Xie et al., Citation2018; Zhao et al., Citation2017). The culture supernatants were collected and monitored by ELISA and ic-ELISA after 7 days. The selected hybridomas were subcloned according to the limiting dilution method. The target hybridomas were collected and expanded in culture. Then, the cell lines were injected intraperitoneally into three paraffin-primed BALB/c mice for producing ascites fluid. The mAb was purified from ascites fluid using the caprylic acid-ammonium sulfate precipitation method (Chunsheng et al., Citation2018; Xie et al., Citation2018; Xie, Chen, & Yang, Citation2012) and the mAb was stored at −20°C until needed for further experiments.
The subclass of the mAb was determined using a mouse mAb isotyping (IgA, IgM, IgG1, IgG2a, IgG2b, IgG3) kit (Cellway-lab, Luoyang, China). The affinity of the mAb against AMA and its analogues was determined according to previous studies (Beatty, Beatty, & Vlahos, Citation1987; Wang, Zheng, et al., Citation2017). In order to evaluate the performance of this mAb in the ic-ELISA, standard inhibition curves were established by plotting the optical density values at 450 nm obtained from each standard solution against the corresponding concentration of analyte. The half-maximal inhibitory concentration (IC50) and the limit of detection (LOD) calculated from the standard inhibition curves were used to evaluate the sensitivity of the anti-ADAs mAb. Several ADAs, including SMA, RMA, AMM, and AMK, were selected for the cross-reactivity (CR) testing. The CR of the mAb was calculated using the following equation:
Preparation of detection reagents
In this study, the colloidal gold (CG)-labeled anti-ADAs mAb was chosen as the detection reagent for the LFIA.
The CG nanoparticles were produced using the sodium citrate reduction method according to previous studies (Liu et al., Citation2016; Song et al., Citation2019; Wang et al., Citation2018; Zhan et al., Citation2017). Briefly, 50 mL of 0.01% (w/v) HAuCl4 solution in a Florence flask was boiled under constant stirring, and 2 mL of freshly prepared 1% (w/v) trisodium citrate was immediately added to the flask. The flask was constantly boiled until the colour of the solution changed to the colour of red wine. The solution was cooled to RT and stored at 4°C until use.
Colloidal gold-labeled antibody conjugates were prepared according to previous studies (Chen et al., Citation2017b; Liu et al., Citation2016; Peng et al., Citation2017). Firstly, the pH of the CG solution was adjusted to pH 8.8 with 0.1 mol/L K2CO3, and then 1 mg of mAb was slowly added into 100 mL of CG solution. The mixture was stirred for 30 min at RT. A total of 10 mL of 10% BSA aqueous solution was used to block any free CG particles which were added under constant stirring for another 30 min. The solution was centrifugation at 8,000 × g for 30 min to remove excess blocking agent and mAb. The precipitates were washed three times with resuspension buffer (0.02M borate buffer [pH8.4], 0.5% Tween, 0.6% BSA, and 5% sucrose). Finally, the CG-labeled mAb precipitate was resuspended in resuspension buffer and stored at 4°C.
Assembly of the test strip
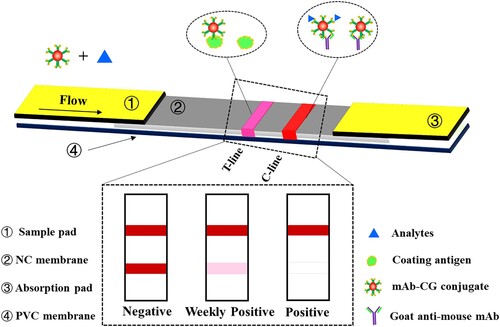
As shown in , the test strip consisted of the sample pad, absorption pad, nitrocellulose (NC) membrane, and polyvinyl chloride (PVC) backing card, and its assembly was performed according to previous methods (Kolosova, De Saeger, Sibanda, Verheijen, & Van Peteghem, Citation2007; Yang et al., Citation2018; Yu et al., Citation2015). The coating antigen and the goat anti-mouse IgG were both dispensed onto the NC membrane to form the test line (T line) and control line (C line), and then the membrane was dried at 37°C for 2 h in an air oven. The free sites on NC membrane were blocked with 0.01 M PBS containing 2% (w/v) BSA for 2 h at RT. The sample pad was treated by 0.01M PBS containing 1% (w/v) BSA, 0.2% (v/v) Tween 20, and 1% (w/v) and sucrose before assembly. After desiccation, the sample pad, NC membrane, and the absorbent pad were laminated onto the PVC backing card with a 2 mm overlap between each part. Finally, the prepared strip card was cut lengthways into 5 mm wide strips and the final product was stored under dry conditions at RM until use.
Figure 1. Schematic illustration of the LFIA for the detection of ADAs.
Sample pretreatment
Blank chicken samples, were obtained from a local market, and confirmed as negative for ADAs using LC-MS. The process of sample pre-treatment was described as follows: 3.0 ± 0.05 g of homogenized chicken samples were weighed and put into a centrifuge tube. One gram of anhydrous sodium sulfate and 6 mL of acetonitrile was added, and then the tube was vortexed for 5 min and centrifuged for 10 min at 4000 × g. Two millilitres of supernatant was added into a second tube and dried under nitrogen in a water bath at 60°C. The residues were dissolved with 1 mL of PBS containing 10% (v/v) methanol and stored at 4°C until needed.
Procedure and principle of the LFIA
For the sample assay, 10 μL of CG-labeled antibody solution, 40 μL of resuspension buffer and 100 μL of ADAs standard or sample extract solution were mixed and incubated for 5 min at RT. The sample pad of the test strip was dipped into the mixture and the solution migrated up the strip to the absorption pad by capillary forces, and the results were obtained in 10 min.
The LFIA principle is based on a competitive reaction, which was shown in . If the sample contains ADAs, the CG-labeled mAb will firstly react with free ADAs in the sample extract and then the unreacted CG-labeled mAb will react with the coating antigens immobilized on the T line during migrating to the absorption pad. Therefore, the free small molecule will compete with the coating antigen immobilized on the T line for the limited amount of CG-labeled mAb. This implies that the colour of T line is related to the concentration of free ADAs in the extract solution. As the concentration of ADAs increases, the amount of unreacted CG-labeled mAb decreases, and the colour intensity of the T line decreases. The C line will always appear as a visible red line, indicating the validity of the test. In addition, because of the inverse relationship between the amount of ADAs in the sample and the colour intensity of the T line, the LFIA can be used for the quantitative detection of ADAs by using a hand held strip reader.
Results and discussions
Design and characterization of the haptens
The aim of this study was to produce a wide spectrum antibody, which can simultaneously recognize more than five ADA drugs. Therefore, the chemical structure of the hapten would need to include a structure common to all of the ADAs. In this study, two haptens were synthesized by using the succinic anhydride and the nucleophilic reaction methods, respectively, and their synthetic processes were shown in .
Figure 2. The synthetic schemes of haptens for AMA. (a) The hapten (AMA-hapten) was synthesized by a nucleophilic substitution reaction. (b) The hapten (RMA-hapten) was synthesized by a succinic anhydride method.
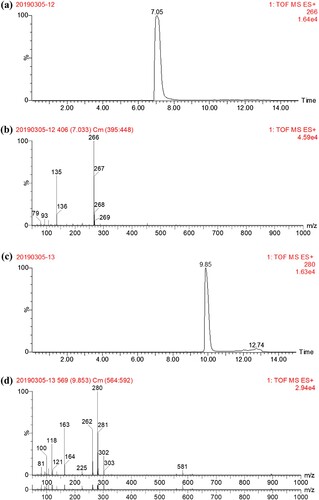
As shown in (a) and 3(b), the liquid chromatogram spectrum revealed that the major products were present at 7.05 min, and at the same retention time, the MS m/z 266 confirmed the presence of the AMA-hapten. The LC-MS analyses for the RMA-hapten were shown in (c) and 3(d). The retention time of the RMA-hapten appeared at 9.85 min, and the MS chromatography revealed that the m/z 280 was consistent with the molecule weight of RMA-hapten, resulting in the successful synthesis of both the AMA and RMA-haptens.
Figure 3. LC–MS analysis of haptens of ADAs. (a) The liquid chromatogram spectrum of AMA-hapten; (b) the mass spectrum of AMA-hapten; (c) The liquid chromatogram spectrum of RMA-hapten; (d) the mass spectrum of RMA-hapten.
Screening of antisera and characterization of the mAb
The sera obtained from the two groups were assayed by ic-ELISA, and the results were shown in . The serum of each mouse was detected using homogeneous and heterogeneous coating antigens, and the results indicated that the best effect was obtained when applying the AMA-hapten-BSA as immunogen and the RMA-hapten-OVA as the coating antigen. As a result of this, mouse No. 4 was chosen for cell fusion.
Table 1. Titre and specficity of the immunized mice.a
A sensitive mAb against ADAs was purified from the ascites fluid by the caprylic acid-ammonium sulfate precipitation method. As shown in (a), the subclass of the mAb was identified as IgG2b by using a mouse mAb isotyping kit. A series of concentrations of mAb (1, 0.5, 0.25 and 0.125 μg/mL et al.) and coating antigen (1, 0.5, 0.25, and 0.125 μg/mL) were assembled in a checkerboard pattern to evaluate the affinity of the anti-ADAs mAb. The results were shown in (b), and the affinity constant (Kaff) was calculated to be 7.25 × 10⁹ L/mol, and the CR of this mAb was shown in . The IC50 values were 0.88, 0.43, 0.39, 7.81, and 7.42 ng/mL for AMA, RMA, SMA, AMK, and AMM, respectively. From the results it is clear that the IC50 values of this antibody for AMA, RMA, and SMA are superior to that of AMK and AMM. One possible reason for this is that the amino group present in the structures of AMA, RMA, and SMA, and not present in AMK and AMM, and this may have a profound effect on the antibody production process.
Figure 4. Characterization of the mAb against ADAs. (a) Isotype determination of the anti-ADAs mAb. (b) Affinity testing results of the antibody.
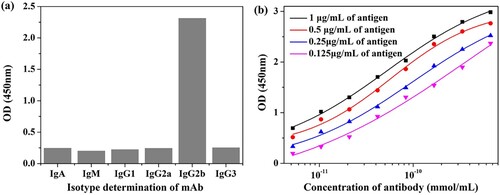
Table 2. The characterization of anti-ADAs mAb.
Optimization of the LFIA
In general, the recognition element is an indispensable part in any sensor device. In LFIA, the CG-labeled anti-ADAs mAb conjugates fulfil this role. A good CG-labeled antibody always results in a good performance when using LFIA. For this reason, the binding conditions for the antibody and CGs were optimized. The pH is one important factor influencing the synthesis of immune reagent conjugates. If the pH is equal to the isoelectric point of an antibody, the mAb is electrically neutral, and is therefore easier to absorb onto the surface of the CGs. Therefore, the pH value was optimized using different concentrations of K2CO3 to get close to the isoelectric point of the antibody. The results demonstrated that pH 8.8 represented an optimal value.
The quantity of mAb is another factor requiring optimization. In this study, a series of mAb contents (50, 100, 150, and 200 μg) were introduced to 10 mL of CG solution. The results revealed that when the concentration of antibody was 10 μg/mL, the consumption of antibody was minimal and the performance of the LFIA was optimal.
Previous studies (Li et al., Citation2011) have reported on a coating condition which included the coating buffer system and coating antigen. In our study, two coating antigens (RMA-hapten-BSA and RMA-hapten-OVA) and three coating buffers, including carbonate buffer (CB, pH 9.6), phosphate buffer (PB, pH 6.5) and PBS, were chosen to determine optimal combinations. The results revealed that the carrier protein BSA was better at avoiding matrix interference when compared with OVA, and the sensitivity of the LFIA for the five ADAs was better when using CB rather than PBS or PB. Therefore, the optimal combination was RMA-hapten-BSA and CB.
Finally, the effect of resuspension buffer with differing amounts of CG-labeled antibody were studied. The functions of the resuspension buffer are primarily to increase the flow rate of the sample solution, protect the immune reagents and improve the stability of the LFIA. In this study, a series of Tween 20 (v/v, 0.3%, 0.5%, and 1%), BSA (w/v, 0.2%, 0.4%, and 0.6%), and sucrose (w/v, 2%, 5%, and 8%) concentrations were optimized. The resuspension buffer containing 0.5% Tween 20, 0.6% BSA, and 5% sucrose was found to have the best effect. The amount of CG-labeled antibody will influence the sensitivity of the LFIA and the colour development of the T and C lines. High amounts of CG-labeled mAb will reduce the sensitivity, whereas low amounts will result in a weak T line. In this study, the best results occurred when the amount of CG-labeled antibody was 10 μg.
Analytical performance of the LFIA
Under optimal conditions, the detection of the LFIA for ADAs were evaluated by testing chicken samples spiked with ADAs. The results revealed that the LFIA could detect ADAs both qualitatively and quantitatively within 15 min.
For qualitative detection of ADAs, the results of the FLIA can be determined using the naked eye. As shown in (a), the chicken samples spiked with the five different ADAs were tested using the LFIA. The visual limit of detection (vLOD) is defined as the minimum concentration of the target that can produce a detectable colour change on the T line when compared to the negative control, and the cut-off value is defined as the concentration of the target that can produce no colour on the T line. As shown in (a), the vLOD of the LFIA were 0.1, 0.1, 1, 5, and 10 μg/kg for SMA, RMA, AMA, AMM, and AMK respectively, and the cut-off values were 2.5, 2.5, 10, 100, and 100 μg/kg for SMA, RMA, AMA, AMM, and AMK respectively in the chicken samples.
Figure 5. The test results of ADAs with LFIA. (a) Qualitative detection of ADAs in chicken samples (SMA: 0, 0.1, 0.25, 0.5, 1, 2.5 μg/kg; RMA: 0, 0.1, 0.25, 0.5, 1, 2.5 μg/kg; AMA: 0, 0.5, 1, 2, 5, 10 μg/mL; AMM: 0, 5, 10, 20, 50, 100 μg/kg; AMK: 0, 5, 10, 20, 50, 100 μg/kg); (b) Standard curves for detecting chicken samples using LFIA. The X-axis is shown as the logarithmic concentrations of ADAs; and T/T0 defined as the ratio of the colour density of the spiked sample to that of the blank sample.
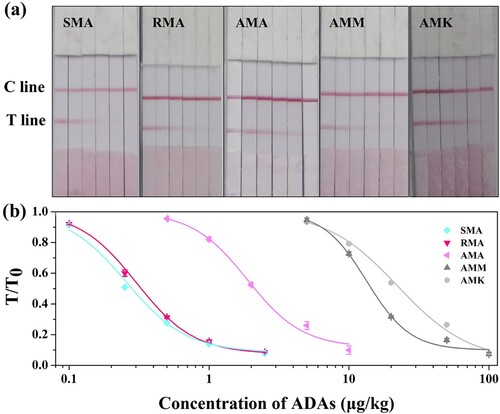
For quantitative detection of ADAs, a portable strip scan reader was used to test the colour intensity of the T line. The concentration of ADAs could be calculated from a standard curve established by plotting the T/T0 values (the ratio of the colour density of the spiked sample to that of the blank sample) for each standard solution against the logarithmic concentration of the ADAs. As shown in (b), five curves were constructed for quantitative detection of the ADAs. The LODs (the concentration of ADAs with a 10% inhibition of the colour density in the negative sample) of the LFIA were 0.06, 0.08, 0.5, 4.1, and 4.9 μg/kg for SMA, RMA, AMA, AMM, and AMK, respectively.
Recovery of ADAs in chicken samples
In order to evaluate the resistance of the LFIA to matrix interference, chicken samples spiked with different concentrations of ADAs (0, 0.2, and 0.5 μg/kg for SMA; 0, 0.2, and 0.5 μg/kg for RMA; 0, 2, and 5 μg/kg for AMA; 0, 25, and 50 μg/kg for AMM; 0, 25, and 50 μg/kg for AMK) were detected to determine recovery efficiency, and the results are shown in . The recovery ranged from 101.4∼110.5% for SMA, 101.9∼106.7% for RMA, 95.0∼110.3% for AMA, 89.4∼100.4% for AMM, and 91.5∼99.0% for AMK with the highest CV at 7.85%.
Table 3. Recovery and precision of LFIA for testing chicken samples spiked ADAs (n = 5).
Authenticity of LFIA
Ten chicken samples spiked with different concentration of ADAs were prepared and simultaneously analyzed by the LFIA and the ELISA kits. The comparison between the LFIA and ELISA is demonstrated in . The differences between the LFIA and the ELISA for testing chicken samples ranged between 0.3% and 16.4%, indicating that the results from the LFIA had a good correlation with the ELISA kit.
Table 4. Comparison of LFIA with ELISA kit for detecting ADAs residues in chicken samples (n = 3).
In summary, two haptens based on the common structure of ADAs were firstly designed, and then two immunogens based on the haptens were injected subcutaneously into mice. The mouse immunized with AMA-hapten-BSA was chosen to carry out cell fusion, and a sensitive mAb, having the ability to recognize five ADAs, was produced. Next, we developed a LFIA strip that could detect all five ADAs simultaneously within 15 min based on this broad-specificity mAb. The recovery experiments and the comparisons with ELISA indicated that the LFIA is capable to detecting ADAs in chicken samples. Therefore, the LFIA is a very convenient tool for the screening of large sample sizes at the point-of-source.
Disclosure statement
No potential conflict of interest was reported by the authors.
Additional information
Funding
References
- Beatty, J. D., Beatty, B. G., & Vlahos, W. G. (1987). Measurement of monoclonal antibody affinity by non-competitive enzyme immunoassay. Journal of Immunological Methods, 100(1), 173–179. doi: 10.1016/0022-1759(87)90187-6
- Cate, D. M., Noblitt, S. D., Volckens, J., & Henry, C. S. (2015). Multiplexed paper analytical device for quantification of metals using distance-based detection. Lab on a Chip, 15(13), 2808–2818. doi: 10.1039/C5LC00364D
- Chen, Y., Guo, L., Liu, L., Song, S., Kuang, H., & Xu, C. (2017a). Ultrasensitive Immunochromatographic strip for fast screening of 27 sulfonamides in honey and pork liver samples based on a monoclonal antibody. Journal of Agricultural and Food Chemistry, 65(37), 8248–8255. doi: 10.1021/acs.jafc.7b03190
- Chen, Y., Liu, L., Xu, L., Song, S., Kuang, H., Cui, G., & Xu, C. (2017b). Gold immunochromatographic sensor for the rapid detection of twenty-six sulfonamides in foods. Nano Research, 10(8), 2833–2844. doi: 10.1007/s12274-017-1490-x
- Chunsheng, L., Yujing, L., Yan, Z., Jingjing, L., Junhua, L., Meng, W., … Zhencai, Y. (2018). Preparation of an anti-formoterol monoclonal antibody for indirect competitive ELISA detection of formoterol in urine and pork samples. Analytical Methods, 10(5), 548–553. doi: 10.1039/C7AY02562A
- Eike, S., Thomas, W., Stephanie, K., Dwek, R. A., Nicole, Z., Thomas, P., & Ralf, B. J. H. (2010). Antiviral effects of amantadine and iminosugar derivatives against hepatitis C virus. Hepatology (Baltimore, Md.), 46(2), 330–338.
- Farajzadeh, M. A., Nouri, N., & Alizadeh Nabil, A. A. (2013). Determination of amantadine in biological fluids using simultaneous derivatization and dispersive liquid-liquid microextraction followed by gas chromatography-flame ionization detection. Journal of Chromatography B, 940, 142–149. doi: 10.1016/j.jchromb.2013.09.035
- Ge, S., Ge, L., Yan, M., Song, X., Yu, J., & Huang, J. (2012). A disposable paper-based electrochemical sensor with an addressable electrode array for cancer screening. Chemical Communications, 48(75), 9397–9399. doi: 10.1039/c2cc34887j
- Gong, M. M., & Sinton, D. (2017). Turning the page: Advancing paper-based microfluidics for broad diagnostic application. Chemical Reviews, 117(12), 8447–8480. doi: 10.1021/acs.chemrev.7b00024
- Higashi, Y., Uemori, I., & Fujii, Y. (2005). Simultaneous determination of amantadine and rimantadine by HPLC in rat plasma with pre-column derivatization and fluorescence detection for pharmacokinetic studies. Biomedical Chromatography, 19(9), 655–662. doi: 10.1002/bmc.492
- Kolosova, A. Y., De Saeger, S., Sibanda, L., Verheijen, R., & Van Peteghem, C. (2007). Development of a colloidal gold-based lateral-flow immunoassay for the rapid simultaneous detection of zearalenone and deoxynivalenol. Analytical and Bioanalytical Chemistry, 389(7-8), 2103–2107. doi: 10.1007/s00216-007-1642-z
- Li, X., Luo, P., Tang, S., Beier, R. C., Wu, X., Yang, L., … Xiao, X. (2011). Development of an immunochromatographic strip test for rapid detection of melamine in raw milk, milk products and animal feed. Journal of Agricultural and Food Chemistry, 59(11), 6064–6070. doi: 10.1021/jf2008327
- Li, M., Tian, J., Al-Tamimi, M., & Shen, W. (2012). Paper-based blood typing device that reports patient’s blood type “in writing”. Angewandte Chemie International Edition, 51(22), 5497–5501. doi: 10.1002/anie.201201822
- Liu, B., Wang, L., Tong, B., Zhang, Y., Sheng, W., Pan, M., & Wang, S. (2016). Development and comparison of immunochromatographic strips with three nanomaterial labels: Colloidal gold, nanogold-polyaniline-nanogold microspheres (GPGs) and colloidal carbon for visual detection of salbutamol. Biosensors and Bioelectronics, 85, 337–342. doi: 10.1016/j.bios.2016.05.032
- Liu, Y., Wang, L.-T., Zhou, K., Eremin, S. A., Huang, X.-A., Sun, Y.-M., … Lei, H.-T. (2018). Rapid and homologous immunoassay for the detection of herbicide propisochlor in water. Food and Agricultural Immunology, 29(1), 67–83. doi: 10.1080/09540105.2017.1359499
- Mani, V., Kadimisetty, K., Malla, S., Joshi, A. A., & Rusling, J. F. (2013). Paper-based electrochemiluminescent screening for genotoxic activity in the environment. Environmental Science & Technology, 47(4), 1937–1944. doi: 10.1021/es304426j
- Nery, E. W., & Kubota, L. T. (2013). Sensing approaches on paper-based devices: A review. Analytical and Bioanalytical Chemistry, 405(24), 7573–7595. doi: 10.1007/s00216-013-6911-4
- Peng, J., Liu, L., Xu, L., Song, S., Kuang, H., Cui, G., & Xu, C. (2017). Gold nanoparticle-based paper sensor for ultrasensitive and multiple detection of 32 (fluoro)quinolones by one monoclonal antibody. Nano Research, 10(1), 108–120. doi: 10.1007/s12274-016-1270-z
- Sharma, V. D., Lyons, K. E., & Pahwa, R. (2018). Amantadine extended-release capsules for levodopa-induced dyskinesia in patients with Parkinson’s disease. Therapeutics and Clinical Risk Management, 14, 665–673. doi: 10.2147/TCRM.S144481
- Singer, C., Papapetropoulos, S., Gonzalez, M. A., Roberts, E. L., & Lieberman, A. (2005). Rimantadine in Parkinson’s disease patients experiencing peripheral adverse effects from amantadine: Report of a case series. Movement Disorders, 20(7), 873–877. doi: 10.1002/mds.20471
- Song, S., Suryoprabowo, S., Liu, L., Kuang, H., Xu, L., Ma, W., & Wu, X. (2019). Development of monoclonal antibody-based colloidal gold immunochromatographic assay for analysis of halofuginone in milk. Food and Agricultural Immunology, 30(1), 112–122. doi: 10.1080/09540105.2018.1550058
- Srisa-Art, M., Boehle, K. E., Geiss, B. J., & Henry, C. S. (2018). Highly sensitive detection of salmonella typhimurium using a colorimetric paper-based analytical device coupled with immunomagnetic separation. Analytical Chemistry, 90(1), 1035–1043. doi: 10.1021/acs.analchem.7b04628
- Suryoprabowo, S., Liu, L., Peng, J., Kuang, H., & Xu, C. (2015). Antibody for the development of specific immunoassays to detect nadifloxacin in chicken muscles. Food and Agricultural Immunology, 26(3), 317–324. doi: 10.1080/09540105.2014.914469
- Wang, Z., Sun, L., Liu, L., Kuang, H., Xu, L., & Xu, C. (2018). Ultrasensitive detection of seventeen chemicals simultaneously using paper-based sensors. Materials Chemistry Frontiers, 2(10), 1900–1910. doi: 10.1039/C8QM00336J
- Wang, J., Wang, Y., Pan, Y., Feng, L., Chen, D., Liu, Z., … Yuan, Z. (2016). Preparation of a broadly specific monoclonal antibody-based indirect competitive ELISA for the detection of benzodiazepines in edible animal tissues and feed. Food Analytical Methods, 9(12), 3407–3419. doi: 10.1007/s12161-016-0528-0
- Wang, Z., Xie, Z., Cui, G., Liu, L., Song, S., Kuang, H., & Xu, C. (2017). Development of an indirect competitive enzyme-linked immunosorbent assay and immunochromatographic assay for hydrocortisone residues in milk. Food and Agricultural Immunology, 28(3), 476–488. doi: 10.1080/09540105.2017.1297779
- Wang, Z., Zheng, Q., Guo, L., Suryoprabowo, S., Liu, L., & Kuang, H. (2017). Preparation of an anti-dexamethasone monoclonal antibody and its use in development of a colloidal gold immunoassay. Food and Agricultural Immunology, 28(6), 1–11.
- Wu, X., Kuang, H., Hao, C., Xing, C., Wang, L., & Xu, C. (2012). Paper supported immunosensor for detection of antibiotics. Biosensors and Bioelectronics, 33(1), 309–312. doi: 10.1016/j.bios.2012.01.017
- Xie, C. H., Chen, F. J., & Yang, T. B. (2012). A high-affinity anti-salbutamol monoclonal antibody: Key to a robust lateral-flow immunochromatographic assay. Analytical Biochemistry, 426(2), 118–125. doi: 10.1016/j.ab.2012.04.015
- Xie, C., Wang, R., Saeed, A., Yang, Q., Chen, H., Ling, S., … Wang, S. (2018). Preparation of anti-human podoplanin monoclonal antibody and its application in immunohistochemical diagnosis. Scientific Reports, 8(1), 10162–10172. doi: 10.1038/s41598-018-28549-w
- Xu, F., Jiang, W., Zhou, J., Wen, K., Wang, Z., Jiang, H., & Ding, S. (2014). Production of monoclonal antibody and development of a new immunoassay for apramycin in food. Journal of Agricultural and Food Chemistry, 62(14), 3108–3113. doi: 10.1021/jf405379r
- Yang, X., Yang, J., Wang, Y., Li, L., Sun, Z., Yue, Z., … Hu, X. (2018). A lateral flow immunochromato-graphic strip test for rapid detection of oseltamivir phosphate in egg and chicken meat. Scientific Reports, 8(1), 16680. doi: 10.1038/s41598-018-35080-5
- Yu, Q., Li, H., Li, C., Zhang, S., Shen, J., & Wang, Z. (2015). Gold nanoparticles-based lateral flow immunoassay with silver staining for simultaneous detection of fumonisin B1 and deoxynivalenol. Food Control, 54, 347–352. doi: 10.1016/j.foodcont.2015.02.019
- Zhan, L., Guo, S. Z., Song, F., Gong, Y., Xu, F., Boulware, D. R., … Bischof, J. C. (2017). The role of nanoparticle design in determining analytical performance of lateral flow immunoassays. Nano Letters, 17(12), 7207–7212. doi: 10.1021/acs.nanolett.7b02302
- Zhao, L., Li, J., Li, Y., Wang, T., Jin, X., Wang, K., … Zhou, F. (2017). Preparation of monoclonal antibody and development of an indirect competitive enzyme-linked immunosorbent assay for ornidazole detection. Food Chemistry, 229, 439–444. doi: 10.1016/j.foodchem.2017.02.100
- Zhao, S., Li, D., Qiu, J., Wang, M., Yang, S., & Chen, D. (2014). Simultaneous determination of amantadine, rimantadine and chlorpheniramine in animal-derived food by liquid chromatography-tandem mass spectrometry after fast sample preparation. Analytical Methods, 6(17), 7062–7067. doi: 10.1039/C4AY00516C