
 ?Mathematical formulae have been encoded as MathML and are displayed in this HTML version using MathJax in order to improve their display. Uncheck the box to turn MathJax off. This feature requires Javascript. Click on a formula to zoom.
ABSTRACT
We investigated the effects on lipid metabolism and inflammatory response of different proportions of standard wheat flour in the total dietary carbohydrates. Mice were supplemented with the daily food in which energy from standard wheat flour was 30% (G30), 40% (G40), 50% (G50), 60% (G60), or 70% (G70) during 10 weeks experiment. The results showed that when the percentage of energy from standard wheat flour was in the medium range, 40%–60%, TC, TG, and free fatty acid levels in the liver were relatively low. In the G70, the expression of insulin receptor substrate 2 (IRS2) mRNA in mouse liver increased, whereas 50%–60% energy from standard wheat flour significantly increased the expression of PPARα mRNA and reduced the inflammatory response. When the percentage of energy from standard wheat flour was low, the expression of NF-κB mRNA was low and the inflammatory responses were elevated.
1. Introduction
Lifestyle, physical exercise, and dietary patterns are the three most important independent factors associated with metabolic syndrome, among which dietary pattern is especially important (Hassannejad et al., Citation2018). “Dietary pattern” refers to the quantities of different foods in the diet and the percentages of energy they contribute to the diet. High-carbohydrate diets increase the risk of chronic diseases in humans (Bhandarkar, Brown, & Panchal, Citation2019). When the total energy remains unchanged, high-carbohydrate diets not only accelerate the development of chronic diseases in some individuals, including dyslipidemia, hypertension, and proinflammatory diseases, but also cause other chronic diseases, such as fatty liver and liver injury (Sirjani et al., Citation2014). High-carbohydrate diets also increase the risk of mild cognitive impairment (MCI) in older adults nearly four-fold compared with moderate-carbohydrate diets, and MCI is a precursor to Alzheimer’s disease (Krikorian et al., Citation2012). Therefore, carbohydrates in the diet have an important impact on the health of the body.
The carbohydrates in modern human diets are mainly provided by sucrose and starch. In traditional Chinese diets, grains are the major source of carbohydrates. As well as large amounts of starch, grains also contain high amounts of protein, fibre, and various minerals (Rebello et al., Citation2014). These nutrients are more abundant in whole grains. The benefits of whole grains are well documented (Georgeta, Vaidean, Sandeep, & Jacqueline, Citation2018), but the palatability of whole grains is poor. In the traditional diets of the northern Chinese, standard wheat flour has been the main source of carbohydrates (Ma, Ji, & Baik, Citation2017), and the proportion of sucrose is very small. In the past 40 years, with the tremendous development of China’s economy and society, Chinese diets have become more international. Today, the proportion of sucrose in the carbohydrates in the Chinese diet has increased significantly, whereas the proportion of grains is significantly reduced. At the same time, the incidence of cardiovascular disease in China has risen sharply, which is not only related to changes in the lifestyles of the Chinese population, but is also probably related to their dietary patterns (Li, Cao, Xie, Li, & Bao, Citation2019), especially the proportion of grains in their dietary carbohydrates.
Standard wheat flour plays a very important role in the dietary pattern of the population of northern China, and its proportion in dietary carbohydrates is extremely important for the health of the Chinese people. In this study, mice were used to study the effects of different percentages of dietary energy derived from standard wheat flour on several biochemical indicators, when the total metabolic energy and total carbohydrates were held constant, to provide some useful information on Chinese dietary patterns.
2. Materials and methods
2.1. Design of animal experiments
Fifty healthy 10-week-old specific-pathogen-free ICR mice (25 male and 25 female), weighing 40–50 g, were purchased from Shanghai Lingchang Biotechnology Co., Ltd (Shanghai, China).
2.1.1. Experimental grouping and animal management
The experimental mice were raised in a clean animal laboratory, with a 12:12 h light: dark cycle, a temperature of 20–26°C, and relative humidity of 40%–70%. After 1 week of dietary acclimation, the animals were randomly divided into five groups, with 10 mice in each group. The mice in each group were fed one of five diets containing different percentages of energy from standard wheat flour, for 10 weeks. The mice in all groups were allowed feed and water ad libitum, and were kept under clean and hygienic conditions. The feed intake and bodyweight of the mice were recorded weekly, and the amount of feed dropped during feeding was also recorded.
2.1.2. Feed formulations
Based on the standard AIN-93M diet, corn starch and sugar were replaced with standard wheat flour to ensure that the total energy of carbohydrate remained unchanged, and the total protein was balanced by casein. The standard wheat flour was purchased from the supermarket, and its composition is as follows: protein 9.5 /100 g, fat 1.4 /100 g, carbohydrate 75.1 /100 g, cellulose 0.7 /100 g, mineral 1.2 /100 g. Five diets were designed in which the percentage of energy from standard wheat flour was 30%, 40%, 50%, 60%, or 70%. Accordingly, the animals were divided into five groups: G30, G40, G50, G60 and G70. The detailed compositions of the diets are shown in .
Table 1. Composition of experimental diets (g/kg).
2.2. Tissue sample collection
At the end of the 10-week exp erimental period, the mice were fasted overnight. All procedures, including orbital hemorrhage and euthanasia, were performed under anesthesia induced with a continuous inhalation of 2% isoflurane through a nose cone. Blood was taken from the femoral artery under anesthesia. The blood samples were collected and centrifuged at 3,000 × g for 15 min at 4°C, and the supernatants were collected and stored. After the blood was taken, the liver was quickly dissected and weighed, and part of the liver tissue was excised from the right lobe and stored at −80°C for analysis.
2.3. Determination of the liver, intestinal, epididymal, and perirenal fat masses
The bodyweight, feed intake, and remaining feed mass (five mice per cage) were measured weekly. At the end of the 10-week experimental period, the mice were fasted overnight. All procedures, including orbital hemorrhage and euthanasia, were performed under anesthesia, induced with a continuous inhalation of 2% isoflurane through a nose cone. Blood was taken from the femoral artery under anesthesia. The blood samples were separated and the sera collected for analysis.
The epididymal, intestinal, and perirenal fat were weighed to calculate their masses. The total lipid content of the liver was determined by the Soxhlet extraction (AOAC, Citation1995). Briefly, lipids were extracted from the liver (about 300 mg) with 20:1 (v/w) CHCl2:CH3OH (2:1), and the solvent was then evaporated. The dry weight was calculated.
The percentage body fat in the total bodyweight were calculated with the equations:
2.4. Changes in blood biochemical indicators in mice
Fasting plasma glucose (FPG), blood triglyceride (TG), total cholesterol (TC), high-density lipoprotein-cholesterol (HDL-C), low-density lipoprotein -cholesterol (LDL-C), nonesterified fatty acids (NEFA), insulin (INS), and glucagon (GN) in the mouse sera were determined with corresponding kits (Nanjing Jiancheng Institute of Bioengineering, Nanjing, China). Tumour necrosis factor α (TNF-α) was measured with a TNF-α enzyme-linked immunosorbent assay (ELISA) kit (Wuhan Boside Biotech Co. Ltd, Wuhan, China). All procedures were performed in accordance with the manufacturers’ instructions.
2.5. Analysis of mouse liver parameters
To prepare each liver homogenate, a small piece of liver tissue was taken from the largest lobe at 0.5 cm from the edge, washed with ice-cold physiological saline, and dried with filter paper. A sample (0.5 g) of the liver was placed in 5 ml of precooled saline, and quickly homogenized three times with a disperser at 3000 rpm, for 10 s each time, separated by intervals of 30 s. Part (40%) of the liver homogenate was centrifuged at 4°C in a high-speed refrigerated centrifuge at 4000 rpm for 10 min. The supernatant (3 ml) was collected, sealed, and stored at −20°C until analysis. TG, TC, and NEFA were determined according to the instructions accompanying the kits.
2.6. Morphological observation of liver tissues
The liver tissues of the experimental mice were fixed in 10% neutral-buffered formalin for 48 h, and then dehydrated through a graded series of ethanol and embedded in paraffin. Liver sections (5 μm thick) were cut with a microtome, dewaxed, and rehydrated. The sections were stained with hematoxylin–eosin and the changes in the liver histomorphology were observed under a light microscope (Zhang, Pan, Jiang, & Mo, Citation2015).
2.7. mRNA expression in the liver and adipose tissue of genes involved in lipid metabolism
The total RNAs in the liver and epididymal adipose tissues were extracted with an RNA extraction kit (Nanjing Jiancheng Bioengineering Institute), according to the manufacturer’s protocol, and cDNA was synthesized with the RevertAid First Strand cDNA Synthesis Kit (TaKaRa Bio Inc., Tokyo, Japan), according to the manufacturer’s protocol. An aliquot (1 μl) of the diluted cDNA (1:10) was used in each real-time PCR using iQ™ SYBR® Green Supermix (Bio-Rad, Hercules, CA, USA) on an Mx3000P instrument (Stratagene, Cedar Creek, TX, USA). The PCR cycling parameters were: predenaturation at 95°C for 30 s, followed by 40 cycles of denaturation at 94°C for 5 s, annealing at 60°C for 34 s, and extension at 60°C for 30 s. The ΔΔCt method was used to quantify the relative gene expression. Differences in mRNA expression were calculated after the expression of each gene was normalized to that of 18S rRNA. The sequences of the primers used in this study are shown in .
Table 2. Primers used for real-time RT-PCR.
2.8. Statistical analysis
The data were analyzed with one-way ANOVA and Duncan’s multiple-range test using SPSS 17.0 (SPSS Inc., Chicago, IL, USA). The level of significance was defined as p < 0.05, and the results are expressed as means ± standard deviations.
3. Results and discussion
3.1. Effect of the percentage of energy derived from standard wheat flour on the bodyweights of mice
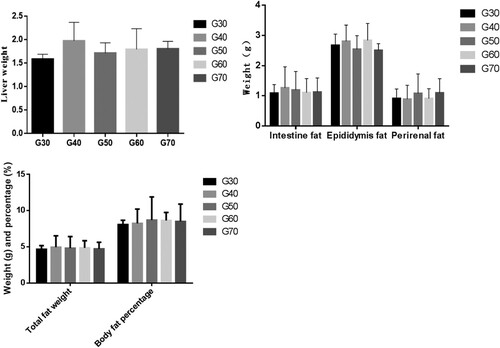
The weights of liver, fat weight and fat ratio in the mice are shown in . After 10 weeks of feeding, there was no significant differences in the liver weights and epididymal fat, intestinal fat, perirenal fat, total fat weight and fat ratio in the different groups, indicating that the different proportions of wheat flour had no significant effect on the percentage body fat or the percentage liver mass in the mouse bodies when the total energy of carbohydrate in feed is constant. Wheat flour belongs to the traditional food of human beings and does not contain drugs or a large number of biological active substances. Therefore, it will take a long time to get the results of the macroscopic indicators of the body, such as weight, caused by the consumption of wheat flour.
Figure 1. Weights of liver, epididymal fat, intestinal fat, perirenal fat, total fat weight and fat ratio of ICR mice in each group. Values are expressed as mean ± S.D; Within the same bar, means with different letters (a or b) are significantly different at p < 0.05 by Duncan’s multiple range test.
3.2. Effects of the percentage of energy from standard wheat flour on blood glucose and blood lipids
3.2.1. Effects of the percentage of energy from standard wheat flour on blood glucose in mice
The effect of the percentage of energy from standard wheat flour on the FPG levels of mice are shown in . As can be seen from , there was no significant difference in the FPG levels of the G30, G40, G50 and G60 groups (p < 0.05). The FPG level was lowest in the G50 group, and the differences between the G50 group and G70 group were significant. The FPG level was significantly higher in the G70 group than in the other groups. As can be seen from , the serum INS level was lowest in the G30 group and highest in the G70 group, indicating that serum INS increased as the percentage of standard wheat flour in the diet increased. As can be seen from , the serum GN level was slightly higher in the G50 group than in the other groups (p < 0.05). These results indicate that when the percentage of energy from standard wheat flour was very high (70%), the FPG and INS levels in the mouse sera were high, whereas when the percentage of energy from standard wheat flour was 50%, the GN level was only slightly elevated.
Figure 2. The serum levels of fasting blood glucose, insulin and glucagon of ICR mice in each group. Values are expressed as mean ± S.D; Within the same bar, means with different letters (a or b) are significantly different at p < 0.05 by Duncan’s multiple range test.
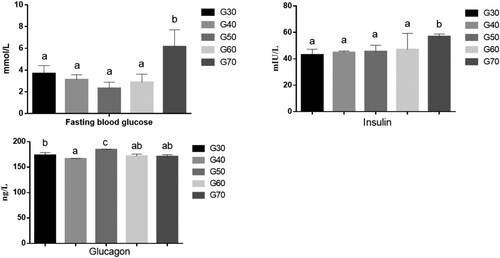
The FPG level is an important indicator of whether the body’s metabolism is abnormal (Takao, Inoue, Suka, Yanagisawa, & Iwamoto, Citation2018). When the glucose metabolism in the body is abnormal, the glucose in the blood cannot enter the cells rapidly, increasing the blood glucose concentration, which stimulates the secretion of INS from pancreatic β cells. As a result, the INS concentration in the blood increases further (Chareyron, Wall, Thevenet, Santo-Domingo, & Wiederkehr, Citation2019). The lower blood glucose level in the G50 group would induce the secretion of GN from pancreatic α cells, which would promote liver glycogen breakdown and gluconeogenesis.
3.2.2. Effects of the percentage of energy from standard wheat flour on blood lipids in mice
The effects of the percentage of energy derived from standard wheat flour on the blood lipids in mice are shown in . When the percentage of energy from standard wheat flour was between 30% and 60%, it had no significant effect on TG, TC, or HDL–C levels in the mice. However, the serum TG level was significantly higher in the G70 group than in the other groups, whereas the serum TC and HDL–C concentrations were lower in the G70 group than in the other groups. High-density lipoprotein promotes the elimination of cholesterol from the peripheral tissues and reduces the risk of atherosclerosis (Cuchel, Rohatgi, Sacks, & Guyton, Citation2018). It carries an endogenous cholesterol ester that is transported to the liver and removed from the blood. The LDL–C level is used to estimate the level of LDL (Shen, Zhang, Dong, Ren, & Chen, Citation2015). shows that the LDL–C level was significantly higher in the G30 group than in the other groups (p < 0.05), but there are no significant difference among G40, G50, G60 and G70. LDL is a major type of lipoprotein, and elevated LDL in the serum can cause atherosclerosis (Fernández-Friera, Fuster, López-Melgar, Oliva, & Sanz, Citation2017). The concentration of FFA in the serum is related to lipid metabolism, glucose metabolism, and endocrine function. The concentration of FFA may increase as a result of abnormal glucose metabolism or abnormal lipid metabolism, such as in diabetes or liver disorders. The results showed that the serum FFA levels had no significant difference among five groups.
Figure 3. The serum levels of TG, TC, HDL-C, LDL-C, FFA and TNF- of ICR mice in each group. Values are expressed as mean ± S.D; Within the same bar, means with different letters (a or b) are significantly different at p < 0.05 by Duncan’s multiple range test.
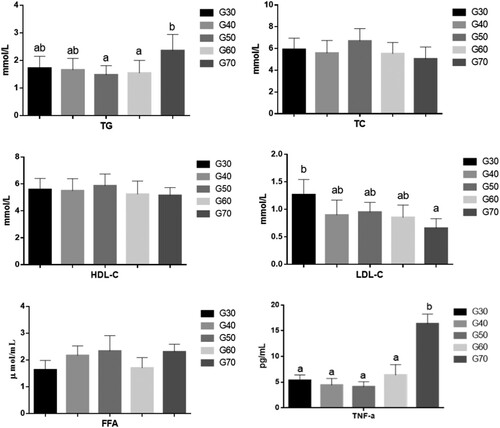
Although standard wheat flour content has no significant effect on serum TC, FFA and HDL-C, high standard wheat flour content increased serum TG, while low grain content increased serum LDL-C. Therefore, the consumption of too much or too little standard wheat flour had an adverse effect on the lipid metabolism in these mice.
3.3. Effects of the percentage of energy from standard wheat flour on a serum inflammatory factor in mice
The effects of the percentage of energy from standard wheat flour on serum tumour necrosis factor alpha (TNF-α) in mice are shown in . There was no significant change in the TNF-α levels when the percentage of energy from standard wheat flour was between 30% and 60%. However, when it reached 70%, the TNF-α level in the mouse serum increased sharply, and was significantly higher than that in the other groups (p < 0.05). TNF-α is secreted by adipocytes and is an important inflammatory factor associated with atherosclerosis. It is also closely associated with insulin resistance, type 2 diabetes, and cancer (Chen, Shen, Chen, Lin, & Shaw, Citation2018). These results indicate that a very high proportion of dietary grains increases the inflammatory factors and damages the body’s health. Reducing TNF-α levels could improve the insulin sensitivity of cells.
3.4. Effects of the percentage of energy from standard wheat flour on liver TG, TC, and FFA
The liver is the main organ of lipid synthesis and metabolism, and is the nexus at which the balance of lipid metabolism in the body is maintained (Ipsen, Lykkesfeldt, & Tveden-Nyborg, Citation2018). Common nutritional diseases and lifestyle diseases usually occur in or originate from the liver. The fat present in the liver usually does not cause damage, but in some cases, the abnormal accumulation of lipids in the liver interferes with the normal liver functions and causes liver damage (Fucho, García-Ruiz, & Fernández-Checa, Citation2010). High levels of TG and TC are the main causes of atherosclerosis, and the level of TG is directly dependent on the synthetic and metabolic levels of liver lipids (Luo et al., Citation2017). An excess of intrahepatic TG indicates an imbalance between the complex interactions between the metabolic processes.
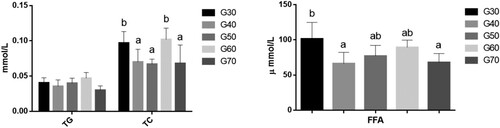
As can be seen from , the levels of liver TC and FFA differed significantly among the different groups, but there was no significant correlation between these differences and the percentage of energy derived from wheat flour. These parameters were lower in the G40 group than in the other groups. The liver FFA level was significantly higher in the G30 group than in the other groups. The liver TG and TC levels were slightly higher in the G60 group than in the other groups.
Figure 4. The liver levels of TG, TC and FFA of ICR mice in each group. Values are expressed as mean ± S.D; Within the same bar, means with different letters (a or b) are significantly different at p < 0.05 by Duncan’s multiple range test.
3.5. Observation of liver tissue sections
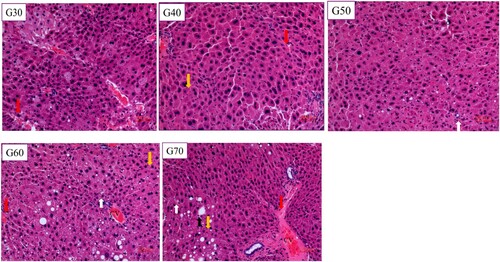
As can be seen in , small granular fat droplets had aggregated, some large fat droplet were unevenly distributed, and necrotic hepatocytes were present in the liver tissue sections of the G30 group. There were no lipid droplets in the mouse liver cells of the G40 or G50 group. Their liver cells were structurally intact, the boundaries between the liver cells were well defined, and the nuclei were located in the centres of liver cells. Small granular fat droplets had aggregated in G60 group, whereas there were more small granular fat droplets and large lipid droplets in the hepatocytes of the G70 group. These results show that lipid droplets were more abundant in the liver sections of the G60 and G70 groups, indicating higher fat levels. The liver sections from mice in the G40 and G50 groups were in good condition, indicating that when the percentage of energy from standard wheat flour was 40%–50%, it had no adverse effect on the mouse liver.
Figure 5. Photomicrographs of haematoxylin and eosin stained of mice liver under light magnification.Data shown are representative images (magnification 100×) of each group. The white arrow indicates steatosis of hepatocytes, with the nucleus centred and cytoplasm filled with transparent lipid droplets. The black arrow indicates the deposition of large fat droplets and nuclear deviation. The red arrow shows inflammatory cells infiltrating into the hepatic sinus. The yellow arrow refers to necrotic hepatocytes, cytoplasmic erythema. CV is a central vein with occasional hyperemia.
3.6. mRNA expression of IRS2, PPARα, and NF-κB in the mouse liver
The effects of the percentage of energy derived from standard wheat flour on the mRNA expression of IRS2, PPARα, and NF-κB in the mouse liver are shown in . Insulin resistance is the main cause of diabetes and the key pathophysiological basis for the development of diabetes and its complications. IRS1 and IRS2 are insulin receptor substrate proteins, and are the main substrates for insulin receptor tyrosine kinase (Kubota, Kubota, & Kadowaki, Citation2012). IRS1 is mainly expressed in the muscle, whereas IRS2 is mainly expressed in the liver, where it promotes the synthesis of hepatic glycogen and the glucose output (Aoki, Tajima, Taguri, & Terauchi, Citation2016). Our experimental results show that the expression of IRS2 mRNA was higher in the G50 group than in the other groups. Therefore, a diet in which 50% of energy is provided by standard wheat flour has a favourable effect on the liver carbohydrate metabolism.
Figure 6. The mRNA expression levels of irs2, PPARα and NF-kB in the ICR mice liver. Values are expressed as mean ± S.D; Within the same bar, means with different letters (a or b) are significantly different at p < 0.05 by Duncan’s multiple range.
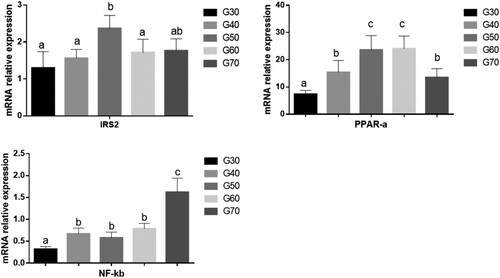
The results shown in demonstrate that the expression of PPARα mRNA in the liver tissues gradually increased in the G30, G40, G50 and G60 groups, but its expression in the liver tissues of the G70 group decreased. PPARα is a peroxisome proliferator-activated receptor. It is a ligand-activated transcription factor that mainly occurs in liver tissues and plays a role in regulating the lipid metabolism (Imran et al., Citation2017; Huang, Kang, Park, & Im, Citation2017). Studies have shown that a deficiency of PPARα can lead to hepatic steatosis and inflammation (Tapia et al., Citation2014). Our results show that when the percentage of dietary energy derived from standard wheat flour was 50%–60%, the expression of PPARα mRNA increased, whereas when the percentage of standard wheat flour was too high or too low, the expression of PPARα mRNA decreased, which may heighten the hepatic inflammatory responses.
As can be seen from , there was no significant difference in the expression of NF-κB mRNA in the mouse liver tissues of the G30, G40, G50, and G60 groups. However, when the percentage of energy from standard wheat flour was 70%, the expression of NF-κB mRNA increased significantly. A large number of studies have shown that chronic low-grade inflammation plays a key role in the initiation, propagation, and development of metabolic diseases. The transcription factors of the NF-κB family play critical roles in inflammation and innate immunity. NF-κB is also increasingly recognized as a crucial factor in many steps of cancer initiation and progression (Ren et al., Citation2015). The results of this study indicate that when 70% of dietary energy is derived from grains, the chronic inflammatory responses increase in the mouse liver.
4. Conclusion
The effects of the proportion of standard wheat flour in diets on the blood glucose, blood lipids, and inflammation in mice were studied, while the total energy and total carbohydrates consumed remained unchanged. Our results show that when the percentage of energy derived from standard wheat flour (50%) was moderate, it helped to control the bodyweight gain in mice, and maintained their hepatic TC, TG, and FFA at low levels and the hepatic expression of IRS2 and PPARα mRNAs at high levels. These trends have favourable effects on the glucose metabolism and lipid metabolism in the liver. In contrast, when the percentage of energy from standard wheat flour was very high (70%) or very low (30%), the blood glucose in the mice increased, leading to higher FFA levels in the liver. Furthermore, when the percentage of energy from standard wheat flour was very high, the levels of TNF-α in the blood and NF-κB in the liver increased, thereby increasing the inflammatory cells in the liver and promoting the inflammatory response.
Disclosure statement
No potential conflict of interest was reported by the authors.
Additional information
Funding
Related Research Data
References
- AOAC (Association of Official Analytical Chemists): Animal feed. (1995). Official Methods of Analysis of Official Analytical Chemists International (16th ed.). Arlington, VA, USA: Association of Official Analytical Chemists.
- Aoki, K., Tajima, K., Taguri, M., & Terauchi, Y. (2016). Effect of dehydroepiandrosterone (DHEA) on Akt and protein kinase C zeta (PKC zeta) phosphorylation in different tissues of C57BL6, insulin receptor substrate (IRS)1(-/-), and IRS2(-/-) male mice fed a high-fat diet. Journal of Steroid Biochemistry and Molecular Biology, 159(1), 110–120. doi: 10.1016/j.jsbmb.2016.03.011
- Bhandarkar, N. S., Brown, L., & Panchal, S. K. (2019). Chlorogenic acid attenuates high-carbohydrate, high-fat diet-induced cardiovascular, liver, and metabolic changes in rats. Nutrition Research, 62, 78–88. doi: 10.1016/j.nutres.2018.11.002
- Chareyron, I., Wall, C., Thevenet, J., Santo-Domingo, J., & Wiederkehr, A. (2019). Cellular stress is a prerequisite for glucose-induced mitochondrial matrix alkalinization in pancreatic β-cells. Molecular and Cellular Endocrinology, 481, 71–83. doi: 10.1016/j.mce.2018.11.011
- Chen, F. C., Shen, K. P., Chen, J. B., Lin, H. L., & Shaw, S. Y. (2018). PGBR extract ameliorates TNF-α induced insulin resistance in hepatocytes. The Kaohsiung Journal of Medical Sciences, 34(1), 14–21. doi: 10.1016/j.kjms.2017.08.009
- Cuchel, M., Rohatgi, A., Sacks, F. M., & Guyton, J. (2018). JCL roundtable: High-density lipoprotein function and reverse cholesterol transport. Journal of Clinical Lipidology, 12(5), 1086–1094. doi: 10.1016/j.jacl.2018.09.005
- Fernández-Friera, L., Fuster, V., López-Melgar, B., Oliva, B., & Sanz, J. (2017). Normal LDL-cholesterol levels Are associated With Subclinical atherosclerosis in the Absence of risk factors. Journal of the American College of Cardiology, 70(24), 2979–2991. doi: 10.1016/j.jacc.2017.10.024
- Fucho, R., García-Ruiz, C., & Fernández-Checa, J. C. (2010). Differential hepatic lipid accumulation in ASMase−/− mice on HFD is associated with hyperglycaemia and liver damage. Chemistry and Physics of Lipids, 163, S58–S59. doi: 10.1016/j.chemphyslip.2010.05.175
- Georgeta, D., Vaidean, M. M., Sandeep, S. V., & Jacqueline, G. (2018). The cholesterol-lowering effect of statins is potentiated by whole grains intake. The Polish Norwegian study (PONS). European Journal of Internal Medicine, 50, 47–51. doi: 10.1016/j.ejim.2017.11.005
- Hassannejad, R., Kazemi, L., Sadeghi, M., Mohammadifard, N., Roohafza, H., Sarrafzadegan, N., … Mansourian, M. (2018). Longitudinal association of metabolic syndrome and dietary patterns: A 13-year prospective population-based cohort study. Nutrition, Metabolism and Cardiovascular Diseases, 28(4), 352–360. doi: 10.1016/j.numecd.2017.10.025
- Huang, J., Kang, S., Park, S. J., & Im, D. S. (2017). Apelin protects against liver X receptor-mediated steatosis through AMPK and PPAR alpha in human and mouse hepatocytes. Cellular Signalling, 39, 84–94. doi: 10.1016/j.cellsig.2017.08.003
- Imran, M., Nadeem, M., Saeed, F., Imran, A., Khan, M. R., Khan, M. A., … Rauf, A. (2017). Immun-omodulatory perspectives of potential biological spices with special reference to cancer and diabetes. Food and Agricultural Immunology, 28(4), 543–572. doi: 10.1080/09540105.2016.1259293
- Ipsen, D. H., Lykkesfeldt, J., & Tveden-Nyborg, P. (2018). Molecular mechanisms of hepatic lipid accumulation in non-alcoholic fatty liver disease. Cellular and Molecular Life Sciences, 75(18), 3313–3327. doi: 10.1007/s00018-018-2860-6
- Krikorian, R., Shidler, M. D., Dangelo, K., Couch, S. C., Benoit, S. C., & Clegg, D. J. (2012). Dietary ketosis enhances memory in mild cognitive impairment. Neurobiology of Aging, 33(2), 425.e19–425.e27. doi: 10.1016/j.neurobiolaging.2010.10.006
- Kubota, T., Kubota, N., & Kadowaki, T. (2012). Regulation of insulin sensitivity by serine/threonine phosphorylation of insulin receptor substrate proteins IRS1 and IRS2. Diabetologia, 55(10), 2565–2582. doi: 10.1007/s00125-012-2644-8
- Li, X. D., Cao, H. J., Xie, S. Y., Li, K. C., & Bao, Y. S. (2019). Adhering to a vegetarian diet may create a greater risk of depressive symptoms in the elderly male Chinese population. Journal of Affective Disorders, 243, 182–187. doi: 10.1016/j.jad.2018.09.033
- Luo, H. Q., Liu, J. N., Ouyang, Q., Xuan, C. X., Wang, L. L., Li, T. T., & Liu, J. (2017). The effects of oleanolic acid on atherosclerosis in different animal models. Acta Biochimica et Biophysica Sinica, 49(4), 349–354. doi: 10.1093/abbs/gmx013
- Ma, F. Y., Ji, T., & Baik, B. K. (2017). Quality characteristics of northern-style Chinese steamed bread prepared from soft red winter wheat flours with waxy wheat flour substitution. Journal of Cereal Science, 73, 99–107. doi: 10.1016/j.jcs.2016.12.002
- Rebello, S. A., Koh, H., Chen, C., Naidoo, N., Odegaard, A. O., Koh, W. P., … Dam, R. M. (2014). Amount, type, and sources of carbohydrates in relation to ischemic heart disease mortality in a Chinese population: A prospective cohort study. American Journal of Clinical Nutrition, 100(1), 53–64. doi: 10.3945/ajcn.113.076273
- Ren, F., Zhou, L., Zhang, X. Y., Wen, T., Shi, H. B., Xie, B. X., … Duan, P. (2015). Endoplasmic Reticulum Stress-activated glycogen Synthase kinase 3β Aggravates liver inflammation and Hepatotoxicity in mice with Acute liver Failure. Inflammation, 38(3), 1151–1165. doi: 10.1007/s10753-014-0080-2
- Shen, R. L., Zhang, W. L., Dong, J. L., Ren, G. X., & Chen, M. (2015). Sorghum resistant starch reduces adiposity in high-fat diet-induced overweight and obese rats via mechanisms involving adipokines and intestinal flora. Food and Agricultural Immunology, 26(1), 120–130. doi: 10.1080/09540105.2013.876976
- Sirjani, M., Taleban, F. A., Hekmatdoost, A., Amiri, Z., Pellizzon, M., Hedayati, M., … Pourpak, Z. (2014). The effects of high fat, low carbohydrate and low fat, high carbohydrate diets on tumor necrosis factor superfamily proteins and proinflammatory cytokines in C57BL/6 mice. Iranian Journal of Allergy, Asthma, and Immunology, 13(4), 247–255.
- Takao, T., Inoue, K., Suka, M., Yanagisawa, H., & Iwamoto, Y. (2018). Optimal cutoff values of fasting plasma glucose (FPG) variability for detecting retinopathy and the threshold of FPG levels for predicting the risk of retinopathy in type 2 diabetes: A longitudinal study over 27 years. Diabetes Research and Clinical Practice, 140, 228–235. doi: 10.1016/j.diabres.2018.03.051
- Tapia, G., Valenzuela, R., Espinosa, A., Romanque, P., Dossi, C., Gonzalez-Manan, D., … D'Espessailles, A. (2014). N-3 long-chain PUFA supplementation prevents high fat diet induced mouse liver steatosis and inflammation in relation to PPAR- alpha upregulation and NF- kappaB DNA binding abrogation. Molecular Nutrition and Food Research, 58(6), 1333–1341. doi: 10.1002/mnfr.201300458
- Zhang, M., Pan, L. J., Jiang, S. T., & Mo, Y. W. (2015). Protective effects of anthocyanins from purple sweet potato on acute carbon tetrachloride-induced oxidative hepatotoxicity fibrosis in mice. Food and Agricultural Immunology, 27(2), 1–14.