
ABSTRACT
Clothianidin (CTA), third generation neonicotinoid insecticide that has been widely used for the long-term control of a wide variety of pests. Therefore, we developed immunochromatographic assay for the detection of CTA residues in cucumber and apple juice. The antigen HCTA-EDC-OVA and the goat anti-mouse IgG antibody were added to a nitrocellulose membrane as the test and control lines, respectively. Under optimal conditions, the cut-off limits of the semi-quantitative strip test for CTA were 1 ng/mL in 0.01 M PBS (pH 7.4), 4 ng/mL in cucumber juice, and 5 ng/mL in apple juice, and the results were obtained within 5 min. The immunochromatographic assay can be used for the sensitive, rapid, and specific on-site screening of CTA residues in cucumber and apple juice.
Introduction
Neonicotinoids are a class of insecticides that are similar to nicotine which has been used since the late 1700s. In the past few decades, the use of neonicotinoids in crops during cultivation and post-harvest storage has increased considerably, affecting both food quality and safety (Gbylik-Sikorska, Sniegocki, & Posyniak, Citation2015) (Matsuda et al., Citation2001).
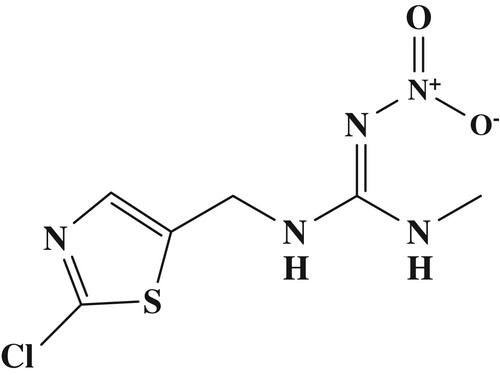
Clothianidin (CTA; ), a third-generation neoricotinoid insecticide has been widely used in vegetables and field crops for the long-term control of a wide variety of pests. CTA, which has excellent efficacy, is toxic and breaks down quickly in the environment. CTA acts on the central nervous system of insects as an agonist of acetylcholine, the neurotransmitter that stimulates nicotinic acetylcholine receptors (nAChR). Specifically, CTA targets the acetycholine receptor (AChR) and active post-synaptic AChR without inhibiting acetylcholinesterase (AChE) (Tomizawa & Casida, Citation2005) (Uneme, Citation2011).
Figure 1. Chemical structure of clothianidin
There is a growing need for fast and simple CTA detection method. Currently, the available CTA instrument-based detection methods include gas chromatography (Li et al., Citation2012), high performance liquid chromatography (Valverde, Ares, Bernal, Nozal, & Bernal, Citation2017) (Valverde, Maria Ares, Luis Bernal, Jesus Nozal, & Bernal, Citation2018), and liquid chromatography- mass spectrometry (Abdel-Ghany, Hussein, El Azab, El-Khatib, & Linscheid, Citation2016) (Adelantado, Rios, & Zougagh, Citation2018). These chromatographic methods for fungicides residue analysis require both extraction and clean-up procedures. Therefore these methods need a large amount of organic solvents, and are very time-consuming and expensive due to their long clean-up and running procedures (Hao, Suryoprabowo, Song, Liu, & Kuang, Citation2018) (Mukunzi, Suryoprabowo, Song, Liu, & Kuang, Citation2018) (Song et al., Citation2019).
Immunoassays have been widely used as a screening tool in a variety of applications. Polyclonal antibody-based enzyme-linked immunosorbent assays have been applied to the determination of CTA (Li, Sheng, Cong, & Wang, Citation2013). Enzyme-linked immunosorbent assays (ELISAs) are useful when large numbers of samples are tested, due to their high specificity, simple sample preparation steps, and cost-effectiveness. However, these assays are time consuming due to the incubation time required for enzyme–substrate reactions. Furthermore, they are not suitable for on-site applications. However, lateral-flow immunochromatographic assays (LFIAs) are increasingly popular for detecting residues because they are simple, rapid, specific, and sensitive. In lateral-flow immunochromatographic assays all the reagents are included in the strip, and the results can be obtained within 5–10 min (Isanga et al., Citation2017) (Kong et al., Citation2017) (Lei, Xu, Song, Liu, & Kuang, Citation2018) (Li, Liu, Song, & Kuan, Citation2018) (Liu, Xu, Suryoprabowo, Song, & Kuang, Citation2018) (Zeng, Jiang, Liu, Song, & Kuang, Citation2018).
CTA residues in environmental and agricultural samples have been detected using rapid, sensitive enzyme-linked immunosorbent assay and gold immunochromatographic assay (Li et al., Citation2014). However, no studies have used LFIA to evaluate the presence of CTA residues in cucumber and apple samples. The aim of this study was to develop a LFIA for the detection of CTA in cucumber and apple juice samples.
Material and methods
Chemicals and reagents
CTA was purchased from J&K Scientific (Shanghai, China). Complete Freund’s adjuvant (FCA), incomplete Freund’s adjuvant (FIA), and enzyme immunoassay-grade horseradish peroxidase (HRP)-labeled goat anti-mouse immunoglobulin were obtained from Sigma-Aldrich (St. Louis, MO, USA). Gelatin was supplied by Beijing Biodee Biotechnology Co., Ltd. (Beijing, China). Tetramethylbenzidine and HRP were acquired from Aladdin Chemistry Co., Ltd. (Shanghai, China). All reagents for cell fusion were purchased from Sunshine Biotechnology Co., Ltd. (Nanjing, China). Keyhole-limpet hemocyanin (KLH) and ovalbumin (OVA) were obtained from Solarbio Science & Technology, Co., Ltd. (Beijing, China). All other reagents and chemicals were supplied by the National Pharmaceutical Group Chemical Reagent Co., Ltd. (Shanghai, China).
Nitrocellulose (NC) high-flow plus membranes (Pura-bind RP) were obtained from Whatman-Xinhua Filter Paper Co., Ltd. (Hangzhou, China). Glass fibre membrane (CB-SB08) used for the sample pad, polyvinylchloride (PVC) backing material, and absorbance pad (SX18), were supplied by Goldbio Tech Co., Ltd. (Shanghai, China). The conjugated coating antigens (HCTA-EDC-OVA) and specific monoclonal antibody (anti-CTA mAb) were produced in our laboratory.
All buffer solutions were prepared using ultrapure water (Milli-Q Purification System, Millipore Co., Bedford, MA, USA). The strip-cutting instrument was a CM-4000 Guillotine Cutting System from Gene, Shanghai, China, and the dispensers were Airjet Quanti 3000TM and Biojet Quanti 3000TM (XinqidianGene Technology Co., Ltd., Beijing, China).
Preparation and characterization of anti-CTA mAb
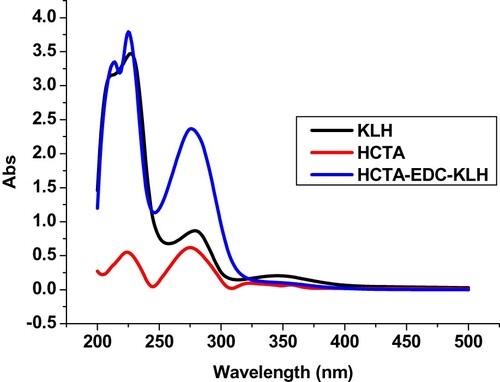
In this study we have designed a new hapten of CTA which the structure of the Hapten-CTA was confirmed by LC-MS (Fig. S1) and NMR spectrometry (Fig. S2). Hapten-CTA (HCTA; Fig. S3) was conjugated to OVA and KLH using the ester method (Suryoprabowo, Liu, Peng, Kuang, & Xu, Citation2015). Carboxyl-reactive carbodiimide cross linker (1-ethyl-3-[3-dimethylaminopropyl]carbodiimide hydrochloride; EDC, 2.5 mg) and N-hydroxysuccinimide (NHS, 1.5 mg) were diluted with 2-morpholinoethanesulfonic acid (MES, 100 µL). We added hapten-CTA (1.5 g) to N,N-dimethyl formamide (DMF, 300 µL). NHS was stirred for 10 min, added to EDC, and stirred for 4–6 h. KLH (5 mg) was diluted with 1 mL buffer solution (BB) at room temperature, and stirred continuously overnight. HCTA-EDC-KLH was dialysed against distilled water for 3 d and against 0.01 M PBS for a further 3 d. Ultraviolet absorption was used to determine the conjugation of protein and HCTA ().
Figure 2. The UV spectra characterisation for HCTA, KLH, and HCTA-EDC-KLH
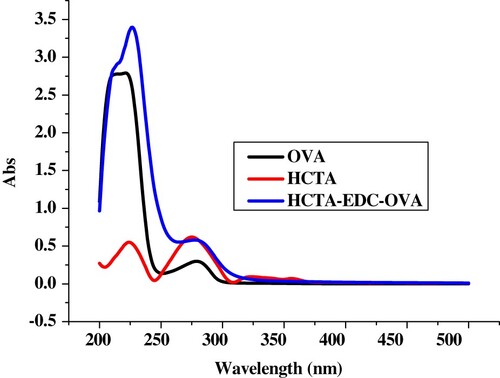
Carboxyl-reactive carbodiimide cross linker (1-ethyl-3-[3-dimethylaminopropyl]carbodiimide hydrochloride) (EDC, 8 mg) and N-hydroxysuccinimide (NHS, 5 mg) were diluted with 2-morpholinoethanesulfonic acid (MES, 100 µL). Hapten-CTA (1.5 g) was added to N,N-dimethyl formamide (DMF, 300 µL). NHS was stirred for 10 min, added to EDC and stirred for 4–6 h. OVA (10 mg) was diluted with 2 mL of buffer solution (BB) at room temperature, and stirred continuously overnight. HCTA-EDC-OVA was dialysed against distilled water for 3 d and against 0.01 M PBS for 3 d. Ultraviolet absorption was used to determine the conjugation of protein and HCTA ().
Figure 3. The UV spectra characterisation for HCTA, OVA, and HCTA-EDC-OVA
In this study, we used female BALB/c mice (6–8 weeks of age) to produce anti-CTA monoclonal antibody (mAb). The mice were immunised subcutaneously with HCTA-EDC-KLH. FCA was used in the first immunisation, and FIA was used in subsequent immunizations. The mice were immunised every three weeks with 100 µg for the first immunisation and 50 µg subsequent immunizations (two to five times). Blood samples from mice were analysed by ELISA. The mouse with the highest titre was sacrificed and its splenocytes were fused with Sp 2/0 murine myeloma cells. The hybridomas were screened by indirect ELISA. The selected hybridoma cells were expanded and injected into BALB/c mice to produce mAbs (Deng et al., Citation2012) (Suryoprabowo, Liu, Peng, Kuang, & Xu, Citation2014). The ascites were harvested and purified using the caprylic acid-ammonium sulfate precipitation method (Kuang et al., Citation2013). The purified antibody solution was stored at −20°C until further use.
Development of LFIA
Preparation of colloidal gold particles
All solvents were prepared with ultrapure water and passed through a 0.22 µm membrane filter. Chlorauric acid (0.1 g/L; 25 mL) was heated to boiling under constant stirring and mixed with sodium citrate tribasic dihydrate (1% w/v; 1.0 mL) under constant stirring for 30 min. When the colour of the solution turned wine-red, it was allowed to cool to room temperature, and stored at 4°C. Analysis by transmission electron microscopy (TEM) revealed that the gold nanoparticles (GNPs) had a nearly uniform particle size of 15 nm (Fig. S4).
Preparation of colloidal gold-Labeled mAb
The half-maximal inhibitory concentration (IC50) of anti-CTA mAb (no.3G5; Fig. S5) was 0.357 ng/mL. The colloidal GNP solution (10 mL) was adjusted to pH 7.0 with 0.1 M K2CO3, and mAb (0.50 mL) was added to the solution dropwise. After 35 min, 10% (w/v) bovine serum albumin (BSA; 1 mL) was added, and the mixture was stirred for 2 h and centrifuged at 8,000 rpm for 45 min to remove any GNP aggregates. The solution separated into two layers; the lower layer (red gold-labeled mAb) was collected and washed with 0.02 M phosphate buffer containing 5% sucrose, 1% BSA, and 0.5% polyethylene glycol (PEG) 6000 (pH 7.4). The conjugation products were reconstituted to 1 mL with gold-labeled resuspension buffer (0.02 M PBS, 5% sucrose, 2% sorbitol, 1% mannitol, 0.1% PEG, 0.1% tween, and 0.04% NaN3) and stored at 4 °C.
Preparation of nitrocellulose capture membranes
Coating antigen and goat anti-mouse IgG antibody were used as the capture reagent in the control line on the test strip. The coating antigen and goat anti-mouse IgG antibody were sprayed onto the NC membrane at 1 µL/cm using a dispenser, resulting in the formation of the test and control lines, respectively. The capture and control reagents were sprayed onto the glass fibre membrane to prepare the conjugate pad, which was dried at 37°C for 2 h. The NC membrane coated with capture reagents was pasted onto the centre of the plastic PVC backing plate, and the conjugate pad, sample pad, and absorbent pad were laminated and pasted onto the plate. Finally the plate was cut into strips (2.9 mm-wide) using a strip cutter.
Test procedure and principle
Before the test, 50 µL of gold labelled mAb was mixed with 150 µL of sample solution, allowed to react for approximately 5 min, and added to the sample pad. The solution migrated to the absorbent pad, and the test results were obtained within 5 min. In CTA-positive samples, the analyte competes with HCTA-EDC-OVA conjugates embedded in the test line for the finite amount of anti-CTA mAb. When a sufficient amount of CTA is present, the free CTA binds to all of the labelled mAb, preventing mAb from binding to HCTA-EDC-OVA in the test line. Therefore, the more CTA in the sample, the weaker colour of the test line becomes. In CTA-negative samples, the limited amount of colloidal gold-labelled mAb is trapped by the immobilised HCTA-EDC-OVA conjugate, and a clearly visible red test line appears.
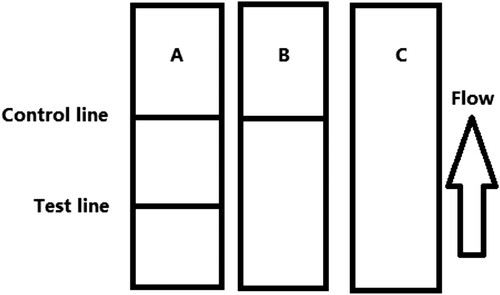
The flow of the sample must reach the control line, which contains goat anti-mouse IgG antibody. Therefore, the control line will always appear in a successful test, whereas the test line will only appear when the sample is analyte-negative (A). The appearance of the control line alone is a positive result (B). When, neither the control line nor the test line appears (C), the test procedure is considered invalid, and the test should be repeated with a new strip.
Figure 4. Illustration of typical strip test results. If the sample is negative (A), a positive result could be indicated only if the control line appears (B), and if the control and test line doesn’t appears (invalid) (C).
Evaluation of performance
Sensitivity of the test strip
The sensitivity of the test strip was determined by testing different CTA samples. A CTA standard was diluted to concentrations (0, 0.05, 0.1, 0.25, 0.5, and 1 ng/mL) in 0.01 M PBS (pH 7.4), and the detection limit was determined. Sample solution (150 µL) was mixed with 50 µL of gold labelled mAb, allowed to react for 5 min, and added to the sample pad. After 5 min, the test strip reader recorded the colour intensities of the different strips. The lowest detection limit (LDL) that could be detected with the naked eye was defined at the concentration of CTA that resulted in a strip colour that was clearly different in intensity from the result obtained with 0 ng/mL CTA. Six replicate samples for each concentration were analysed on the same day.
Detection of CTA in cucumber and apple juice samples
The detection of CTA in cucumber and apple samples was assessed using cucumbers and apples that purchased from a local market. The samples (40 g) were crushed, and only the liquid from the samples was tested. For the samples, a simple pretreatment was used, which involved diluting the apple juice five-fold and te cucumber juice four-fold in extraction buffer (0.01M PBST, pH 7.4, with 0.5% Tween-20). The samples were spiked with CTA standard solution (10 µg/mL, prepared with 0.01 M PBS, pH 7.4). The CTA concentrations in cucumber and apple juice samples were 0.05, 0.1, 0.25, 0.5, and 1 ng/mL. A blank (unspiked) sample was used as the control and six replicates of each concentration were analysed using the test strips.
Results and discussion
Optimisation of the immunochromatographic test strip
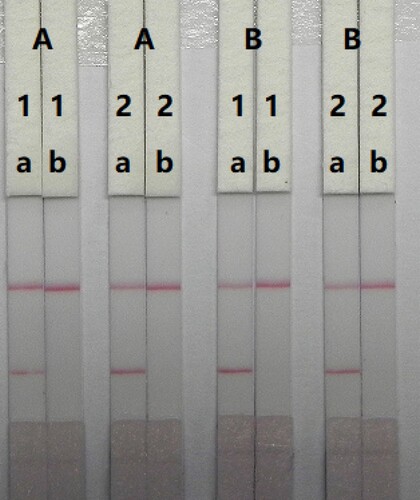
In LFIA, the strip materials must be hydrophilic and have consistent flow characteristics. NC must be hydrophobic; however it can be rendered hydrophilic with the addition of surfactants. The sensitivity of the immunochromatographic test strip is mainly affected by the coating antigens and GNP-mAbs. In this study, we synthesised the coating antigens. The concentration of mAbs in GNPs and coating antigen affect the sensitivity of the assay. Two different concentrations of mAbs (8 and 10 µg/mL) were allowed to react with CTA-negative samples (0 ng/mL) and CTA-positive samples (2.5 ng/mL). shows that there were slight differences in colour intensity between 8 and 10 µg/mL. We observed that the optimum concentration of mAb in GNP was 10 µg/mL based on the colour intensities on both lines (CTA-positive and CTA-negative samples). Additionally, there were slightly differences in colour intensity at 0.5 and 1 mg/mL coating antigen. At 0.5 mg/mL coating antigen, the colour intensity of the T line was weaker than at 1 mg/mL, suggesting that a more sensitive detection could be achieved at 1 mg/mL of coating antigen. Therefore, the optimum conditions for our assay were 1 mg/mL coating antigen and 10 µg/mL of mAb in GNP.
Figure 5. Optimisation of the immunochromatographic strip. Concentration of coating antigen (A) 0.5 mg/mL; (B) 1 mg/mL. The dosage of the mAb that add in GNP: (1) 8 µg/L; (2) 10 µg/L. The standard concentration: (a) 0 ng/mL; (b) 2.5 ng/mL.
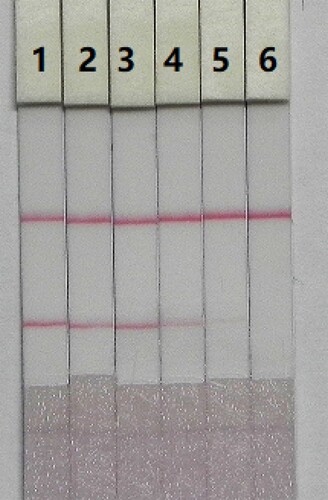
The sensitivity of the assay was determined using a serial dilution of CTA standards. LDL was defined as the CTA concentration that resulted in a clearly visible change in colour intensity of the test strip when compared to the negative control. shows that the colour intensity of the test line became weaker as CTA concentration decreased and finally disappeared completely at 1 ng/mL CTA in 0.01 M PBS (pH 7.4). The assay was tested by its ability to detect CTA at different concentrations (0, 0.05, 0.1, 0.25, 0.5, and 1 ng/mL) in 0.01 M PBS (pH 7.4). A strong colour was observed on the test line when samples were spiked with 0–0.1ng/mL CTA. However, the colour completely disappeared at 1 ng/mL CTA.
Figure 6. Colloidal gold immunochromatographic for CTA in 0.01 M PBS (pH 7.4). CTA concentration: 1 = 0 ng/mL; 2 = 0.05 ng/mL; 3 = 0.1 ng/mL; 4 = 0.25 ng/mL; 5 = 0.5 ng/mL; and 6 = 1 ng/mL.
Detection of CTA in cucumber and apple juice samples
One of the major advantages of the LFIA is that it is rapid and easy to use. CTA was detected in the juice obtained from 40 g of crushed cucumber and apple purchased at a local market. The juice was spiked with CTA standard solution (10 µg/mL, prepared with 0.01 M PBS, pH 7.4).
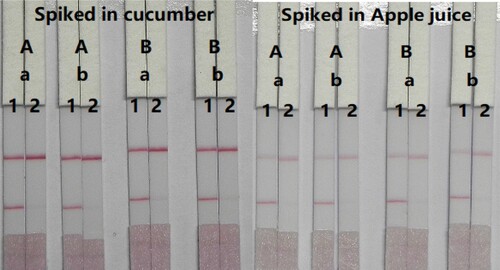
We optimised the concentration of mAbs in GNPs and coating antigen to determine CTA in cucumber and apple samples. A simple pretreatment was used, which involved diluting the apple juice five-fold and cucumber juice four-fold in extraction buffer. In cucumber samples, two different concentrations of mAbs (8 and 10 µg/mL) were allowed to react with CTA-negative samples (0 ng/mL) and CTA-positive samples (0.5 ng/mL). shows that there were slight differences in colour intensity between 8 and 10 µg/mL. We observed that the optimum concentration of mAb in GNP was 8 µg/mL based on the colour intensities on both lines (CTA-positive and CTA-negative samples). Additionally, there were slightly differences in colour intensity at 0.5 and 1 mg/mL of coating antigen. Therefore, the optimum conditions for our developed assay consisted of 0.5 mg/mL coating antigen and 8 µg/mL mAb in GNP. In apple samples, two different concentrations of mAbs (8 and 10 µg/mL) were allowed to react with CTA-negative samples (0 ng/mL) and CTA-positive samples (2 ng/mL). shows that there were significant differences in colour intensities between 8 and 10 µg/mL. We observed that the optimum concentration of mAb in GNP was 8 µg/mL based on the colour intensities on both lines (CTA-positive and CTA-negative samples). Additionally, there were slight differences in colour intensity at 0.5 and 1 mg/mL of coating antigen. Therefore, the optimum conditions for our developed assay consisted of 0.5 mg/mL coating antigen and 8 µg/mL mAb in GNP.
Figure 7. Optimisation result of CTA spiked in cucumber and apple. Spiked in cucumber, concentration of coating antigen (A) 0.5 mg/mL; (B) 1 mg/mL. The dosage of the mAb that add in GNP: (a) 8 µg/mL; (b) 10 µg/mL. The standard concentration: (1) 0 ng/mL; (2) 1 ng/mL. Spiked in apple juice, Concentration of coating antigen (A) 0.5 mg/mL; (B) 1 mg/mL. The dosage of the mAb that add in GNP: (a) 8 µg/mL; (b) 10 µg/mL. The standard concentration: (1) 0 ng/mL; (2) 1 ng/mL.
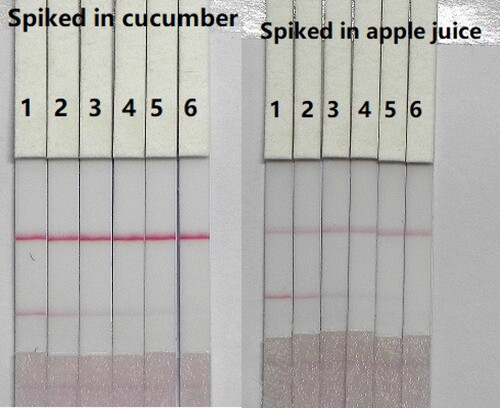
These spiked samples were prepared and analysed using the optimised test strips. The final concentration of CTA in cucumber and apple juice were 0.05, 0.1, 0.25, 0.5, and 1 ng/mL. The results are summarised in . The colour intensity decreased as the CTA concentration increased and the signal colour on the test lines changed from strong to weak with increasing CTA and disappeared completely at 1 ng/mL in cucumber (4-fold diluted) and apple (5-fold diluted). Therefore the cut-off values were 4 ng/mL for cucumber and 5 ng/mL for apple.
Figure 8. Result of CTA spiked in cucumber and apple juice. CTA standard concentration: 1 = 0 ng/mL; 2 = 0.05 ng/mL; 3 = 0.1 ng/mL; 4 = 0.25 ng/mL; 5 = 0.5 ng/mL; and 6 = 1 ng/mL in cucumber and apple juice.
Conclusions
In this study, we developed a simple, rapid, and sensitive LFIA for the detection of CTA. Additionally, we produced a sensitive anti-CTA mAb 3G5 (IC50 = 0.357 ng/mL) and sensitive immunogen (CTA-EDC-OVA). Our results shown that the cut-off limits of the semi-quantitative test strip for CTA were 1 ng/mL in 0.01 M PBS pH 7.4, 4 ng/mL in cucumber juice, and 5 ng/mL in apple juice samples. The results were obtained within 5 min. In summary, the LFIA can be used for the detection of CTA in 0.01 M PBS, cucumber, and apple.
Supplemental Material
Download ()Disclosure statement
No potential conflict of interest was reported by the authors.
Additional information
Funding
Related Research Data
References
- Abdel-Ghany, M. F., Hussein, L. A., El Azab, N. F., El-Khatib, A. H., & Linscheid, M. W. (2016). Simultaneous determination of eight neonicotinoid insecticide residues and two primary metabolites in cucumbers and soil by liquid chromatography-tandem mass spectrometry coupled with QuEChERS. Journal of Chromatography B-Analytical Technologies in the Biomedical and Life Sciences, 1031, 15–28. doi: 10.1016/j.jchromb.2016.06.020
- Adelantado, C., Rios, A., & Zougagh, M. (2018). Magnetic nanocellulose hybrid nanoparticles and ionic liquid for extraction of neonicotinoid insecticides from milk samples prior to determination by liquid chromatography-mass spectrometry. Food Additives and Contaminants Part a-Chemistry Analysis Control Exposure & Risk Assessment, 35(9), 1755–1766.
- Deng, X., Liu, L., Ma, W., Xu, C., Wang, L., & Kuang, H. (2012). Development and validation of a sandwich ELISA for quantification of peanut agglutinin (PNA) in foods. Food and Agricultural Immunology, 23(3), 265–272. doi: 10.1080/09540105.2011.617358
- Gbylik-Sikorska, M., Sniegocki, T., & Posyniak, A. (2015). Determination of neonicotinoid insecticides and their metabolites in honey bee and honey by liquid chromatography tandem mass spectrometry. Journal of Chromatography B-Analytical Technologies in the Biomedical and Life Sciences, 990, 132–140. doi: 10.1016/j.jchromb.2015.03.016
- Hao, K., Suryoprabowo, S., Song, S., Liu, L., & Kuang, H. (2018). Rapid detection of zearalenone and its metabolite in corn flour with the immunochromatographic test strip. Food and Agricultural Immunology, 29(1), 498–510. doi: 10.1080/09540105.2017.1406461
- Isanga, J., Mukunzi, D., Chen, Y., Suryoprabowo, S., Liu, L., Kuang, H., & Xu, C. (2017). Development of a monoclonal antibody assay and a lateral flow strip test for the detection of paromomycin residues in food matrices. Food and Agricultural Immunology, 28(3), 355–373. doi: 10.1080/09540105.2016.1272551
- Kong, D., Xie, Z., Liu, L., Song, S., Kuang, H., & Xu, C. (2017). Development of ic-ELISA and lateral-flow immunochromatographic assay strip for the detection of vancomycin in raw milk and animal feed. Food and Agricultural Immunology, 28(3), 414–426. doi: 10.1080/09540105.2017.1293014
- Kuang, H., Xing, C., Hao, C., Liu, L., Wang, L., & Xu, C. (2013). Rapid and highly sensitive detection of lead ions in drinking water based on a strip immunosensor. Sensors, 13(4), 4214–4224. doi: 10.3390/s130404214
- Lei, X., Xu, L., Song, S., Liu, L., & Kuang, H. (2018). Development of an ultrasensitive ic-ELISA and immunochromatographic strip assay for the simultaneous detection of florfenicol and thiamphenicol in eggs. Food and Agricultural Immunology, 29(1), 254–266. doi: 10.1080/09540105.2017.1371114
- Li, M., Hua, X., Ma, M., Liu, J., Zhou, L., & Wang, M. (2014). Detecting clothianidin residues in environmental and agricultural samples using rapid, sensitive enzyme-linked immunosorbent assay and gold immunochromatographic assay. Science of the Total Environment, 499, 1–6. doi: 10.1016/j.scitotenv.2014.08.029
- Li, L., Jiang, G., Liu, C., Liang, H., Sun, D., & Li, W. (2012). Clothianidin dissipation in tomato and soil, and distribution in tomato peel and flesh. Food Control, 25(1), 265–269. doi: 10.1016/j.foodcont.2011.10.046
- Li, Y., Liu, L., Song, S., & Kuan, H. (2018). Development of a gold nanoparticle immunochromatographic assay for the on-site analysis of 6-benzylaminopurine residues in bean sprouts. Food and Agricultural Immunology, 29(1), 14–26. doi: 10.1080/09540105.2017.1354359
- Li, M., Sheng, E., Cong, L., & Wang, M. (2013). Development of Immunoassays for detecting clothianidin residue in agricultural products. Journal of Agricultural and Food Chemistry, 61(15), 3619–3623. doi: 10.1021/jf400055s
- Liu, L., Xu, L., Suryoprabowo, S., Song, S., & Kuang, H. (2018). Development of an immunochromatographic test strip for the detection of ochratoxin A in red wine. Food and Agricultural Immunology, 29(1), 434–444. doi: 10.1080/09540105.2017.1401043
- Matsuda, K., Buckingham, S. D., Kleier, D., Rauh, J. J., Grauso, M., & Sattelle, D. B. (2001). Neonicotinoids: Insecticides acting on insect nicotinic acetylcholine receptors. Trends in Pharmacological Sciences, 22(11), 573–580. doi: 10.1016/S0165-6147(00)01820-4
- Mukunzi, D., Suryoprabowo, S., Song, S., Liu, L., & Kuang, H. (2018). Development of an indirect enzyme-linked immunosorbent assay and lateral-flow test strips for pefloxacin and its analogues in chicken muscle samples. Food and Agricultural Immunology, 29(1), 484–497. doi: 10.1080/09540105.2017.1406460
- Song, S., Suryoprabowo, S., Liu, L., Zheng, Q., Wu, X., & Kuang, H. (2019). Development of an immunochromatographic strip test for rapid detection of sodium nifurstyrenate in fish. Food and Agricultural Immunology, 30(1), 236–247. doi: 10.1080/09540105.2019.1571566
- Suryoprabowo, S., Liu, L. Q., Peng, J., Kuang, H., & Xu, C. L. (2014). Development of a broad specific monoclonal antibody for fluoroquinolone analysis. Food Analytical Methods, 7(10), 2163–2168. doi: 10.1007/s12161-014-9863-1
- Suryoprabowo, S., Liu, L. Q., Peng, J., Kuang, H., & Xu, C. L. (2015). Antibody for the development of specific immunoassays to detect nadifloxacin in chicken muscles. Food and Agricultural Immunology, 26(3), 317–324. doi: 10.1080/09540105.2014.914469
- Tomizawa, M., & Casida, J. E. (2005). Neonicotinoid insecticide toxicology: Mechanisms of selective action. Annual Review of Pharmacology and Toxicology, 45, 247. doi: 10.1146/annurev.pharmtox.45.120403.095930
- Uneme, H. (2011). Chemistry of clothianidin and Related Compounds. Journal of Agricultural and Food Chemistry, 59(7), 2932–2937. doi: 10.1021/jf1024938
- Valverde, S., Ares, A. M., Bernal, J. L., Nozal, M. J., & Bernal, J. (2017). Simultaneous determination of thiamethoxam, clothianidin, and metazachlor residues in soil by ultrahigh performance liquid chromatography coupled to quadrupole time-of-flight mass spectrometry. Journal of Separation Science, 40(5), 1083–1090. doi: 10.1002/jssc.201601143
- Valverde, S., Maria Ares, A., Luis Bernal, J., Jesus Nozal, M., & Bernal, J. (2018). Fast determination of neonicotinoid insecticides in beeswax by ultra-high performance liquid chromatography-tandem mass spectrometry using an enhanced matrix removal-lipid sorbent for clean-up. Microchemical Journal, 142, 70–77. doi: 10.1016/j.microc.2018.06.020
- Zeng, L., Jiang, W., Liu, L., Song, S., & Kuang, H. (2018). Development of ic-ELISA and lateral-flow immunochromatographic strip for detection of vitamin B-2 in an energy drink and vitamin tablets. Food and Agricultural Immunology, 29(1), 121–132. doi: 10.1080/09540105.2017.1360257