
ABSTRACT
β-Conglycinin and glycinin are known to induce various allergic reactions, however, but little is known about the mechanism underlying the development of allergy to soybean antigen proteins. In this study, porcine intestinal epithelial cells (IPEC-J2) were used to investigate the effects of soybean antigen proteins, β-conglycinin and glycinin, on cells to determine whether the caspase-3/mitochondrion-regulated apoptotic pathway underlies the allergic reaction. IPEC-J2 cells were treated with different concentrations (0, 5, and 10 mg mL−1) of β-conglycinin or glycinin, and 50 μM z-DEVD-FMK (a caspase-3 inhibitor). The results show that the apoptosis rate, mitochondrion-regulated mRNA and protein expression levels, caspase-3 activation, cyt-c release, cytoskeleton and tight junction protein expression, mitochondrial membrane potential depolarization and mitochondrial injury were significantly aggravated with cultured in increasing concentrations of β-conglycinin or glycinin. While these effects were inhibited by application of the caspase-3 inhibitor. Thus, we concluded that β-conglycinin and glycinin cause IPEC-J2 cell apoptosis via the caspase-3/mitochondrion-regulated apoptotic pathway.
Introduction
Soybean is a source of high-quality protein owing to its relatively well-balanced amino acid composition (Friedman & Brandon, Citation2001; Hancock, Cao, Kim, & Li, Citation2000). However, soybean is also a source of dietary allergies in humans and other animals (Hancock et al., Citation2000; Qiao et al., Citation2003; Qin et al., Citation2002; Wu et al., Citation2016a; Zhao, Qin, Sun, Zhang, & Wang, Citation2010). Soybean antigen protein is the major sensitizing ingredient in soybeans and can be categorized as 2S, 7S, and 11S (Catsimpoolas & Ekenstam, Citation1969). Both 7S (β-conglycinin; Gly m 5) and 11S globulins (glycinin; Gly m 6) are major allergens that cause systemic reactions in patients (Adachi et al., Citation2009; Holzhauser et al., Citation2009; Krishnan, Kim, Jang, & Kerley, Citation2009; Saeed, Gagnon, Cober, & Gleddie, Citation2016). Sun, Li, Li, Dong, and Wang (Citation2008) investigated the mechanism of glycinin-induced hypersensitivity in piglets. Their results indicated that piglets had reduced performance, with more frequent occurrence of diarrhea and a larger erythematous area, 0.5 h after an intradermal injection of glycinin. Our previous study analysed the effects of soybean antigen proteins on production performance, immune function, and intestinal function of piglets, and found that β-conglycinin and glycinin cause intestinal function damage via the NF-κB, JNK, and p38 pathways (Peng et al., Citation2018; Wu et al., Citation2016a, Citation2016b). However, the underlying mechanism of the mitochondrial-regulated apoptotic pathway remains to be studied. An understanding of this mechanism is important to gain a better understanding of soybean allergies.
The B-cell lymphoma 2 (Bcl-2) family proteins play an important role in the mitochondrion-regulated apoptotic pathway, which mainly includes pro-apoptotic and inhibitory factors (Adams & Cory, Citation2007), such as multidomain type Bcl-2-associated X protein (Bax) and Bcl-2-associated killer (Bak) that play an essential role in mitochondria-induced cell death (Hotchkiss, Strasser, McDunn, & Swanson, Citation2009; Tomiyama et al., Citation2010). Bcl-2 is an important anti-apoptotic protein (Pan et al., Citation2018), and several kinases, such as ERK1/2, p38-MAPK, and JNK, are known to phosphorylate Bcl-2 (Mc Gee et al., Citation2004; Rosini et al., Citation2000). Our previous research have confirmed that soybean antigenic proteins cause changes in MAPK pathway-related proteins such as p-ERK1/2, p-p38 and p-JNK (Peng et al., Citation2019). Bcl-2 inhibits apoptosis by regulating the release of cytochrome c (cyt-c) and other proteins from mitochondria, whereas Bax promotes cell death by permeabilizing the outer mitochondrial membrane (Dlugosz et al., Citation2006). The expression of Bcl-2 and Bax is directly related to the regulation of apoptosis. The ratio of Bcl-2 to Bax determines whether a cell inhibits or accelerates apoptosis after stimulation (Adams & Cory, Citation2007; Neuzil, Wang, Dong, Low, & Ralph, Citation2006). Generally, mitochondrial release of cyt-c functions as an electron donor for cyt-c oxidase. However, during the early stages of apoptosis, it is also released from the mitochondria into the cytoplasm, where it helps activate caspase-3 (Martinou, Desagher, & Antonsson, Citation2000). Apoptosis is one of the built-in defense mechanisms of cells, and plays an important role in the normal development of bacteria and disease resistance. Abnormalities in apoptotic processes and pathways can lead to a variety of diseases, including tumours.
We hypothesized that soybean antigen protein might induce cell apoptosis via mitochondrial-regulated apoptotic pathway. IPEC-J2 cells obtained from the jejunum retain most of their original epithelial nature (Mariani, Palermo, Fiorentini, Lanubile, & Giuffra, Citation2009). Therefore, in this study, we aimed to investigate the effects of β-conglycinin and glycinin on animals using IPEC-J2 cells as a cell model. Our findings are expected to provide insights into the mechanisms of allergic reactions induced by soybean proteins.
Experimental methods
Preparation of β-conglycinin and glycinin
The β-conglycinin and glycinin were gifted by Professor Shuntang Guo of the College of Food Science and Nutritional Engineering of China Agricultural University (patent no.: 200,410,029,589.4, China). The purity of β-conglycinin and glycinin was 90% and 90.6%, respectively.
Cell line and culture conditions
IPEC-J2 cells (China Center for Type Culture Collection, Wuhan, China) were cultured in RPMI 1640 medium (Thermo Fisher Scientific, MA) supplemented with 10% foetal bovine serum (Clark Bioscience, Richmond, VA, USA), 100 U mL−1 penicillin, and 100 µg mL−1 streptomycin at 37°C with 5% CO2 in a humidified incubator; the medium was changed every day.
Experimental design
Cells were suspended into 96/6/24-well plates. After a 24-h period of stabilization, fresh cells without any treatment were defined as the control group. Cells were cultured with different concentrations of β-conglycinin or glycinin alone or in combination with 50 μM z-DEVD-FMK (caspase-3 inhibitor) and divided into eight groups: A (0 mg mL−1 β-conglycinin), B (5 mg mL−1 β-conglycinin), C (10 mg mL−1 β-conglycinin), D (10 mg mL−1 β-conglycinin + caspase-3 inhibitor), E (0 mg mL−1 glycinin), F (5 mg mL−1 glycinin), G (10 mg mL−1 glycinin), and H (10 mg mL−1 glycinin + caspase-3 inhibitor). Mitochondrial and cytosolic extracts were used to determine mito-cyt-c and cyto-cyt-c expression, respectively.
Mitochondria and cytosolic extracts
Intact mitochondria were isolated from the cultured cells using mitochondrial isolation kit (Beyotime, Shanghai, China). The cell pellet was gently resuspended in ice-cold pre-cooled phosphate-buffered saline (PBS), and a small amount of cells were taken for counting. The remaining cells (600 g) were pelleted by centrifugation at 4°C for 5 min, after which the supernatant was discarded. Then, the cell pellet was gently suspended in 1–2.5 mL of mitochondrial separation reagent, followed by incubation on ice for 10–15 min. The cell homogenate was centrifuged at 1000×g for 10 min at 4°C to collect the precipitate (mitochondria fraction), and the remaining supernatant was centrifuged again at 12,000×g for 10 min at 4°C to obtain the supernatant (cytosol fraction).
Cell viability and alkaline phosphatase activity
Cell viability was detected by the Cell Counting Kit 8 (CCK-8) (Dojindo Molecular Technologies, Kumamoto, Japan). First, cells were suspended in 96-well plates at 2 × 10³ cells per well. After treatments for 24 h, cells were cultured in medium containing 10% CCK-8 reagent for another 1 h. Optical density (OD) was measured at 450 nm using the Multiskan MS plate reader (Thermo Fisher Scientific).
A break in the integrity of the plasma membrane was assessed by measuring the activity of alkaline phosphatase in the supernatant. IPEC-J2 cells, suspended in a 96-well microplate, were treated with β-conglycinin or glycinin for 24 h. Changes in the alkaline phosphatase activity were measured using the alkaline phosphatase test kit provided by Jiancheng (Nanjing, China).
Hematoxylin–eosin staining of IPEC-J2 cells
After different pretreatments, IPEC-J2 cells were seeded on slides and washed thrice with PBS, fixed with 4% polyoxymethylene for 30 min, and then washed thrice with PBS for 1 min each. Cells were stained with a standard hematoxylin for 3 min, and then washed under running tap water for ∼5 min. Cells were placed in 1% glacial acetic acid, washed under running tap water for ∼1 min, stained in eosin-phloxine solution for 1 min, and then dehydrated in absolute ethanol. Cells were observed using an optical microscope.
Immunofluorescence to detect cytoskeleton and ZO-1 protein in IPEC-J2 cells
To determine the expression and location of the cytoskeletal protein F-actin, cells were analysed by immunofluorescence. IPEC-J2 cells were cultured until confluence was reached. After treatment with soybean antigen protein or caspase-3 inhibitor, the cells were washed thrice with PBS, fixed with 4% polyoxymethylene for 30 min, and then again washed thrice with PBS. Cells were treated with 0.5% Triton X-100 for 10 min, 0.5% bovine serum albumin (BSA) for 30 min, and then incubated with FITC-phalloidin (Abcam, Cambridge, UK) for 1 h for F-actin staining. Cells were cultured with the primary antibodies at 4°C for 16 h. Slides were then washed thrice with PBS and incubated with the FITC-conjugated secondary antibody (dilution 1:100; E-AB-1016). Cell nuclei were stained with DAPI (Abcam, Cambridge, UK). Slides were observed using a fluorescence microscope (Olympus, Tokyo, Japan).
Detection of apoptosis by flow cytometry
Quantitative analysis of IPEC-J2 cell apoptosis was performed with the Annexin V-FITC apoptosis detection kit (BD Biosciences Clontech, CA, USA). After treatment, cells were harvested, washed thrice, and incubated with 5 μL of Annexin V-FITC for 15 min at 35°C and then with propidium iodide for 10 min. All procedures were performed in the dark. Signal was detected using flow cytometry (BD Biosciences) and data were analysed using FlowJo software.
Determination of relative mRNA expression levels using quantitative real-time PCR (qRT-PCR)
Total RNA was isolated from cultured IPEC-J2 cells using Trizol reagents (Thermo Scientific, USA) as described by Zhang et al. (Citation2018). Next, 200 μL of chloroform was added to the sample, which was then shaken 20 times and centrifuged at 12,000×g for 15 min. The supernatant was discarded and 500 µL of 80% ethanol was added. After centrifugation at 7500×g for 5 min, the supernatant was discarded. RNA concentration was determined using a NanoVue Plus instrument (Thermo Scientific, USA). For each sample, 500 ng of total RNA was reverse transcribed (AT341, TransGen, China) and qRT-PCR was carried out using an Arktik thermal cycler (Thermo Scientific, USA). Primer sets for qRT-PCR are shown in .
Table 1. Primer sequences for qRT-PCR Amplification.
Determination of caspase-3, TNF-α, IFN-α, and IL-4 levels in IPEC-J2 cells using enzyme-linked immunosorbent assays (ELISA)
ELISA was performed to measure the caspase-3, TNF-α, IFN-α, and IL-4 expression levels. Cytokine levels were evaluated after treatment of IPEC-J2 cells with β-conglycinin and glycinin (Nanjing SenBeiJia Biological Technology, Nanjing, China). OD was measured using a microplate reader (Multiskan MK3) at 450 nm. Cytokine concentration in each group was evaluated using a standard curve.
Determination of mitochondrion-regulated protein expression levels by western blotting
After treatment, total cellular protein was isolated and separated using polyacrylamide gel electrophoresis (Bio-Rad, Hercules, CA, USA), and then electroblotted (Bio-Rad) onto a polyvinylidene fluoride membrane (Millipore, Temecula, CA, USA). The membrane was blocked with 5% BSA for 4 h at 26°C, and then the membrane with the blotted proteins were incubated with appropriately diluted anti-cle-caspase-3 (Affbiotech, AF7022), anti-caspase-3 (Affbiotech, AF6311), anti-cyt-c (Novusbio, NBP2-21569), anti-Bax (Proteintech, 50599-2-lg), anti-Bak (LSBio, LS-B3269), anti-Bcl-2 (Proteintech, 12789-1-AP), anti-Bcl-xl (Proteintech, 10783-1-AP), and anti-β-actin (Absin, abs132001) antibodies for 16 h. After washing three times with Tris-buffered saline containing 0.05% Tween-20 (TBST), the membrane was incubated with 1:5000 diluted rabbit anti-pig IgG secondary antibody (Beijing Biosynthesis Biotechnology, Beijing, China) for 45 min at 26°C. The membrane was then washed thrice in TBST and the proteins were detected by Gel imaging system (Bio-Rad).
Mitochondrial membrane potential (MMP) analysis
We used JC-1 to investigate MMP changes in cells after treatment with β-conglycinin or glycinin. After treatment, IPEC-J2 cells were incubated with 10 µg mL−1 JC-1 for 20 min in a humidified incubator. The fluorescence intensity in the treated cells was detected using a laser scanning confocal microscope. After treatment, cells were also incubated with the JC-1 probe and evaluated using a flow cytometer (BD Biosciences).
Transmission electronic microscopy (TEM)
TEM was applied to observe the ultrastructural damage in the mitochondria. The samples were fixed for 1 h at 4°C in 2.5% (w/v) glutaraldehyde diluted in cacodylate buffer. After fixation, samples were washed in sodium cacodylate (0.1 M, pH 7.4) and CaCl2 buffer (3 mM), then post-fixed with 1% osmium tetroxide in buffer for 30 min and en bloc stained in 2% uranyl acetate overnight at 0°C. TEM experiments were carried out as described in our previous study (Peng et al., Citation2019).
Data analysis
All values are given as mean ± SEM. All data were analysed by analysis of variance (ANOVA) to illustrate differences between each group at three time points and among the four groups using SPSS v20 (SPSS, Chicago, IL, USA). A P value of 0.05 or less was considered as a statistically significant difference. Histograms were generated using GraphPad Prism version 7 (La Jolla, CA, USA).
Results
Effects of β-conglycinin or glycinin on cell viability and alkaline phosphatase activity
The viability of IPEC-J2 cells treated with β-conglycinin or glycinin is shown in (a,b). Cell viability was significantly decreased in groups B and C (P < 0.01) compared with that in group A, and significantly increased in group D compared with that in group C (P < 0.01). Moreover, cell viability was significantly decreased in groups F and G (P < 0.01 or P < 0.05) compared with that in group E, and significantly increased in group H compared with that in group G (P < 0.01 or P < 0.05).
Figure 1. Effects of β-conglycinin or glycinin on IPEC-J2 cell viability and ALP activity. (a) Cell viability of IPEC-J2 cells measured by CCK-8 assay after treatment with β-conglycinin. (b) Cell viability of IPEC-J2 cells measured by CCK-8 assay after treatment with glycinin. The letters at the bottom of figures indicate that: A: control group; B: 5 mg mL−1 β-conglycinin group; C: 10 mg mL−1 β-conglycinin group; D: 10 mg mL−1 β-conglycinin + caspase-3 inhibitor group; E: control group; F: 5 mg mL−1 glycinin group; G: 10 mg mL−1 glycinin group; H: 10 mg mL−1 glycinin + caspase-3 inhibitor group. Different superscripts of lowercase letters indicate p < 0.05, different superscripts of uppercase letters indicate p < 0.01. ** p < 0.01 vs. group C or group G.
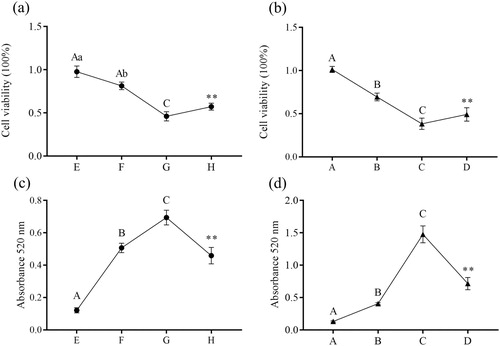
The alkaline phosphatase activity in culture supernatant is shown in (c,d). It was significantly increased in groups B and C (P < 0.01) compared with that in group A, and significantly decreased in group D compared with that in group C (P < 0.01). Moreover, the alkaline phosphatase activity was significantly increased in groups F and G (P < 0.01) compared with that in group E, and significantly decreased in group H compared with that in group G (P < 0.01).
Damage to IPEC-J2 cell morphology caused by β-conglycinin or glycinin
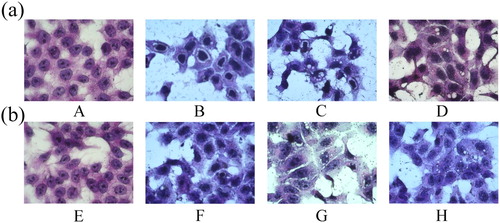
The morphology and density of IPEC-J2 cells changed considerably with increasing concentration of β-conglycinin or glycinin (). The main morphological differences in the treatment groups were decrease in cell number, presence of small vacuoles in cells, and shrinking of nucleus. Moreover, IPEC-J2 cells in groups B, C, F, and G showed cytoplasmic degradation, rarefaction, and cavitation, which were more severe in the groups C and G than in groups D and H.
Figure 2. Effects of β-conglycinin or glycinin on IPEC-J2 cell morphology. (a) IPEC-J2 cells treated with β-conglycinin, as revealed by HE staining. (b) IPEC-J2 cells treated with glycinin, as revealed by HE staining. The letters at the bottom of figures indicate that: A: control group; B: 5 mg mL−1 β-conglycinin group; C: 10 mg mL−1 β-conglycinin group; D: 10 mg mL−1 β-conglycinin + caspase-3 inhibitor group; E: control group; F: 5 mg mL−1 glycinin group; G: 10 mg mL−1 glycinin group; H: 10 mg mL−1 glycinin + caspase-3 inhibitor group.
Damage to the cytoskeleton and tight junction in IPEC-J2 cells due to β-conglycinin or glycinin
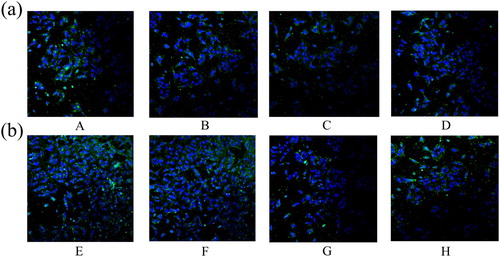
As shown in and , β-conglycinin or glycinin treatment damaged the cytoskeleton and tight junction of IPEC-J2 cells. These structures were severely damaged in groups B, C, F, and G, whereas those in groups D and H were only slightly damaged.
Figure 3. Damage of β-conglycinin or glycinin on the cytoskeleton of IPEC-J2 cells. (a) The cytoskeletal damage of IPEC-J2 cells was detected by immunofluorescence after treatment with β-conglycinin (b) The cytoskeletal damage of IPEC-J2 cells was detected by immunofluorescence after treatment with glycinin. The letters at the bottom of figures indicate that: A: control group; B: 5 mg mL−1 β-conglycinin group; C: 10 mg mL−1 β-conglycinin group; D: 10 mg mL−1 β-conglycinin + caspase-3 inhibitor group; E: control group; F: 5 mg mL−1 glycinin group; G: 10 mg mL−1 glycinin group; H: 10 mg mL−1 glycinin + caspase-3 inhibitor group.
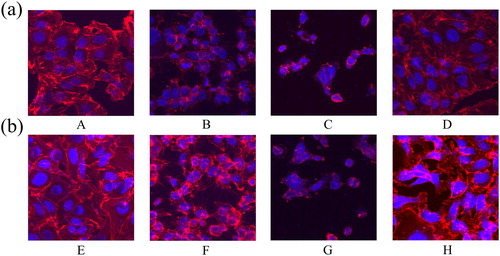
Figure 4. Effects of β-conglycinin or glycinin on ZO-1 protein expression. (a) The ZO-1 protein damage was detected by immunofluorescence after treatment with β-conglycinin. (b) The ZO-1 protein damage was detected by immunofluorescence after treatment with glycinin. The letters at the bottom of figures indicate that: A: control group; B: 5 mg mL−1 β-conglycinin group; C: 10 mg mL−1 β-conglycinin group; D: 10 mg mL−1 β-conglycinin + caspase-3 inhibitor group; E: control group; F: 5 mg mL−1 glycinin group; G: 10 mg mL−1 glycinin group; H: 10 mg mL−1 glycinin + caspase-3 inhibitor group.
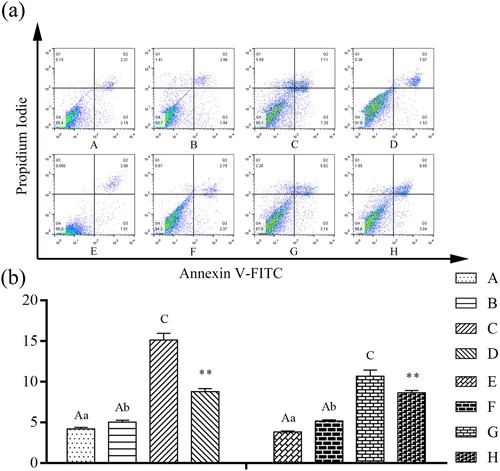
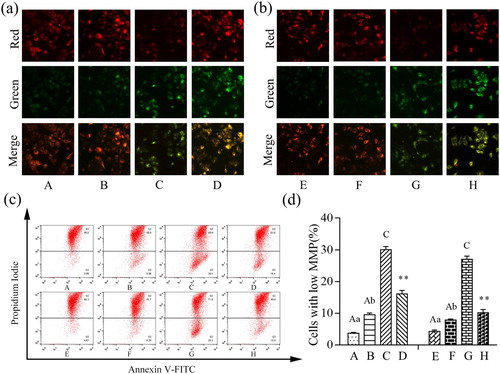
Effects of β-conglycinin or glycinin on IPEC-J2 cell apoptosis rate
Cells were treated with β-conglycinin or glycinin and the apoptosis rate was measured. As shown in , compared with group A, the apoptotic population of IPEC-J2 cells was significantly increased in group C (P < 0.01). In contrast to group C, group D showed significantly reduced apoptosis rate of cells (P < 0.01). Moreover, compared with group E, the apoptotic population of IPEC-J2 cells was significantly increased in groups F and G (P < 0.01 or P < 0.05). In contrast to group G, the apoptotic rate of IPEC-J2 cells was significantly decreased in group H (P < 0.01). Treatment with β-conglycinin or glycinin significantly increased the apoptotic population of IPEC-J2 cells, whereas the caspase-3 inhibitor significantly blocked β-conglycinin- and glycinin-induced apoptosis.
Figure 5. Detection of the proportion of apoptotic cells using AnnexinV-FITC/PI assay. (a) The representative images of AnnexinV-FITC/PI assay. (b) Detection of IPEC-J2 cell apoptosis rate by Flow cytometry analysis after treatment with β-conglycinin or glycinin. The letters at the bottom of figures indicate that: A: control group; B: 5 mg mL−1 β-conglycinin group; C: 10 mg mL−1 β-conglycinin group; D: 10 mg mL−1 β-conglycinin + caspase-3 inhibitor group; E: control group; F: 5 mg mL−1 glycinin group; G: 10 mg mL−1 glycinin group; H: 10 mg mL−1 glycinin + caspase-3 inhibitor group. Different superscripts of lowercase letters indicate p < 0.05, different superscripts of uppercase letters indicate p < 0.01. ** p < 0.01 vs. group C or group G.
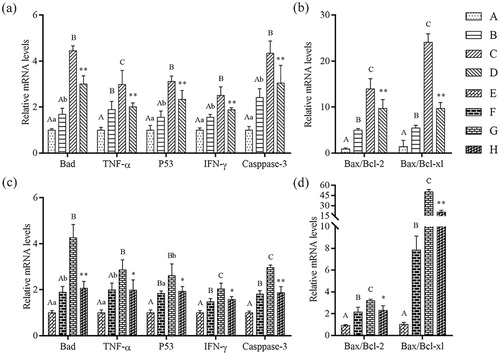
Effects of β-conglycinin or glycinin on mRNA expression of mitochondrion-regulated genes
To assess whether the mitochondrion-regulated genes were associated with apoptosis, cells were cultured with 1, 5, and 10 mg mL−1 β-conglycinin or glycinin for 24 h. The mRNA expression of mitochondrion-regulated genes was up-regulated in groups B and C compared with that in control group (P < 0.01 or P < 0.05; ). In addition, the mRNA expression of mitochondrion-regulated genes was up-regulated in groups F and G compared with that in group E (P < 0.01 or P < 0.05). However, compared with groups C and G, the mRNA expression of mitochondrion-regulated genes was significantly decreased in groups D and H (P < 0.01 or P < 0.05). These results indicate that the mRNA expression of mitochondrion-regulated genes was up-regulated as the concentration of β-conglycinin or glycinin increased.
Figure 6. Detection of mRNA levels of mitochondria-regulated genes using qRT-PCR. (a) Relative mRNA levels of Bad, TNF-α, P53, IFN-γ and Caspase-3 in IPEC-J2 cells after treatment with β-conglycinin. (b) Bax/Bcl-2 ratio and Bax/Bcl-xl ratio in IPEC-J2 cells after treatment with β-conglycinin. (c) Relative mRNA levels of Bad, TNF-α, P53, IFN-γ and Caspase-3 in IPEC-J2 cells after treatment with glycinin. (d) Bax/Bcl-2 ratio and Bax/Bcl-xl ratio in IPEC-J2 cells after treatment with glycinin. Different superscripts of lowercase letters indicate p < 0.05, different superscripts of uppercase letters indicate p < 0.01. * p < 0.05 vs. group C or group G. ** p < 0.01 vs. group C or group G.
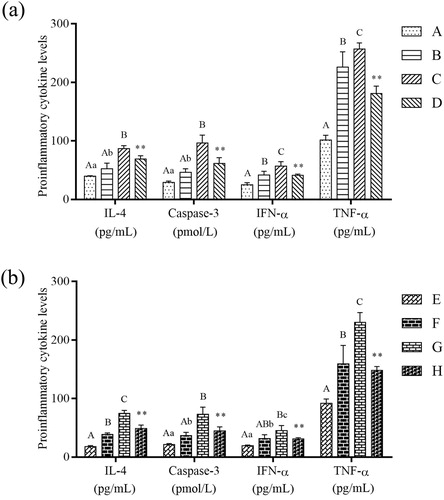
Effects of β-conglycinin or glycinin on caspase-3, TNF-α, IFN-α, and IL-4 levels in IPEC-J2 cells
Caspase-3, TNF-α, IFN-α, and IL-4 levels in IPEC-J2 cells were detected by ELISA (). The levels of the four proteins were significantly increased in groups B and C compared with that in control group (P < 0.01 or P < 0.05), significantly decreased in group D compared with that in group C (P < 0.01), significantly increased in groups F and G compared with that in group E (P < 0.01 or P < 0.05), and significantly decreased in group H compared with that in group G (P < 0.01).
Figure 7. Effects on proinflammatory cytokine levels. (a) Detection of IL-4, Caspase-3, IFN-α and TNF-α levels in IPEC-J2 cells by ELISA after treatment with β-conglycinin. (b) Detection of IL-4, Caspase-3, IFN-α and TNF-α levels in IPEC-J2 cells by ELISA after treatment with glycinin. Different superscripts of lowercase letters indicate p < 0.05, different superscripts of uppercase letters indicate p < 0.01. * p < 0.01 vs. group C or group G.
Effects of β-conglycinin or glycinin on relative caspase-3 activity, cyt-c, Bax, Bcl-2, Bcl-xl, Bak, and Bad protein expression levels
As shown in , the activity of caspase-3, protein expression levels of cyto-cyt-c, Bak, and Bad, and the ratio of Bax/Bcl-2 and Bax/Bcl-xl were significantly increased in groups B and C compared with that in control group (P < 0.01 or P < 0.05), significantly decreased in group D compared with that in group C (P < 0.01), significantly increased in groups F and G compared with that in group E (P < 0.01 or P < 0.05), and significantly decreased in group H compared with that in group G (P < 0.01).
Figure 8. Detection of mitochondria-regulated proteins expression levels using western blotting after treatment. (a) Western blot analysis of mitochondria-regulated proteins after treatment with β-conglycinin or glycinin. (b) Western blot analysis of relative caspase-3 activity in IPEC-J2 cells after treatment with β-conglycinin or glycinin. (c) Quantification of relative caspase-3 activity after treatment with β-conglycinin or glycinin. (d) Quantification of Bak, Bad, Cyto-cyt-c and Mito-cyt-c proteins expression levels after treatment with β-conglycinin. (e) Quantification of Bax/Bcl-2 and Bax/Bcl-xl ratio after treatment with β-conglycinin. (f) Quantification of Bak, Bad, Cyto-cyt-c and Mito-cyt-c proteins expression levels after 24 h of incubation with glycinin. (g) Quantification of Bax/Bcl-2 and Bax/Bcl-xl ratio after 24 h of incubation with glycinin. Different superscripts of lowercase letters indicate p < 0.05, different superscripts of uppercase letters indicate p < 0.01. * p < 0.05 vs. group C or group G. ** p < 0.01 vs. group C or group G.
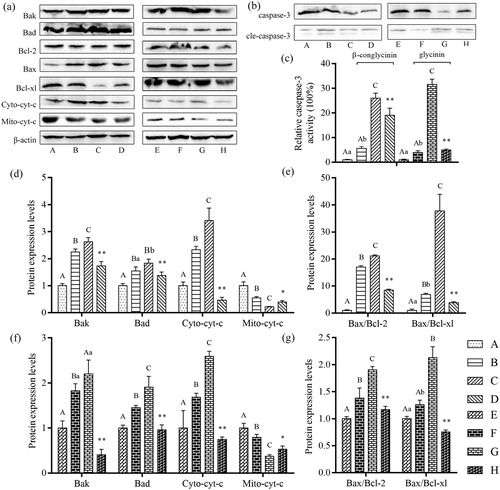
In contrast, the protein expression level of mito-cyt-c was significantly decreased in groups B and C compared with that in control group (P < 0.01 or P < 0.05), significantly increased in group D compared with that in group C, significantly decreased in groups F and G compared with that in group E (P < 0.01 or P < 0.05), and significantly increased in group H compared with that in group G (P < 0.01 or P < 0.05).
Effects of β-conglycinin or glycinin on MMP
As shown in , the increase in green fluorescence and the decrease in red fluorescence indicate that the MMP was depolarized in the treatment groups. Combined with the results of flow cytometry, the MMP was significantly depolarized in groups B and C compared with that in group A (P < 0.01 or P < 0.05). The MMP was also depolarized in groups F and G compared with that in group E (P < 0.01 or P < 0.05). In addition, the MMP was increased in group D compared with that in group C, and increased in group H compared with that in group G (P < 0.01). These results indicate that the MMP was depolarized with increasing concentrations of β-conglycinin or glycinin, which was inhibited by the caspase-3 inhibitor.
Figure 9. Damage on mitochondrial membrane potential after treatment. (a) Immunofluorescence analysis of MMP of IPEC-J2 cells stained with JC-1 after treatment with β-conglycinin. (b) Immunofluorescence analysis of MMP of IPEC-J2 cells stained with JC-1 after treatment with glycinin. (c) The representative images of AnnexinV-FITC/PI assay. (d) Flow cytometry analysis of mitochondrial membrane potential of IPEC-J2 cells stained with JC-1 after treatment with β-conglycinin or glycinin. The letters at the bottom of figures indicate that: A: control group; B: 5 mg mL−1 β-conglycinin group; C: 10 mg mL−1 β-conglycinin group; D: 10 mg mL−1 β-conglycinin + caspase-3 inhibitor group; E: control group; F: 5 mg mL−1 glycinin group; G: 10 mg mL−1 glycinin group; H: 10 mg mL−1 glycinin + caspase-3 inhibitor group. Different superscripts of lowercase letters indicate p < 0.05, different superscripts of uppercase letters indicate p < 0.01. ** p < 0.01 vs. group C or group G.
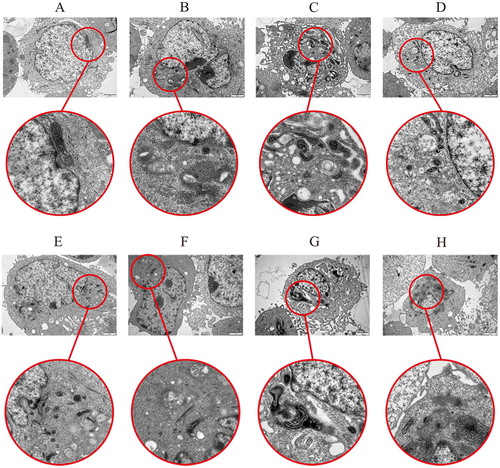
Effects of β-conglycinin or glycinin on mitochondria
As shown in , the structure of the mitochondria was normal and the outline was clear in groups A and E. However, some mitochondria showed vacuolization in groups B and F. In groups C and G, we observed that β-conglycinin or glycinin-induced structural changes in mitochondria, which appeared as mitochondrial vacuoles and altered cristae morphology; moreover, nuclear chromatin condensation and a lateral shift were observed. However, when we pre-treated IPEC-J2 cells with caspase-3 inhibitor, we observed that the β-conglycinin or glycinin treatment-induced damages in mitochondria were abolished (groups D and H vs. groups C and G, respectively).
Figure 10 . Damage of β-conglycinin or glycinin on mitochondria. The letters at the top of figures indicate that: A: control group; B: 5 mg mL−1 β-conglycinin group; C: 10 mg mL−1 β-conglycinin group; D: 10 mg mL−1 β-conglycinin + caspase-3 inhibitor group; E: control group; F: 5 mg mL−1 glycinin group; G: 10 mg mL−1 glycinin group; H: 10 mg mL−1 glycinin + caspase-3 inhibitor group.
Discussion
The intestinal mucosa regulates the ingestion of water and nutrients and makes up an important interface with the luminal environment (Cui, Wang, Chang, Zhou, & Xu, Citation2019). Additionally, it also creates a physical barrier against harmful substances and food contaminants (Lee, Citation2015; Mayr & Montminy, Citation2001). Apoptosis is a gene-mediated process of programmed cell death – an energy-requiring process – which is activated by a mitochondrion-regulated signalling pathway (Tsai et al., Citation2019). In the present study, we aimed to investigate the mechanism of apoptosis induced by soybean antigen protein by examining cell viability, MMP, apoptosis rate, and mitochondrion-regulated genes and proteins.
Mitochondria are multifunctional organelles that play a key role in redox homeostasis and cellular metabolism (Namsi et al., Citation2019), and are critical factors in the apoptotic pathway (Tsai et al., Citation2019). We hypothesized that β-conglycinin or glycinin can up-regulate caspase-3 and cause changes in MMP and release of apoptotic factors like cytochrome c, leading to mitochondrial injury and subsequently apoptosis. Based on CCK-8 and alkaline phosphatase activity assays, the cell viability was found to significantly decrease with increasing β-conglycinin or glycinin concentrations, and this decrease could be suppressed with additional treatment with caspase-3 inhibitor. This was consistent with our results of the analysis of cellular membrane integrity. In addition, cell damage was observed in IPEC-J2 cells cultured with β-conglycinin or glycinin, as evident from the decreased cell numbers, cytoplasmic degradation, rarefaction, and cavitation, which was consistent with the results of alkaline phosphatase activity. Moreover, our flow cytometry results showed that increasing concentrations of β-conglycinin or glycinin increased the apoptosis rate of IPEC-J2 cells, and the immunofluorescence results revealed that β-conglycinin or glycinin-induced cytoskeleton and tight junction protein damage in IPEC-J2 cells, although caspase-3 inhibitor significantly blocked apoptosis and damage. Chen, Lee, Hsu, Huang, and Yu (Citation2011) previously reported a similar result that β-conglycinin causes intestinal injury by inhibiting intestinal epithelial cells growth, destroying the cytoskeleton, and increasing apoptosis in piglets. However, the underlying mechanism was not elucidated.
We examined the effects of β-conglycinin or glycinin on the caspase-3/mitochondrion-regulated apoptotic pathway. The expression levels of mitochondrial apoptosis pathway-related proteins and caspase-3 activation were evaluated. A research of Renault, Floros, and Chipuk (Citation2013) found that use of fractional mitochondria helps to understand the key interactions involved in BAK and BAX activation, MOMP and apoptosis, they used freshly isolated mitochondria from numerous sources to evaluate the function of Bcl-2 family proteins and requirements for Bak and Bax activation, discussed commonly used in vitro techniques to perform MMP and cyt-c release assays, and implicated Bak and Bax activities. Our results show that the Bax/Bcl-xl and Bax/Bcl-2 ratios were significantly increased in a dose-dependent manner upon treatment with β-conglycinin or glycinin, whereas the ratios decreased significantly after the addition of caspase-3 inhibitor. The ratio of Bcl-2/Bax or Bcl-xl/Bax contributed to cell survival; the cells tended to survive at a ratio larger than 1, whereas amplification of Bax induced cell death (Korsmeyer, Citation1995). Bcl-2 is a proto-oncogene that can block apoptosis, because it regulates a variety of cell proliferation- and apoptosis-related protein activities (Martinou et al., Citation2011; Ola, Nawaz, & Ahsan, Citation2011). Bax is a pro-apoptotic protein of the Bcl-2 family, which includes central regulators of cell survival or death after the stimulation of apoptosis (Birkinshaw & Czabotar, Citation2017). Bcl-2 maintains the MMP, inhibiting the release of related apoptotic signalling molecules. Moreover, Bcl-xl can prevent cyt-c release in addition to strongly inhibiting cell death (Pestka, Citation2010). In the present study, our results indicated that the expression of mitochondrion-regulated genes and proteins was significantly increased after incubation with β-conglycinin or glycinin, although caspase-3 inhibitor treatment could suppress this increase; this is consistent with the results of apoptosis rates and level of proinflammatory cytokines. The expression levels of apoptosis-related proteins were consistent with these results. Western blotting results revealed that the levels of cleaved-caspase 3 in the soybean antigen protein models were significantly higher compared with that in the control group. Moreover, a significant linear increase in the mRNA levels and caspase-3 activation was observed after incubation with 0, 5, and 10 mg mL−1 β-conglycinin or glycinin for 24 h. Caspase-3 activation was blocked by the caspase-3 inhibitor, consistent with the results of mitochondrial apoptosis pathway-related gene and protein expression levels. Caspase-3 is a protease that is frequently activated in mammalian apoptosis (Porter & Jänicke, Citation1999). Recently, Nagayama, Ishihara, Bujo, Shirai, and Tatsuno (Citation2014) determined the proportion of active caspase-3 positive cells to evaluate apoptosis, and the results were consistent with our results. Caspase-3 is involved in several apoptotic pathways, such as mitochondrial, death receptor, and endoplasmic reticulum stress pathways. Activated caspase-3 promotes cyt-c release by cleaving cytosolic substrates. Our study revealed that blocking caspase-3 activation could inhibit cell apoptosis and cyt-c release. These results indicated that β-conglycinin or glycinin caused IPEC-J2 cell apoptosis via the caspase-3/mitochondrion-regulated apoptotic pathway.
Our study revealed that blocking caspase-3 activation could inhibit the secretion of TNF-α, IFN-α and IL-4. The inflammatory response in the body involves action through the secretion of inflammatory mediators, i.e. tumour necrosis factor-alpha (TNF-α) is multi-directional proinflammatory cytokine and an important mediator of inflammation (Zhai et al., Citation2007). IFN-α can inhibit the growth of some cells, such as the proliferation of epithelial cells, endothelial cells and hematopoietic cells. IL-4 is an early initiation factor in inducing inflammatory response, and has strong chemotactic effects on inflammatory cells, which can significantly increase the accumulation and activation of sinflammatory cells (Yu, Jung, & Kuo, Citation2015). Additionally, Sun, Liu, Wang, Liu, and Feng (Citation2013) sensitized Balb / c mice with soy globulin and β-conglycinin for five weeks without adjuvant. Results found that the expression levels of IL-4 were increased in the jejunum mucosa, consistent with our findings.
In this study, we used a JC-1 probe to evaluate whether mitochondrial dysfunction was associated with the apoptotic effects of β-conglycinin or glycinin. The results indicated that MMP was depolarized in β-conglycinin- and glycinin-treated cells, and additional treatment with caspase-3 inhibitor reduced this depolarization of MMP. To further investigate the relationship between MMP depletion and cytochrome release, western blotting of cyt-c was performed, and a significant linear increase in cyto-cyt-c protein expression was observed after treatment with 0, 5, and 10 mg mL−1 β-conglycinin or glycinin. In contrast, cyto-cyt-c protein expression was significantly decreased after treatment with caspase-3 inhibitor. Mito-cyt-c was significantly decreased after treatment with 0, 5, and 10 mg mL−1 β-conglycinin or glycinin. Additionally, mito-cyt-c was significantly decreased after treatment with caspase-3 inhibitor, which was consistent with the MMP results determined by JC-1, indicating that cyt-c was released from the mitochondria into the cytosol. These results further suggest that β-conglycinin and glycinin induce IPEC-J2 cell apoptosis via the caspase-3/mitochondrion-regulated apoptotic pathway.
Conclusions
In the present study, IPEC-J2 cells were used as an in vitro model to study soybean antigen protein-induced apoptosis and to elucidate the role of the caspase-3/mitochondrion-regulated apoptotic pathway in this process. Our results indicate that soybean antigen protein causes apoptosis of IPEC-J2 cells via the caspase-3/mitochondrion-regulated apoptotic pathway. These findings are crucial for exploring the effects of the caspase-3/mitochondrion-regulated apoptotic pathway in soybean antigen protein-induced allergic reactions.
Disclosure statement
No potential conflict of interest was reported by the authors.
Additional information
Funding
Related Research Data
References
- Adachi, A., Horikawa, T., Shimizu, H., Sarayama, Y., Ogawa, T., Sjolander, S., … Moriyama, T. (2009). Soybean beta-conglycinin as the main allergen in a patient with food-dependent exercise-induced anaphylaxis by tofu: Food processing alters pepsin resistance. Clinical & Experimental Allergy, 39, 167–173. doi: 10.1111/j.1365-2222.2008.03148.x
- Adams, J. M., & Cory, S. (2007). Bcl-2-regulated apoptosis: Mechanism and therapeutic potential. Current Opinion in Immunology, 19, 488–496. doi: 10.1016/j.coi.2007.05.004
- Birkinshaw, R. W., & Czabotar, P. E. (2017). The BCL-2 family of proteins and mitochondrial outer membrane permeabilisation. Seminars in Cell & Developmental Biology, 72, 152–162. doi: 10.1016/j.semcdb.2017.04.001
- Catsimpoolas, N., & Ekenstam, C. (1969). Isolation of alpha, beta, and gamma conglycinins. Archives of Biochemistry and Biophysics, 129, 490–497. doi: 10.1016/0003-9861(69)90206-9
- Chen, C. C., Lee, T. T., Hsu, C. B., Huang, C. W., & Yu, B. (2011). Associations of allergenic soybean proteins with piglet skin allergic reaction and application of polyclonal antibodies. Animal Production Science, 51, 1008. doi: 10.1071/AN11142
- Cui, Y. Z., Wang, Q. J., Chang, R. X., Zhou, X., & Xu, C. (2019). Intestinal barrier function-non-alcoholic fatty liver disease interactions and possible role of gut microbiota. Journal of Agricultural and Food Chemistry, 67, 2754–2762. doi: 10.1021/acs.jafc.9b00080
- Dlugosz, P. J., Billen, L. P., Annis, M. G., Zhu, W., Zhang, Z., Lin, J., … Andrews, D. W. (2006). Bcl-2 changes conformation to inhibit Bax oligomerization. The EMBO Journal, 25, 2287–2296. doi: 10.1038/sj.emboj.7601126
- Friedman, M., & Brandon, D. L. (2001). Nutritional and health benefits of soy proteins. Journal of Agricultural and Food Chemistry, 49, 1069–1086. doi: 10.1021/jf0009246
- Hancock, J. D., Cao, H., Kim, I. H., & Li, D. F. (2000). Effects of processing technologies and genetic modifications on nutritional value of full-fat soybeans in pigs. Asian-Australasian Journal of Animal Sciences, 13, 356–375. doi: 10.5713/ajas.2000.356
- Holzhauser, T., Wackermann, O., Ballmer-Weber, B. K., Bindslev-Jensen, C., Scibilia, J., Perono-Garoffo, L., … Vieths, S. (2009). Soybean (glycine max) allergy in Europe: gly m 5 (β-conglycinin) and gly m 6 (glycinin) are potential diagnostic markers for severe allergic reactions to soy. Journal of Allergy and Clinical Immunology, 123(2), 452–458. doi: 10.1016/j.jaci.2008.09.034
- Hotchkiss, R. S., Strasser, A., McDunn, J. E., & Swanson, P. E. (2009). Cell death. New England Journal of Medicine, 361, 1570–1583. doi: 10.1056/NEJMra0901217
- Korsmeyer, S. J. (1995). Regulators of cell death. Trends in Genetics, 11, 101. doi: 10.1016/S0168-9525(00)89010-1
- Krishnan, H. B., Kim, W. S., Jang, S. C., & Kerley, M. S. (2009). All three subunits of soybean β-conglycinin are potential food allergens. Journal of Agricultural and Food Chemistry, 57, 938–943. doi: 10.1021/jf802451g
- Lee, S. H. (2015). Intestinal permeability regulation by tight junction: Implication on inflammatory bowel diseases. Intestinal Research, 13, 11–18. doi: 10.5217/ir.2015.13.1.11
- Mariani, V., Palermo, S., Fiorentini, S., Lanubile, A., & Giuffra, E. (2009). Gene expression study of two widely used pig intestinal epithelial cell lines: IPEC-J2 and IPI-2I. Veterinary Immunology and Immunopathology, 131, 278–284. doi: 10.1016/j.vetimm.2009.04.006
- Martinou, J. C., Desagher, S., & Antonsson, B. (2000). Cytochrome c release from mitochondria: All or nothing. Nature Cell Biology, 2, E41–E43. doi: 10.1038/35004069
- Martinou, J.-C., & Youle, R. J. (2011). Mitochondria in apoptosis: Bcl-2 family members and mitochondrial dynamics. Developmental Cell, 21, 92–101. doi: 10.1016/j.devcel.2011.06.017
- Mayr, B., & Montminy, M. (2001). Transcriptional regulation by the phosphorylation-dependent factor CREB. Nature Reviews Molecular Cell Biology, 2, 599–609. doi: 10.1038/35085068
- Mc Gee, M. M., Greene, L. M., Ledwidge, S., Campiani, G., Nacci, V., Lawler, M., … Zisterer, D. M. (2004). Selective induction of apoptosis by the pyrrolo-1,5-benzoxazepine 7-[[dimethylcarbamoyl]oxy]−6-(2-naphthyl)pyrrolo-[2,1-d] (1,5)-benzoxazepine (PBOX-6) in Leukemia cells occurs via the c-Jun NH2-terminal kinase-dependent phosphorylation and inactivation of Bcl-2 and Bcl-XL. Journal of Pharmacology and Experimental Therapeutics, 310, 1084–1095. doi: 10.1124/jpet.104.067561
- Nagayama, D., Ishihara, N., Bujo, H., Shirai, K., & Tatsuno, I. (2014). Effects of serotonin on expression of the LDL receptor family member LR11 and 7-ketocholesterol-induced apoptosis in human vascular smooth muscle cells. Biochemical and Biophysical Research Communications, 446, 906–910. doi: 10.1016/j.bbrc.2014.03.031
- Namsi, A., Nury, T., Khan, A. S., Leprince, J., Vaudry, D., Caccia, C., & Lizard, G. (2019). Induces N2a cells differentiation through aPKA/PLC/PKC/MEK/ERK-dependent pathway: Incidence on peroxisome, mitochondria, and lipid profiles. Molecules, 24, E3310. doi:10.3390/molecules24183310
- Neuzil, J., Wang, X. F., Dong, L. F., Low, P., & Ralph, S. J. (2006). Molecular mechanism of ‘mitocan’-induced apoptosis in cancer cells epitomizes the multiple roles of reactive oxygen species and Bcl-2 family proteins. FEBS Letters, 580, 5125–5129. doi: 10.1016/j.febslet.2006.05.072
- Ola, M. S., Nawaz, M., & Ahsan, H. (2011). Role of Bcl-2 family proteins and caspases in the regulation of apoptosis. Molecular and Cellular Biochemistry, 351, 41–58. doi: 10.1007/s11010-010-0709-x
- Pan, L., Zhao, Y., Farouk, M. H., Bao, N., Wang, T., & Qin, G. (2018). Integrins were involved in soybean agglutinin induced cell apoptosis in IPEC-J2. International Journal of Molecular Sciences, 19, 587. doi: 10.3390/ijms19020587
- Peng, C. L., Cao, C. M., He, M. C., Shu, Y., Tang, X., Wang, Y., … Wu, J. (2018). Soybean glycinin- and β-conglycinin-induced intestinal damage in piglets via the p38/JNK/NF-κB signaling pathway. Journal of Agricultural and Food Chemistry, 66, 9534–9541. doi: 10.1021/acs.jafc.8b03641
- Peng, C. L., Ding, X. D., Zhu, L., He, M., Shu, Y., Zhang, Y., … Wu, J. (2019). β-Conglycinin-induced intestinal porcine epithelial cell damage via the nuclear factor κB/mitogen-activated protein kinase signaling pathway. Journal of Agricultural and Food Chemistry, 67, 9009–9021. doi: 10.1021/acs.jafc.9b02784
- Pestka, J. J. (2010). Deoxynivalenol: Mechanisms of action, human exposure, and toxicological relevance. Archives of Toxicology, 84, 663–679. doi: 10.1007/s00204-010-0579-8
- Porter, A. G., & Jänicke, R. U. (1999). Emerging roles of caspase-3 in apoptosis. Cell Death & Differentiation, 6, 99–104. doi: 10.1038/sj.cdd.4400476
- Qiao, S., Li, D., Jiang, J., Zhou, H., Li, J., & Thacker, P. A. (2003). Effects of moist extruded full-fat soybeans on gut morphology and mucosal cell turnover time of weanling pigs. Asian-Australasian Journal of Animal Sciences, 16, 63–69. doi: 10.5713/ajas.2003.63
- Qin, G. X., Xu, L. M., Jiang, H. L., van der Poel, A. F. B., Bosch, M. W., & Verstegen, M. W. A. (2002). The effects of Chinese and Argentine soybeans on nutrient digestibility and organ morphology in landrace and Chinese Min pigs. Asian-Australasian Journal of Animal Sciences, 15, 555–564. doi: 10.5713/ajas.2002.555
- Renault, T. T., Floros, K. V., & Chipuk, J. E. (2013). BAK/BAX activation and cytochrome c release assays using isolated mitochondria. Methods, 61, 146–155. doi: 10.1016/j.ymeth.2013.03.030
- Rosini, P., De Chiara, G., Lucibello, M., Garaci, E., Cozzolino, F., & Torcia, M. (2000). NGF withdrawal induces apoptosis in CESS B cell line through p38 MAPK activation and Bcl-2 phosphorylation. Biochemical and Biophysical Research Communications, 278, 753–759. doi: 10.1006/bbrc.2000.3871
- Saeed, H., Gagnon, C., Cober, E., & Gleddie, S. (2016). Using patient serum to epitope map soybean glycinins reveals common epitopes shared with many legumes and tree nuts. Molecular Immunology, 70, 125–133. doi: 10.1016/j.molimm.2015.12.008
- Sun, P., Li, D. F., Li, Z. J., Dong, B., & Wang, F. (2008). Effects of glycinin on IgE-mediated increase of mast cell numbers and histamine release in the small intestine. The Journal of Nutritional Biochemistry, 19, 627–633. doi: 10.1016/j.jnutbio.2007.08.007
- Sun, H., Liu, X., Wang, Y. Z., Liu, J.-X., & Feng, J. (2013). Soybean glycinin- and β-conglycinin-induced intestinal immune responses in a murine model of allergy. Food and Agricultural Immunology, 24(3), 357–369. doi: 10.1080/09540105.2012.704507
- Tomiyama, A., Tachibana, K., Suzuki, K., Seino, S., Sunayama, J., Matsuda, K.-i., … Kitanaka, C. (2010). MEK-ERK-dependent multiple caspase activation by mitochondrial proapoptotic Bcl-2 family proteins is essential for heavy ion irradiation-induced glioma cell death. Cell Death & Disease, 1, e60. doi: 10.1038/cddis.2010.37
- Tsai, H.-L., Pang, S.-Y., Wang, H.-C., Luo, C.-W., Li, Q.-L., Chen, T.-Y., & Pan, M.-R. (2019). Impact of BMI1 expression on the apoptotic effect of paclitaxel in colorectal cancer. American Journal Cancer Research, 9, 2544–2553.
- Wu, J. J., Cao, C. M., Meng, T. T., Zhang, Y., Xu, S. L., Feng, S. B., … Wang, X. C. (2016b). Induction of immune responses and allergic reactions in piglets by injecting glycinin. Italian Journal of Animal Science, 15(1), 166–173. doi: 10.1080/1828051X.2016.1144488
- Wu, J. J., Cao, C. M., Ren, D. D., Zhang, Y., Kou, Y. N., Ma, L. Y., … Wang, X. C. (2016a). Effects of soybean antigen proteins on intestinal permeability, 5-hydroxytryptamine levels and secretory iga distribution in the intestine of weaned piglets. Italian Journal of Animal Science, 15(1), 174–180. doi: 10.1080/1828051X.2016.1148559
- Yu, J. H., Jung, H. H., & Kuo, C. L. (2015). Yam storage protein dioscorins modulate cytokine gene expression in BALB/c and C57BL/6 lymphocytes. Food and Agricultural Immunology, 26(6), 909–923. doi: 10.1080/09540105.2015.1048787
- Zhai, Z. L., Haney, D., Wu, L. K., Solco, A., Murphy, P. A., Wurtele, E. S., … Cunnick, J. E. (2007). Alcohol extracts of Echinacea inhibit production of nitric oxide and tumor necrosis factor-alpha by macrophages in vitro. Food and Agricultural Immunology, 18, 221–236. doi: 10.1080/09540100701797363
- Zhang, Y., Guo, H., Cheng, B. C., Su, T., Fu, X.-Q., Li, T., … Yu, Z.-L. (2018). Dingchuan tang essential oil inhibits the production of inflammatory mediators via suppressing the IRAK/NF-κB, IRAK/AP-1, and TBK1/IRF3 pathways in lipopolysaccharide-stimulated RAW264.7 cells. Drug Design, Development and Therapy, 12, 2731–2748. doi: 10.2147/DDDT.S160645
- Zhao, Y., Qin, G. X., Sun, Z. W., Zhang, B., & Wang, T. (2010). Effects of glycinin and β-conglycinin on enterocyte apoptosis, proliferation and migration of piglets. Food and Agricultural Immunology, 21(3), 209–218. doi: 10.1080/09540101003596644