
 ?Mathematical formulae have been encoded as MathML and are displayed in this HTML version using MathJax in order to improve their display. Uncheck the box to turn MathJax off. This feature requires Javascript. Click on a formula to zoom.
ABSTRACT
A label-free and rapid detection of cooked rat meat-based molecular-imprinted polymer (MIP) conjugated with quantum weak measurement system (QWM) has been developed. Cooked rat protein-specific MIP was prepared by a modified reverse-phase microemulsion method and coated on the internal surface of measuring channels assembled into Mach-Zrhnder interferometer of an optical weak measurement system. The measurement is based on the optical phase shift due to the refractive index change, which is induced by the specific capture of rat protein at its MIP sites. The results can be characterized and calculated by the central wavelength shift of output spectra through weak value amplification. This MIP-WQM system was demonstrated with cooked rat protein showing linear dynamic range from 0 to 20 µg/L. The limit of detection is calculated as 0.1 µg/L for cooked rat meat protein. The system also showed high specificity to cooked rat meat protein, compared to cooked pork meat proteins.
GRAPHICAL ABSTRACT
1. Introduction
Meat and meat products have become an important part of people's daily diet. The data showed that the total global meat production in 2016 was approximately 320.7 million tons (Hicks, Knowles, & Farouk, Citation2018). Because of the market prices gap among different animal meats, which bring about the different economic benefits, some food business enterprises or self-employed operators are attempting illegal profits by using lower priced meat to replace the high priced and valuable meats. This type of meat adulteration not only violated the Food Labelling Act, the Fair Trade Act and the Consumer Protection Act, but also meat products containing undeclared species meat may cause allergies and diseases in sensitized individuals (Brioudes & Gummow, Citation2016). For example, in early 2013, Europe was hit by the biggest fraud ground beef products adulterated with horse meat, in which a medicine in horse meat may be transferred to human body to cause serious health issues (Nau, Citation2013). Furthermore, the rate of adulteration of cooked meat products is going higher as the processed meat products have undergone great changes in the morphology and processing, that consumers can't tell whether they are false or not. Therefore, detection of cooked meat is merging as an urgent need in the food safety detection (Alamprese, Amigo, Casiraghi, & Engelsen, Citation2016; Bhat et al., Citation2016; Montowska, Alexander, Tucker, & Barrett, Citation2014; Thienes et al., Citation2018, Citation2019; Ulca, Balta, Cagin, & Senyuva, Citation2013).
Rat is such an animal that widely spread and rapidly produced. There have been reported that some foxes, otters and rat meat are processed and sold by unscrupulous traders, which have not been quarantined. It is well known that rodents including rat are the spreaders of many bacteria and the virus content in the body because it is often live around some dirty places lead to carrying a lot of germs (Himsworth, Parsons, Jardine, & Patrick, Citation2013; Panti-May et al., Citation2017). The pathogens in rat are highly contagious and harmful. If rats eat harmful substances such as chronic rodenticides and heavy metals into the body, people who happen to eat the meat of such rat, leading to chronic poisoning with poisons and heavy metals and other harmful substances entered the human body (Simmons, Taylor, Marques, & Williams, Citation2018) Rat meat gradually walked into the table due to its easily sources. Cooked rat meat can also easily frauded with species to mislead into other meats for custom consumers. Therefore, it is especially important to establish a method for quickly identifying cooked rat meat.
In response to the adulteration of meat and meat products, various qualitative and quantitative detection technologies have been developed. Some detection technologies are antibody protein-based ELISA analysis of meat and processed products. For example, Hsieh and Ofori (Citation2014) developed an antibody-based ELISA to specifically detect horse meat in raw and heat-processed meat products. Thienes et al. (Citation2019) developed an ELISA method for quantitative detection of Chick and Turkey contamination in cooked meat products. Other methods are DNA-based PCR methods for meat species identification (Song, Hwang, & Kim, Citation2017). For example, Bhat. M. M. using PCR method to detect mutton Rista with beef and buffalo (Bhat et al., Citation2016). Barakat, El-Garhy, and Moustafa (Citation2014) using species-specific PCR-QlAxcel procedure to detect pork adulteration in processed meat. Azam, Roy, Lim, and Uddin Ahmed (Citation2018) use DNA-luminol interaction for meat species identification. Furthermore, various imaging and spectroscopy-based methods have been developed for cooked meat detection. For example, Ruiz Orduna, Husby, Yang, Ghosh, and Beaudry (Citation2017) use high-resolution of mass spectrometry and a proteogenomic strategy for meat species identification. Wang used an optical thin-film biosensor chips for detection of eight meat species (Dobrovolny et al., Citation2019; Wang, Zhu, Chen, Xu, & Zhou, Citation2015). Visible-near-infrared (Vis-IR) spectroscopy is a method for meat species identification (Qu et al., Citation2015; Rady & Adedeji, Citation2018). Zhao developed visible-near-infrared (Vis-NIR_ for cooked beef adulteration; Zhao, Feng, Chen, & Jia, Citation2019). Zheng, Li, Wei, and Peng (Citation2019) also uses Vis-NIR hyperspectral imaging for adulteration of duck meat in minced lamb. Rahmania, Sudjadi, and Rohman (Citation2015) use FTIR combined with chemometric to the analysis of rat meat. All those methods have advantages and disadvantages and will be summarized in the discussion.
In this paper, a brand-new detection system based on MIP and QWM was presented for specifically detect cooked rat meat. The QWM is becoming an attractive method as a signal amplification technique in the recent years (Guan et al., Citation2019; Xu et al., Citation2018; Zhang et al., Citation2019). It is generally accepted that a QWM has three parts: the preselection, the postselection, and the weak coupling (Lundeen & Bamber, Citation2012). In the optical weak measurement experiment, when the two eigenstates of the system are in orthogonal polarization, the weak value of tiny shifts between the two states can be amplified to the maximum and read out from the output spectra (Li et al., Citation2016; Pryde, O'Brien, White, Ralph, & Wiseman, Citation2005). Since the weak value can be amplified to any factor, the weak measure has been applied in many areas as a high precision detection method (Zhang et al., Citation2019; Guan et al., Citation2019; Li et al., Citation2016; An et al., Citation2018; Li et al., Citation2017) In our previous work, we developed a MIP-combined QWM method and successfully applied to the detection of BSA with high precision and specificity (Li et al., Citation2017).
In this work, we modified and applied the previous MIP-QWM system for the detection of cooked rat meat. The MIP was prepared with highly specific cooked rat protein, coated on the internal surface of measuring channels assembled into Mach-Zrhnder interferometer of an optimized weak measurement system. The feasibility, sensitivity, and specificity for detection of cooked rat protein will be experimentally demonstrated.
2. Materials and methods
2.1. Materials
3-Aminopropyltriethoxysilane(APTES, 99%) and Tetraethyl orthosilicate (TEOS, 99.99% metal basis) were purchased from Aladdin (Shanghai, China). H2O2, Vitriol, and NH3H2O were provided by Shenzhen. 10×PBST (phosphate-buffered solution) was obtained from Phygene. Deionized water was prepared on an ultra-pure water system by Barnstead GenPure Pro (Thermo Scientific, USA) and used for all buffers. Black rat was purchased from Guangdong Medical Experimental Animal Centers. Meats from four animals were used to prepare laboratory samples. Boiled sliced pork was purchased from school cafeteria and they are all cooked meat. The meat was cut into pieces and chopped it with an electric meat grinder. Meats from different animals were handle separately. The apparatus was cleaned carefully between samples to prevent cross-contamination.
2.2. Sample preparation
Heat 100 milligrams of rat or pork minced meat separately in a boiling water bath for 30 min in a beaker sealed with aluminium foil. When the temperature drops to room temperature, samples were collected and prepared by weighing different meat directly in a 15 mL tube, add with 10 mL of diluted 1000 times PBST at the same time, then extracting the mixture or by mixing the relevant species. All crude extracts were centrifuged at 4°C for 10 min at 3000r (model KS50R, Kaida Scientific Instrument, China) to obtain the clean meat extracts. The obtained supernatant was stored at −20 or 4°C or used fresh.
2.3. The preparation of and characterization of cooked rat meat MIP and NIP
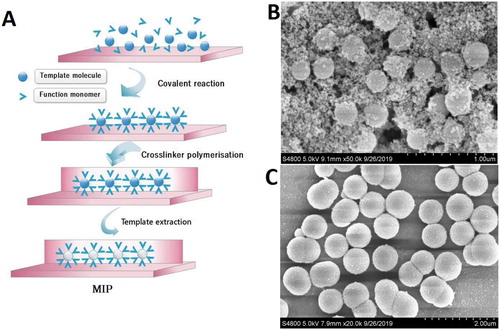
The rat MIP was prepared with reversed-phase microemulsion method modified from previous paper (Li et al., Citation2017). Briefly, the prism itself instead of a slide was used. The prism surface was cleaned with the mixture of H2O2 and vitriol (ratio 1:3), followed by pure water and ethyl alcohol. The rat meat extracted purified protein (100mg) was used as template molecules and APTES (200 μL) as functional monomer. The crosslinker of SiO2 was prepared through hydrolysis of TEOS (800 μL) by the catalyst of NH3H2O.H2O. The rat MIP preparation was initiated by dissolving purified cooked rat protein (100mg) in distilled H2O2 (100ml), followed by adding APTES on the prism surface. The mixture was first mixed for 2 h, then NH3.H2O and TEOS were added, followed by mixing for another 12 h. Then, the prism was taken out and washed with distilled water and ethyl alcohol, dried in oven at a temperature of 60°C for 12 h. The rat protein was detached from the polymers on the prism surface by soaking the prism in ethyl acetate for 6 h. After that, the prism was washed with ethyl alcohol and dried for another 6 h. The rat MIP was deposited at 4°C for the QWM tests. Meanwhile, Rat-NIP was synthesized by the same method without rat protein. The fabrication of rat MIP&NIP was shown in (A). Their surface topography was characterized by SEM shown in (B,C). The recognition sites were clearly existed on the rough surface of the rat-MIP (B), compared to the smooth surface of rat-NIP(C).
Figure 1. The schematic pattern of the preparation of cooked rat meat MIP&NIP (A), and the SEM photography of rat meat MIP (B) and NIP (C).
2.4. Rat protein QWM experiment setup
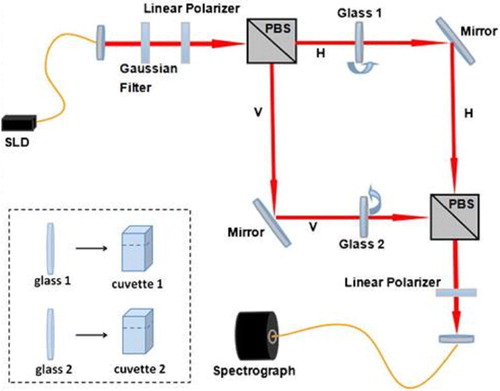
The two flow channels of rat protein QWM system was set up as shown in , in that the prism surface coated with rat MIP was used as the test channel (V arm), while the blank prism on the H arm as the reference channel. During the QWM tests, the solution of test protein was passed through the measuring channel, which will induce the central wavelength shift of the output spectra on the spectrograph. The shift scope will reflect the concentration of the test protein interacted with the prism MIP. Thus, the dynamic process of prim MIP and the test protein can be monitored in real time through observing the wavelength shift.
Figure 2. Schematic pattern for cooked rat meat weak measurement.
2.5. Weak measurement principal of rat protein
The weak measurement principle of rat protein is similar to that of BSA measurement (Li et al., Citation2017). Briefly, QWM includes three parts, the preselection state , the postselection state
, and the weak coupling. The tiny difference between the two eigenstates cannot be measured by any traditional methods, rather than a probe through weak measurement indirectly. Generally, in a weak measurement, the weak couple value can be expressed as.
, which is equal to the amplification factor. When the preselection and postselection are orthogonal, which is easily realized in the test, the amplification can be very larger to any extent, even larger than the measuring parameter itself.
In our weak measurement system, the difference between the two eigenstates can be expressed by the central wavelength shift of the output signal with the amplification. Such a signal amplification method has been optimized in its precision and specificity in a number of measurements. In this work, the schematic diagram shown in is used to detect the processed rat meat based on a Mach–Zehnder interferometer system. and the practical picture is shown in supplemental.
Incident light from an 840 nm superluminent laser diode (SLD) was filtered with a Gaussian filter with a bandwidth of 24 nm, and then preselected by a linear polarizer, which could be expressed as , where α was the angle between the direction of the transmission axis and the vertical position. When α = 0°, there was only vertical polarization in the measuring device (the Mach–Zehnder inter-ferometer), and the initial incident state was just an eigenstate. It did not conform to the concept of weak measurement. The weak measurement signal could not be found. The same situation occurred for α = 90°. Therefore, the angle α could not be 0° or 90°. The beam was divided into two orthogonal polarizations (H and V) by the first polarized beam splitter (PBS), and then recombined by the second PBS after propagating through two independent paths. In our first experiment, Glass 1 and Glass 2 were used to tune the phase difference in H and V path, respectively. Glass 2 was tilted by an angle θ with the vertical direction, inducing a phase difference ϕ. A second linear polarizer was used to postselect a state with its transmission axis placed at an angle of π∕2+β with the transmission axis of the first one. The postselected state could be expressed as
, where ϕ was the added phase difference between the two paths, and
was the initial phase difference.
The weak value of the observable can be expressed as
(1)
(1) The imaginary part of the ak value is
(2)
(2) where
. The shift of the momentum is given by
(Ritchie, Story, & Hulet, Citation1991), where ΔP is the uncertainty of the photons corresponding to the spectrum width of the SLD, and k is the interaction strength, which is relatively small. We can rewrite δP using the relation
, thus giving the spectrum shift
(3)
(3)
3. Results
3.1. Characterization of rat heat-resistant protein
Rat meat was heated, and the protein was extracted as described, followed by gel electrophoresis. The result was showed in .
Figure 3. The gel electrophoresis results of cooked rat meat protein.
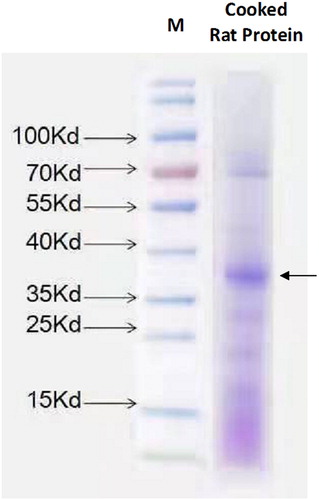
The rat heat-resistant protein was concentrated at 35–40KD. This gel lane was cut, and further peptide analysis was performed by LC-MS, and potential protein complexes involved were analysed. The results were showed in Supplemental.
3.2. Rat meat weak measurement
To verify the feasibility study of the rat-MIP, a real-time reaction of rat protein with rat-MIP and rat-NIP was conducted. If the rat-MIP can capture the rat protein on the prism surface, an increase of refractive index will be induced by the protein adsorption, which will cause the optical phase changed between measuring arm and reference arm. The rat protein solution with a concentration of 0.01 mg/mL was passed through the detection area of Rat-MIP and rat-NIP separately. The adsorption kinetic curves of rat-MIP and Rat-NIP were obtained as shown in (A). The X-axis is the adsorption time and the y-axis represented the shift of central wavelength. In the case of rat-MIP, the central wavelength shift increased to 4.8 nm, while in that of Rat-NIP, the central wavelength curve was almost flat. The results indicated that Rat-MIP can recognize rat-protein effectively by this weak measurement system.
Figure 4. The results of cooked rat meat MIP and NIP measured by the MIP-QWM system (A); and the corresponding dose–response dynamic curve of cooked rat meat MIP by MIP-QWM measurement (B).
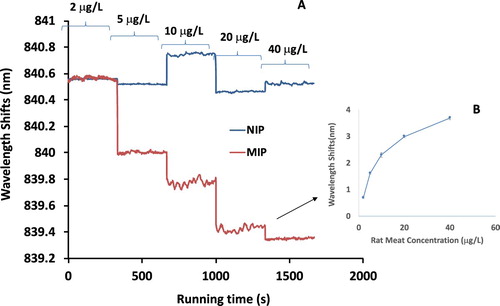
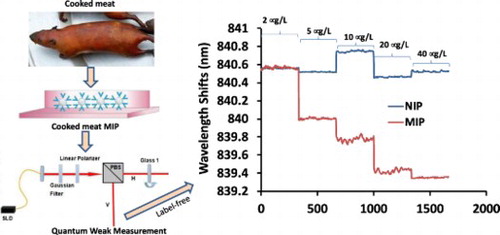
To achieve the dynamic curve of this Rat-MIP QWM towards to rat meat protein, various concentrations (2–40 μg/L) of rat meat protein were passed through the measuring channel. The flow channel was fabricated within the same batch for each concentration to keep the detection condition uniformly. The results of wavelength shifts to various rat protein concentration were plot in (B).
As the results indicated, this Rat-MIP QWM apparently demonstrated a dose–response towards different concentration of rat meat proteins. When a lower concentration of rat protein passed through the measuring channel, the recognition sites were filled with a low rate absorption that induced a lower central wavelength shifts, while a high concentration of rat protein results a high wavelength shifts. The real-time responses of central wavelength shifts with different concentration of rat proteins were plot, and the data points were chosen from the data at the duration time of 5 min in (A) without dramatic fluctuation during detection. The error bars were determined by all the data points of the 5 min running.
There is an apparent dynamic response to rat meat protein in this weak measurement system. A quick dose–response was observed at low concentration (i.e. 0–5 μg/L), followed by a saturation trend at relatively high concentration (i.e. >20 μg/L). The linear curve concentration was determined at 0–20 μg/L. The limit of detection (LOD) of this system was determined in the first order of linear standard curve as LOD = 3d/S, where S is the slop of the zero point (i.e. detection of extraction buffer) of the concentration curve in the linear range, while d is standard deviation of this working part. Thus, the LOD of this system is calculated as 0.1 μg/L, which indicated that this rat-MIP QWM system is highly sensitive for rat protein detection.
3.3. The specificity verification of rat-MIP
The specificity of the Rat-MIP was verified by using target rat protein as well as pork protein with the same concentration range of 0–40 μg/L. The result was shown in .
Figure 5. The results of cooked pork MIP measured by the MIP-WQM system.
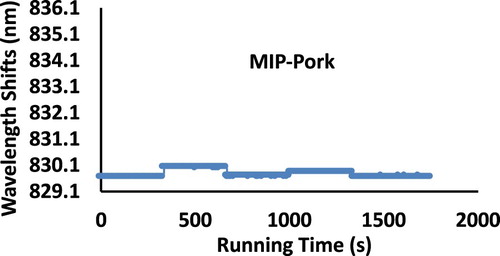
As indicated, when the solution of pork protein passed through the measuring channel of Rat-MIP, the central wavelength shifts were almost unchanged, whereas, when the solution of rat protein flowed the same Rat-MIP, apparent central wavelength shifts were observed. Further tested are being performed with beef, sheep, and other meat proteins. Therefore, this Rat-MIP QWM system experimentally demonstrated specificity and selectivity to rat protein rather that pork meat proteins.
4. Discussion
In this work, a Rat-MIP QWM system was first fabricated and realized for detection of cooked rat meat protein. This system is based on MZ interferometer of QWM, in that, the rat protein was specifically captured by the Rat-MIP which induced the refractive index changes. These changes were related to their optical phase differences in the system that can be detected by monitoring the central wavelength shift of output spectra. By using the weak value calculation equations, the standard curves of rat protein detection can be fulfilled for the feasibility and specificity determination without any labelling.
Cooked rat protein was prepared by heating the whole rat for several hours in boiled water. The remaining proteins in the cooked rat were purified and characterized. Obviously, some proteins of rat are very stable upon cooking. The main one as shown on the electrophoresis gels was used for the fabrication of Rat-MIP by a modified reverse microemulsion method. This Rat-MIP surface characterized by SEM showed clear polymers fabricated, compared to Rat-NIP. This cooked rat proteins were further analysed by LC-MS, and potential rat proteins involved were examined. Some known proteins such as heat shock protein 70 were found inside. Moreover, this rat cooked proteins were immunized to develop a rat polyclonal antibody, which also showed very high specificity to rat meat protein. The related ELISA is being developed and compared to this MIP-QWM method. The manuscript is under preparation.
The rat-MIP QWM system was built up by implementing the rat-MIP coated prism as the measuring channel and rat-NIP as the reference channel in a home-made optical weak measure system. The feasibility and specificity of this system were demonstrated by passing rat meat proteins and pork proteins through the measuring channel at a real-time manner. The whole system showed high feasibility as indicated by different wavelength shifts of the output spectra. The standard curves of the detection were obtained by using different concentrations of cooked rat protein. The kinetic features of the curves showed linear relationships between the low concentrations (0–20 μg/L) and the refractive index changes of wavelength shifts. The limit of detection was determined in the first order of linear curve as 0.1 μg/L, which indicated high precision for cooked rat protein detection. The specificity of this rat-MIP-QWM system was demonstrated with flowing pork protein through the measuring channel, which resulted in little or no refractive index changes. Further experiments with other animal species meat as well as mix meat mixtures are under investigation. The advantages and disadvantages of current methods for cooked meat detection were summaries as in .
Table 1. The comparison of different methods for cooked meat detection.
In conclusion, a new Rat-MIP QWM system was realized for detection of cooked rat protein. This detection system demonstrated several advantages towards to traditional ELISA or other methods. It is label-free with high precision and specificity for rat protein. It requires no additional reagents to be developed. This system will be useful for the rapid detection of trace rat meat in a real-time manner. It can also apply to other meat species. Nevertheless, this system needs some meat sample pretreatment, and the whole system must be transparency and stable for light passing. Further optimization is needed to develop it as a hand-held device for food safety detection of meat authenticity.
Acknowledgments
The authors thank Dr Dongmei Li at Zhejing Industry University for her suggestion.
Supplemental Material
Download MS Word (82.3 KB)Disclosure statement
No potential conflict of interest was reported by the author(s).
Additional information
Funding
Related Research Data
References
- Alamprese, C., Amigo, J. M., Casiraghi, E., & Engelsen, S. B. (2016). Identification and quantification of Turkey meat adulteration in fresh, frozen-thawed and cooked minced beef by FT-NIR spectroscopy and chemometrics. Meat Science, 121, 175–181. doi: 10.1016/j.meatsci.2016.06.018
- An, X. B., Li, H. W., Yin, Z. Q., Hu, M. J., Huang, W., Xu, B. J., … Han, Z. F. (2018). Experimental three-party quantum random number generator based on dimension witness violation and weak measurement. Optics Letters, 43(14), 3437–3440. doi: 10.1364/OL.43.003437
- Azam, N. F. N., Roy, S., Lim, S. A., & Uddin Ahmed, M. (2018). Meat species identification using DNA-luminol interaction and their slow diffusion onto the biochip surface. Food Chemistry, 248, 29–36. doi: 10.1016/j.foodchem.2017.12.046
- Barakat, H., El-Garhy, H. A., & Moustafa, M. M. (2014). Detection of pork adulteration in processed meat by species-specific PCR-QIAxcel procedure based on D-loop and cytb genes. Applied Microbiology and Biotechnology, 98(23), 9805–9816. doi: 10.1007/s00253-014-6084-x
- Bhat, M. M., Salahuddin, M., Mantoo, I. A., Adil, S., Jalal, H., & Pal, M. A. (2016). Species-specific identification of adulteration in cooked mutton Rista (a Kashmiri Wazwan cuisine product) with beef and buffalo meat through multiplex polymerase chain reaction. Veterinary World, 9(3), 226–230. doi: 10.14202/vetworld.2016.226-230
- Brioudes, A., & Gummow, B. (2016). Field application of a combined pig and poultry market chain and risk pathway analysis within the Pacific Islands region as a tool for targeted disease surveillance and biosecurity. Preventive Veterinary Medicine, 129, 13–22. doi: 10.1016/j.prevetmed.2016.05.004
- Dobrovolny, S., Blaschitz, M., Weinmaier, T., Pechatschek, J., Cichna-Markl, M., Indra, A., … Hochegger, R. (2019). Development of a DNA metabarcoding method for the identification of fifteen mammalian and six poultry species in food. Food Chemistry, 272, 354–361. doi: 10.1016/j.foodchem.2018.08.032
- Guan, T., Yang, Y., Zhang, Q., He, Y., Xu, N., Li, D., … Wang, X. (2019). Label-free and Non-destruction determination of single- and double-strand DNA based on quantum weak measurement. Scientific Reports, 9(1), 1891. doi: 10.1038/s41598-018-38454-x
- Hicks, T. M., Knowles, S. O., & Farouk, M. M. (2018). Global provisioning of red meat for flexitarian diets. Frontiers in Nutrition, 5, 50. doi: 10.3389/fnut.2018.00050
- Himsworth, C. G., Parsons, K. L., Jardine, C., & Patrick, D. M. (2013). Rats, cities, people, and pathogens: A systematic review and narrative synthesis of literature regarding the ecology of rat-associated zoonoses in urban centers. Vector Borne and Zoonotic Diseases, 13(6), 349–359. doi: 10.1089/vbz.2012.1195
- Hsieh, Y. H., & Ofori, J. A. (2014). Detection of horse meat contamination in raw and heat-processed meat products. Journal of Agricultural and Food Chemistry, 62(52), 12536–12544. doi: 10.1021/jf504032j
- Li, D., He, Q., He, Y., Xin, M., Zhang, Y., & Shen, Z. (2017). Molecular imprinting sensor based on quantum weak measurement. Biosensors & Bioelectronics, 94, 328–334. doi: 10.1016/j.bios.2017.03.021
- Li, D., Shen, Z., He, Y., Zhang, Y., Chen, Z., & Ma, H. (2016). Application of quantum weak measurement for glucose concentration detection. Applied Optics, 55(7), 1697–1702. doi: 10.1364/AO.55.001697
- Lundeen, J. S., & Bamber, C. (2012). Procedure for direct measurement of general quantum states using weak measurement. Physical Review Letters, 108(7), 070402. doi: 10.1103/PhysRevLett.108.070402
- Montowska, M., Alexander, M. R., Tucker, G. A., & Barrett, D. A. (2014). Rapid detection of peptide markers for authentication purposes in raw and cooked meat using ambient liquid extraction surface analysis mass spectrometry. Analytical Chemistry, 86(20), 10257–10265. doi: 10.1021/ac502449w
- Nau, J. Y. (2013). [Horse meat: First lessons of a scandal]. Revue Medicale Suisse, 9(376), 532–533.
- Panti-May, J. A., De Andrade, R. R. C., Gurubel-Gonzalez, Y., Palomo-Arjona, E., Soda-Tamayo, L., Meza-Sulu, J., … Costa, F. (2017). A survey of zoonotic pathogens carried by house mouse and black rat populations in Yucatan, Mexico. Epidemiology and Infection, 145(11), 2287–2295. doi: 10.1017/S0950268817001352
- Pryde, G. J., O'Brien, J. L., White, A. G., Ralph, T. C., & Wiseman, H. M. (2005). Measurement of quantum weak values of photon polarization. Physical Review Letters, 94(22), 220405. doi: 10.1103/PhysRevLett.94.220405
- Qu, J. H., Liu, D., Cheng, J. H., Sun, D. W., Ma, J., Pu, H., & Zeng, X. A. (2015). Applications of near-infrared spectroscopy in food safety evaluation and control: A review of recent research advances. Critical Reviews in Food Science and nutrition, 55(13), 1939–1954. doi: 10.1080/10408398.2013.871693
- Rady, A., & Adedeji, A. (2018). Assessing different processed meats for adulterants using visible-near-infrared spectroscopy. Meat science, 136, 59–67. doi: 10.1016/j.meatsci.2017.10.014
- Rahmania, H., Sudjadi, Rohman, A. (2015). The employment of FTIR spectroscopy in combination with chemometrics for analysis of rat meat in meatball formulation. Meat Science, 100, 301–305. doi: 10.1016/j.meatsci.2014.10.028
- Ritchie, N. W. M., Story, J. G., & Hulet, R. G. (1991). Realization of a measurement of a weak value. Physical Review Letters, 66(9), 1107–1110. doi: 10.1103/PhysRevLett.66.1107
- Ruiz Orduna, A., Husby, E., Yang, C. T., Ghosh, D., Beaudry, F. (2017) Detection of meat species adulteration using high-resolution mass spectrometry and a proteogenomics strategy. Food Additives & Contaminants. Part A, Chemistry, Analysis, Control, Exposure & Risk Assessment, 34(7), 1110–1120.
- Simmons, S. C., Taylor, L. J., Marques, M. B., & Williams, L. A., 3rd. (2018). Rat poisoning: A challenging diagnosis with clinical and psychological implications. Laboratory Medicine, 49(3), 272–275.
- Song, K. Y., Hwang, H. J., & Kim, J. H. (2017). Ultra-fast DNA-based multiplex convection PCR method for meat species identification with possible on-site applications. Food Chemistry, 229, 341–346. doi: 10.1016/j.foodchem.2017.02.085
- Thienes, C. P., Masiri, J., Benoit, L. A., Barrios-Lopez, B., Samuel, S. A., Cox, D. P., … Samadpour, M. (2018). Quantitative detection of pork contamination in cooked meat products by ELISA. Journal of AOAC International, 101(3), 810–816. doi: 10.5740/jaoacint.17-0036
- Thienes, C. P., Masiri, J., Benoit, L. A., Barrios-Lopez, B., Samuel, S. A., Meshgi, M. A., … Samadpour, M. (2019). Quantitative detection of chicken and turkey contamination in cooked meat products by ELISA. Journal of AOAC International, 102(2), 557–563. doi: 10.5740/jaoacint.18-0136
- Ulca, P., Balta, H., Cagin, I., & Senyuva, H. Z. (2013). Meat species identification and Halal authentication using PCR analysis of raw and cooked traditional Turkish foods. Meat Science, 94(3), 280–284. doi: 10.1016/j.meatsci.2013.03.008
- Wang, W., Zhu, Y., Chen, Y., Xu, X., & Zhou, G. (2015). Rapid visual detection of eight meat species using optical thin-film biosensor chips. Journal of AOAC International, 98(2), 410–414. doi: 10.5740/jaoacint.14-230
- Xu, Y., Shi, L., Guan, T., Li, D., Yang, Y., Wang, X., … Xie, W. (2018). Optimization of a quantum weak measurement system with digital filtering technology. Applied Optics, 57(27), 7956–7966. doi: 10.1364/AO.57.007956
- Zhang, Y. J., Shi, L. X., Xu, Y., Zheng, X., Li, J. W., Wu, Q., … He, Y. H. (2019). Optical quantum weak measurement coupled with UV spectrophotometry for sensitively and non-separatedly detecting enantiopurity. Optics Express, 27(7), 9330–9342. doi: 10.1364/OE.27.009330
- Zhao, H. T., Feng, Y. Z., Chen, W., & Jia, G. F. (2019). Application of invasive weed optimization and least square support vector machine for prediction of beef adulteration with spoiled beef based on visible near-infrared (Vis-NIR) hyperspectral imaging. Meat Science, 151, 75–81. doi: 10.1016/j.meatsci.2019.01.010
- Zheng, X., Li, Y., Wei, W., & Peng, Y. (2019). Detection of adulteration with duck meat in minced lamb meat by using visible near-infrared hyperspectral imaging. Meat Science, 149, 55–62. doi: 10.1016/j.meatsci.2018.11.005