
 ?Mathematical formulae have been encoded as MathML and are displayed in this HTML version using MathJax in order to improve their display. Uncheck the box to turn MathJax off. This feature requires Javascript. Click on a formula to zoom.
ABSTRACT
In this study, we produced a specific monoclonal antibody (mAb) against triadimefon (TDF) and triadimenol (TDN). The half-maximal inhibitory concentration for TDF and TDN was 5.25 and 9.98 ng/mL, respectively, with a linear detection range (IC20–IC80) of 1.09–25.35 ng/mL and 2.29–43.61 ng/mL, respectively. Subsequently, we developed a colloidal gold immunochromatography test strip for the analysis of TDF and TDN in tomato. The results obtained from the colloidal gold immunochromatography test strip were in accordance with those obtained from the indirect competitive enzyme-linked immunosorbent assay. The colloidal gold immunochromatography test strip is efficient and suitable for on-site detection of TDF and TDN.
1. Introduction
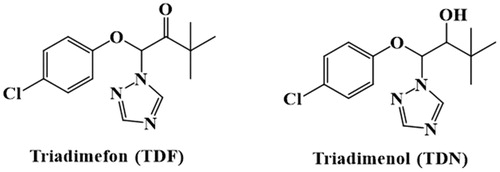
Triadimefon (TDF, [4-chlorophenoxy]-3, 3-dimethyl-1-[1H-1, 2, 4-triazol-1-yl] butan-2-one); (Paredes-Zuniga, Trost, De la Paz, Alcayaga, & Allende, Citation2019), is an efficient triazole fungicide (Reeves, Thiruchelvam, Richfield, & Cory-Slechta, Citation2004) that is used in the prevention and control of rust and powdery mildew in wheat, vegetables, fruit trees, and tobacco (Crowell, Henderson, Kenneke, & Fisher, Citation2011; Jie & Mei, Citation2015). In plants and fungi, TDF can be converted into triadimenol (TDN)(Kong, Li, Chen, Bao, Fan, & Francis Citation2016), which possesses comparatively higher fungicidal activity. The structures of TDF and TDN are shown in . TDF is absorbed by all parts of the plant, where it inhibits ergosterol biosynthesis (Zhang et al., Citation2020), mycelium growth, and spore formation. According to the literature, TDF and its metabolite TDN can lead to reproductive toxicity, genotoxicity, neurotoxicity, teratogenicity, and carcinogenicity in humans (Cao, Wang, Jiao, & Zhu, Citation2016; Hsu, Chiou, Hsu, Wang, & Chen, Citation2017; Lenkowski, Sanchez-Bravo, & McLaughlin, Citation2010; Liang et al., Citation2013; Yinghong, Jing, Mingrong, Qiang, & Hu, Citation2018).
Figure 1. The structural formula of triadimefon (TDF) and triadimenol (TDN).
The improper use of TDF may contribute to residues in food, posing a threat to human health. The Chinese National Food Safety Standard -Maximum Residue Limits for Pesticides in Food (GB 2763–2016) has established maximum residue limits for the sum of TDF and TDN in cereals (0.5 mg/kg in paddy, 0.2 mg/kg in wheat and 0.5 mg/kg in maize), vegetables (0.1 mg/kg in cucumber, 0.05 mg/kg in peas and 1 mg/kg in solanaceae vegetables), fruits (1 mg/kg in citrus and apple, 0.5 mg/kg in pear, 0.7 mg/kg in strawberry and 0.2 mg/kg in fruits and melons), sugars (0.1 mg/kg in beet), and beverages (0.5 mg/kg in coffee bean). Therefore, it is of utmost importance to detect TDF and TDN in foods.
Currently, there are several methods for the analysis and identification of TDF and TDN, such as gas chromatography GC; (Morais, Rodrigues, Queiroz, Neves, & Morais, Citation2014), supercritical fluid chromatography (Mai et al., Citation2019), gas chromatography-flame ionization detection (Li, He, Chen, & Hu, Citation2019), GC-tandem mass spectrometry GC-MS/MS; (Hou, Han, Dai, Yang, & Yi, Citation2013), high-performance liquid chromatography HPLC;(Kadivar & Aliakbar, Citation2019), HPLC-MS/MS; (Li et al., Citation2017; Yao et al., Citation2015), and liquid chromatography-MS/MS LC-MS/MS; (LC-MS/MS); (Liang et al., Citation2012). These methods are accurate and allow the simultaneous detection of multiple compounds; however, they require expensive equipment and trained professionals. In addition, the samples used for instrument detection require complex pretreatment steps, which are cumbersome and time-consuming. Therefore, these methods are unsuitable for on-site rapid detection applications or for a high number of samples.
The colloidal gold immunochromatography assay (CGIA) is a novel in vitro diagnostic technique, which is based on the enzyme-linked immunosorbent assay (ELISA), monoclonal antibody technology, and immune CG technique. CGIA is simple, fast, and suitable for on-site detection and does not require complex operation skills or expensive equipment. Additionally, the results can be visualized with the naked eye (Xu et al., Citation2017; Zuo, Jiao, Zhu, & Ding, Citation2018). CGIA has rarely been used for the detection of TDF and TDN residues in vegetables. In this study, we prepared a monoclonal antibody (mAb) against TDF and TDN and developed CGIA for the rapid detection of these fungicidal agents in tomato.
2. Materials and methods
2.1. Reagents and materials
The standards triadimefon, triadimenol, cyproconazole, epoxiconazol, propiconazole, hexaconazole, diniconazole, myclobutanil, bitertanol, and tebuconazole were purchased from J&K Scientific Ltd. (Beijing, China). Bovine serum albumin (BSA), ovalbumin (OVA), 1-(3-dimethylaminopropyl)-3-ethylcarbodiimide hydrochloride (EDC), 1-hydroxypyrrolidine-2, 5-dione (NHS), (HRP)-labelled goat anti-mouse IgG, and chloroacetic acid sodium salt were acquired from Sigma-Aldrich (St. Louis, MO, USA). Other reagents were obtained from the National Pharmaceutical Group Chemical Reagent Co., Ltd (Shanghai, China). A nitrocellulose (NC) high-flow-plus membrane (Pura-bind RP) was supplied by Whatman-Xinhua Filter Paper Co. (Hangzhou, China). Polyvinylchloride (PVC) backing cards, sample pads (CB-SB08), and absorption pads (SX18) were purchased from Goldbio Tech Co. (Shanghai, China).
2.2. Experimental animals
BALB/c mice were obtained from Vital River Laboratory Animal Technology Co., Ltd. (Beijing, China). All animal studies were performed according to institutional ethical guidelines and approved by the Committee on Animal Welfare of Jiangnan University. The animal welfare and ethics audit number was JN.No20180930b1001220 [205].
2.3. Synthesis of TDF hapten
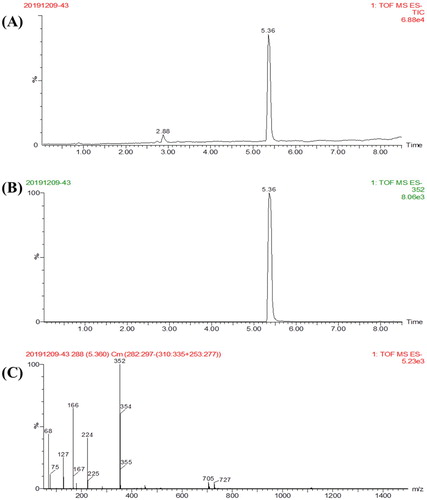
The synthesis of the TDF hapten is shown in . Briefly, solution A was obtained by dissolving sodium chloroacetate and sodium carbonate anhydrous in 2 mL pure water, and solution B was obtained by dissolving TDN in 95% ethanol. Solution A was slowly added to solution B and stirred at room temperature for 10 h, resulting in solution C. Solution C was filtered, and the filtrate was dried in a water bath at 80 °C and evaporated to dryness. The resulting sediment was stored at 4 °C and analyzed by LC-MS ().
Figure 2. Synthesis of TDF hapten.
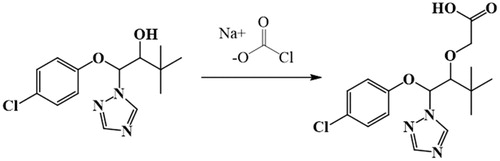
Figure 3. Identification of the molecular structure of TDF hapten: (A) total ion chromatogram (TIC) of TDF hapten; (B) extract ion chromatogram (EIC) of TDF hapten; (C) mass spectrum of TDF hapten.
2.4. Synthesis of immunogen and coating antigen
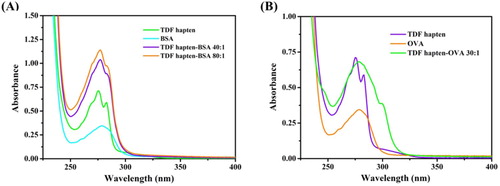
TDF hapten-BSA (immunogen) and TDF hapten-OVA (coating antigen) were produced by the carbodiimide method (C. Wang et al., Citation2017). Briefly, 6.3 mg TDF hapten was dissolved in 400 μL DMF. Then 6.2 mg NHS and 10.3 mg EDC were added dropwise. The solution was stirred for 6 h at room temperature, and subsequently added dropwise into two brown bottles containing 10 mg BSA in 3 mL borate saline buffer (BB, 0.01 mol/L, pH 8.8) at 40:1 (n/n) and 80:1 (n/n). Meanwhile, 10 mg OVA dissolved in 3 mL BB was added to the hapten at 30:1 (n/n). The mixture was stirred overnight at room temperature and dialyzed six times against phosphate buffer (PBS, 0.01 mol/L, pH 7.4). The synthesis of TDF hapten-BSA and TDF hapten-OVA was confirmed by UV spectroscopy (Liu, Suryoprabowo, Zheng, Song, & Kuang, Citation2017) ().
Figure 4. The ultraviolet absorption spectrum of TDF hapten-BSA (A) and TDF hapten-OVA (B).
2.5. Immunization of mice
The preparation of mAb against TDF and TDN was performed as described elsewhere (Oplatowska-Stachowiak et al., Citation2016). BALB/c female mice of 6–8 weeks of age were fed for two weeks. After adapting to the environment, the mice were immunized on the neck and back with 100 μg immunogen mixed with an equal volume of complete Freund’s adjuvant. The time intervals between the first immunization and booster immunizations (half dose of immunogen mixed with incomplete Freund’s adjuvant) were 3, 6, 9, and 12 weeks. Seven days after the third immunization, antisera of mice were collected by tail-cutting and analyzed by indirect competitive ELISA (ic-ELISA). The mouse with the highest titre and optimum inhibition was injected with only immunogen (half dose) by intraperitoneal injection.
2.6. Cell fusion and preparation of mAb against TDF and TDN
Mouse spleen cells and myeloma cells sp2/0 were fused by PEG (50% w/v, average mol wt 1450) at 10:1. The hybridoma cell lines were screened using selective medium (RPMI Medium 1640 basic containing L-glutamine and supplemented with 10% FBS [v/v], 10,000 U/mL penicillin, 10,000 μg/mL streptomycin, and 2% [v/v] HAT). After sub-cloning three times with HT medium (RPMI Medium 1640 basic containing L-glutamine supplemented with 20% FBS [v/v], 10,000 U/mL penicillin, 10,000 μg/mL streptomycin, and 2% [v/v] HAT), several strains of hybridoma cell lines secreting mAb against TDF were obtained. MAbs were produced in large scale by in vivo induction. The hybridoma cells were inoculated into the abdominal cavity of mice for ascites production. The ascites were purified by the octanoic acid-saturated ammonium sulfate method (Wang et al., Citation2016). MAbs against TDF and TDN were dialyzed at 4 °C against PBS (0.01 mol/L, pH 7.4).
2.7. Characterization of ic-ELISA
2.7.1. Establishment of ic-ELISA
Ic-ELISA was carried out as previously reported (Guan et al., Citation2015; D. Kong, Xie, et al., Citation2017). The coating antigen (TDF hapten-OVA) diluted in coating buffer (CB, 0.05 mol/L carbonate bicarbonate, pH 9.6, 100 μL per well) was added to 96-well plates. The plates were incubated for 2 h at 37 °C, washed three times, and blocked with 200 μL blocking buffer (0.2% gelatin in 0.05 mol/L CB, pH 9.6) per well. Following incubation for 2 h at 37 °C, the plates were washed three times, and 50 μL of mAb and 50 μL of TDF standard were added. The plates were incubated for 30 min at 37 °C and washed. Goat anti-mouse antibody (3,000 fold dilution) was added into each well (100 μL per well) and incubated for 30 min at 37 °C. The plates were washed three times, and 100 μL of the substrate buffer was added into each well and incubated for 15 min at 37 °C. The reaction was terminated with stop solution (2 mol/L concentrated sulfuric acid, 50 μL per well). Absorbance at 450 nm was measured using a microplate reader.
2.7.2. Optimization of ic-ELISA
We evaluated pH (4.0, 6.0, 7.4, 8.8, and 9.6) of the coating buffer and ionic strength (0%, 0.4%, 0.8%, 1.6%, and 3.2%, w/v) and DMF content (0%, 2%, 4%, 8%, and 10%) of the standard diluent.
2.7.3. Sensitivity and specificity of mAb
MAb sensitivity and specificity against TDF and TDN were determined by ic-ELISA (Lin et al., Citation2019; Wang et al., Citation2019). A series of TDF and TDN standard solutions of different concentrations were used to generate a standard curve. Origin software (OriginLab Corporation, Northampton, Massachusetts, USA.) was used for S-type fitting and calculation of half-maximal inhibitory concentration (IC50). The specificity of mAb against TDF and TDN was evaluated by cross reactivity (CR). Structural analogues were selected for the determination of CR by ic-ELISA. CR was calculated by the following equation, CR (%) = (IC50 of TDF/IC50 of the structural analogue) × 100%.
2.8. Characterization of the CG test strip
2.8.1. Preparation of CG-labeled mAb (CG-mAb)
CG-mAb was prepared as described elsewhere (Hua et al., Citation2010; Suryoprabowo, Liu, Kuang, Cui, & Xu, Citation2020). CG with a diameter ranging from 18 nm to 20 nm was synthesized by trisodium citrate reduction. Chloroauric acid solution (1%, 1 mL) was added to 99 mL ultrapure water, stirred, and heated to boiling. Subsequently, 1.5 mL of 1.0% trisodium citrate solution was added under constant heating and stirring. When the colour changed from light yellow to orange red, the heating process was continued for another 15 min under constant stirring. After cooling to room temperature, the CG solution was stored at 4 °C.
2.8.2. Assembly of the CG test strip
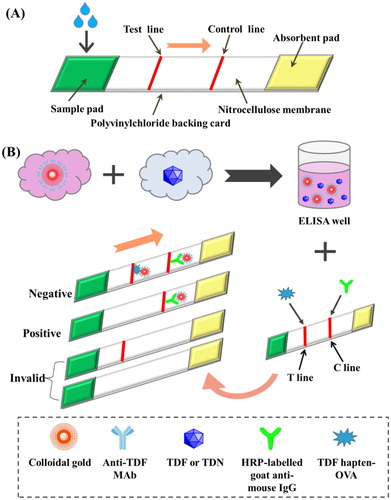
As shown in , the CG test strip consists of a sample pad, NC membrane, and absorbent pad, which are connected with each other from top to bottom and pasted on a PVC bottom plate. The assembly of the CG test strip was carried out as previously reported (Guo, Xu, Song, Liu, & Kuang, Citation2017; Zvereva, Zherdev, Xu, & Dzantiev, Citation2018). The sample pad was treated with PBS (0.01 mol/L, pH 7.4, containing 1% BSA, 0.2% Tween 20, and 1% sucrose, w/v). The sample pad was dried at 37 °C. TDF hapten-OVA and HRP-labelled goat anti-mouse IgG were sprayed onto the NC membrane at the test line (T-line) and control line (C-line), respectively.
Figure 5. (A) The composition of colloidal gold test strip; (B) Principle of the CG test strip.
2.8.3. Principle of the CG test strip
The sample solution mixed with CG-mAb was added to the sample pad, which migrated slowly to the absorption pad via capillary action. As shown in , in negative samples, CG-mAb was captured by the coating antigen (TDF-hapten OVA) on the T-line, resulting in a deep red colour. In positive samples, CG-mAb formed a complex with TDF or TDN in the sample solution as opposed to being captured by TDF hapten-OVA, resulting in a weak red or colourless T-line. Both CG-mAb and CG-mAb combined with TDF or TDN may be captured by HRP-labelled goat anti-mouse IgG on the C-line, resulting in a red C-line. The results can be visualized with the naked eye.
2.8.4. Sensitivity of the CG test strip
The CG test strip can be used for semi-quantitative analyses. A series of TDF and TDN standard solutions of different concentrations were analyzed using the CG test strip. The colour change of the T-line can be observed with the naked eye. Limit of detection (LOD) was defined as the analyte concentration that resulted in a T-line colour that was weaker than that of the negative sample. The cut-off value was defined as the analyte concentration that resulted in the disappearance of the T-line.
2.9. Sample pretreatment
Tomato, purchased from a local supermarket, was confirmed to be TDF- and TDN-negative by LC-MS/MS. Lycopene, which is present in tomato, affects the results. Additionally, lycopene is insoluble in methanol. Therefore, to minimize matrix interference, methanol was used to extract lycopene. The sample was rinsed, cut into pieces, and ground. After homogenization, 2.0 g of sample was weighed into multiple 50-mL centrifuge tubes, and TDF, TDN, or TDF mixed with TDN (1:1, w/w) at 0, 10, 25, 50, 100, and 250 ng/g was added. Methanol (10 mL) was added into the mixture, which was vortexed for 2 min and centrifuged at 5,000 × g for 8 min. The precipitate was discarded, and the supernatant was dried under a stream of nitrogen and mixed with PBST (0.01 mol/L PBS containing 0.5% Tween-20, pH 7.4) for CG test strip analysis.
3. Results and discussion
3.1. Verification of hapten
TDF is an incomplete antigen of small molecular weight that has no immunogenicity. A connecting arm with active carboxyl group was derived from the hydroxyl group of TDF. For the TDF hapten, we calculated m/z of C16H20ClN3O4; the exact mass was 353.11. For [M + H]−, m/z was 352 (), 1H NMR (400 MHz, Methanol-d4) δ 8.72 (s, 1H), 8.06 (s, 1H), 7.30–7.22 (m, 2H), 7.01–6.92 (m, 2H), 6.41 (d, J = 5.2 Hz, 1H), 4.24 (d, J = 15.9 Hz, 1H), 4.04 (d, J = 15.9 Hz, 1H), 3.76 (d, J = 5.2 Hz, 1H), 0.96 (s, 9H).
3.2. Characterization of antigen
A shows that there were two characteristic absorption peaks for TDF hapten-BSA at approximately 275 nm and 280 nm, which were the same as those of TDF. The peak shape of the TDF hapten-BSA was wider than that of TDF hapten because of the characteristic absorption of BSA at 278 nm. Therefore, the antigen was successfully synthesized. (B) shows that TDF hapten-OVA possessed the same characteristic absorption peak of TDF and had a red shift. The peak shape of TDF hapten-OVA was considerably wider, confirming the successful synthesis of the coating antigen.
3.3. Establishment and optimization of ic-ELISA
Following the third immunization, the titre and inhibition of mouse antiserum were screened by ic-ELISA. The mouse immunized with TDF hapten-BSA with a titre 1:243,000 and an IC50 100 ng/mL was selected for cell fusion (). After three subclones, the best hybridoma cell line was screened and used in further analyses.
Table 1. The titres and inhibition of antisera screened by ic-ELISA.
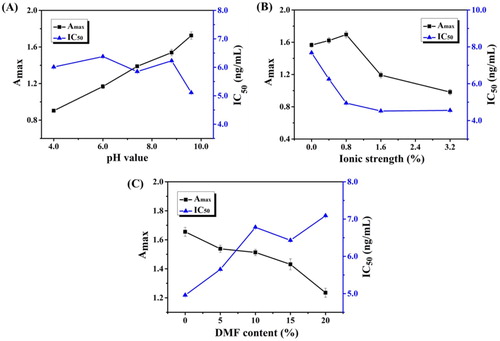
The pH of the coating buffer and the ionic strength and DMF content of the standard diluent were evaluated for ic-ELISA optimization. Ionic strength and pH affect the titer and IC50 of antibodies by affecting coating efficiency and specific binding between antigen and antibody. The combination of coating antigen and solid-phase carrier is based on physical adsorption and hydrophobic interactions. When the pH value of the coating buffer was higher than the isoelectric point (pI) of the protein (OVA, pI = 4.5), the hydrophobic groups of the protein become exposed, increasing the binding efficiency of coating antigen and solid-phase carrier. The pH results are shown in A; mAb titre increased with increasing pH of the coating buffer. Meanwhile, the lowest IC50 was obtained at pH 9.6. Therefore, the coating buffer was adjusted to pH 9.6. The appropriate concentration of electrolyte leads to the aggregation of antigen–antibody complexes and to agglutination or precipitation. Salting out occurs at a high electrolyte concentration. Based on the Amax value and IC50, an ionic strength of 0.8% was selected (B). The solubility of analyte was greater in DMF than in PBS; therefore, the DMF content was optimized. As shown in C, with increasing DMF concentration, titre (Amax value) and sensitivity gradually decreased. Therefore, a standard diluent without DMF was used. Therefore, the optimal conditions were coating buffer pH 9.6, ionic strength of 0.8%, and standard diluent without DMF.
Figure 6. The optimization of ic-ELISA: (A) the pH (4.0, 6.0, 7.4, 8.8 and 9.6) of coating buffer; (B) the ionic strength (0%, 0.4%, 0.8%, 1.6% and 3.2%, w/v); (C) DMF content (0%, 2%, 4%, 8% and 10%) of the standard diluent.
3.4. Characterization of mAb
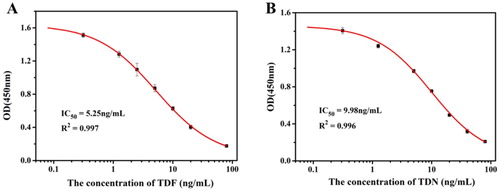
(A and B) show the indirect competition inhibition curves for ic-ELISA under optimized condition. The equations of the standard curves were the following, (for TDF) and
(for TDN). The linear regression correlation coefficients (R2) were 0.997 and 0.996, IC50 values were 5.25 and 9.98 ng/mL, and the linear range of detection (IC20–IC80) were 1.09–25.35 ng/mL and 2.29–43.61 ng/mL, respectively.
Figure 7. The indirect competition inhibition curves of TDF (A) and TDN (B).
The structural formulas of several triazole fungicides (e.g. cyproconazole, propiconazole, hexaconazole, diniconazole, myclobutanil, bitertanol, and tebuconazole) similar to TDF and TDN are presented in . The CR values obtained from ic-ELISA are shown in . As expected, CR for TDF and TDN were high (100% and 50%, respectively), but comparatively low for other triazole fungicides (< 2%). The results revealed that mAb had high specificity.
Table 2. The detection of cross reaction by ic-ELISA.
3.5. Analysis of tomato samples using the CG test strip
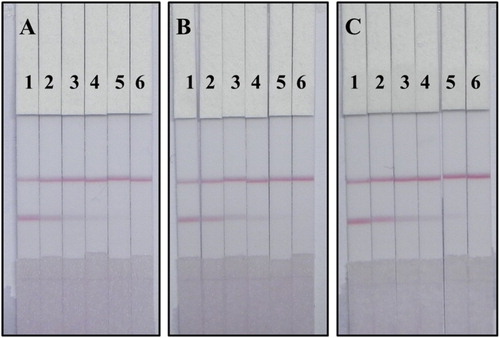
To verify the practicability of the CG test strip, tomato samples were spiked with different concentrations (0, 10, 25, 50, 100, and 250 ng/g) of TDF, TDN, or TDF mixed with TDN (1:1). As shown in (A and B), the colour of the T-line changed at 10 ng/g and disappeared at 250 ng/g for both TDF and TDN. Therefore, LOD was 10 ng/g and the cut-off value was 250 ng/g for both TDF and TDN. The sample was considered to be a weak positive at 10–250 ng/g TDF and a positive sample at ≥ 250 ng/g TDF. In this study, tomato samples were spiked with the mixed standards. C shows that the cut-off value and LOD of the mixed standards were 250 and 10 ng/g, respectively. Therefore, the sample was considered to be a weak positive at 10–250 ng/g mixed standard and a positive sample at ≥ 250 ng/g mixed standard.
Figure 8. Images of TDF and TDN detection by CG test strip in tomato sample: (A) tomato sample spiked with TDF; (B) tomato sample spiked with TDN; (C) tomato sample spiked with TDF mixed with TDN (1:1, w/w). A series of tomato samples spiked with TDF and TDN were tested by colloidal gold test strip: 1 = 0 ng/g, 2 = 10 ng/g, 3 = 25 ng/g, 4 = 50 ng/g, 5 = 100 ng/g and 6 = 250 ng/g.
3.6. Verification by ic-ELISA
To verify the reliability of the CG test strip results, the tomato samples spiked with TDF, TDN, or TDF mixed with TDN were analyzed by ic-ELISA. As shown in , each sample was analyzed in triplicate. The recovery rates of TDF, TDN, and mixed standards were 82.0%–89.6%, 90.6%–93.5%, and 87.5%–93.2%, respectively. The results obtained from ic-ELISA were consistent with those obtained from the CG test strip. In addition, the CG test strip results can be obtained within 8 min. Compared to ic-ELISA, CGIA is more suitable for on-site inspection and screening of a high number of samples.
Table 3. Analysis of TDF, TDN and TDF mixed TDN in tomato sample by ic-ELISA and CG test strip (n = 3).
4. Conclusions
In this study, we produced a highly sensitive mAb against TDF and TDN from TDF hapten-BSA (antigen) and TDF hapten-OVA (coating antigen). Subsequently, we developed ic-ELISA and CGIA for the detection of TDF and TDN in tomato. The two methods provided consistent results. CGIA is suitable for detecting TDF and TDN in samples.
Acknowledgements
This work is financially supported by National Key R&D Program (2018YFC1602604).
Disclosure statement
No potential conflict of interest was reported by the authors.
Additional information
Funding
References
- Cao, C., Wang, Q., Jiao, F., & Zhu, G. (2016). Impact of co-exposure with butachlor and triadimefon on thyroid endocrine system in larval zebrafish. Experimental and Toxicologic Pathology, 68(8), 463–469. doi: 10.1016/j.etp.2016.07.004
- Crowell, S. R., Henderson, W. M., Kenneke, J. F., & Fisher, J. W. (2011). Development and application of a physiologically based pharmacokinetic model for triadimefon and its metabolite triadimenol in rats and humans. Toxicology Letters, 205(2), 154–162. doi: 10.1016/j.toxlet.2011.05.1036
- Guan, D., Guo, L., Liu, L., Kong, N., Kuang, H., & Xu, C. (2015). Development of an ELISA for nitrazepam based on a monoclonal antibody. Food and Agricultural Immunology, 26(5), 611–621. doi: 10.1080/09540105.2014.998637
- Guo, L., Xu, L., Song, S., Liu, L., & Kuang, H. (2017). Development of an immunochromatographic strip for the rapid detection of maduramicin in chicken and egg samples. Food and Agricultural Immunology, 29(1), 458–469. doi: 10.1080/09540105.2017.1401045
- Hou, X., Han, M., Dai, X., Yang, X., & Yi, S. (2013). A multi-residue method for the determination of 124 pesticides in rice by modified QuEChERS extraction and gas chromatography-tandem mass spectrometry. Food Chemistry, 138(2-3), 1198–1205. doi: 10.1016/j.foodchem.2012.11.089
- Hsu, L. S., Chiou, B. H., Hsu, T. W., Wang, C. C., & Chen, S. C. (2017). The regulation of transcriptome responses in zebrafish embryo exposure to triadimefon. Environmental Toxicology, 32(1), 217–226. doi: 10.1002/tox.22227
- Hua, X., Qian, G., Yang, J., Hu, B., Fan, J., Qin, N., … Liu, F. (2010). Development of an immunochromatographic assay for the rapid detection of chlorpyrifos-methyl in water samples. Biosensors & Bioelectronics, 26(1), 189–194. doi: 10.1016/j.bios.2010.06.005
- Jie, L., & Mei, S. (2015). Control efficiency of 36% carbendazim triadimefon SC on wheat powdery mildew and pink mold. J Plant Diseases and Pests, 6(01), 28–30.
- Kadivar, M., & Aliakbar, A. (2019). A new composite based on graphene oxide-poly 3-aminophenol for solid-phase microextraction of four triazole fungicides in water and fruit juices prior to high-performance liquid chromatography analysis. Food Chemistry, 299, 125127. doi: 10.1016/j.foodchem.2019.125127
- Kong, D., Xie, Z., Liu, L., Song, S., Kuang, H., & Xu, C. (2017). Development of ic-ELISA and lateral-flow immunochromatographic assay strip for the detection of vancomycin in raw milk and animal feed. Food and Agricultural Immunology, 28(3), 414–426. doi: 10.1080/09540105.2017.1293014
- Kong, Z., Li, M., Chen, J., Bao, Y., Fan, B., & Francis, F. (2016) Processing factors of triadimefon and triadimenol in barley brewing based on response surface methodology. Food Control, 64, 81–86. doi: 10.1016/j.foodcont.2015.12.021
- Lenkowski, J. R., Sanchez-Bravo, G., & McLaughlin, K. A. (2010). Low concentrations of atrazine, glyphosate, 2, 4-dichlorophenoxyacetic acid, and triadimefon exposures have diverse effects on Xenopus laevis organ morphogenesis. Journal of Environmental Sciences, 22(9), 1305–1308. doi: 10.1016/S1001-0742(09)60254-0
- Li, D., He, M., Chen, B., & Hu, B. (2019). Magnetic porous organic polymers for magnetic solid-phase extraction of triazole fungicides in vegetables prior to their determination by gas chromatography-flame ionization detection. Journal of Chromatography A, 1601, 1–8. doi: 10.1016/j.chroma.2019.04.062
- Li, J., Chang, J., Li, W., Guo, B., Li, J., & Wang, H. (2017). Disruption of sex-hormone levels and steroidogenic-related gene expression on Mongolia Racerunner (Eremias argus) after exposure to triadimefon and its enantiomers. Chemosphere, 171, 554–563. doi: 10.1016/j.chemosphere.2016.12.096
- Liang, H., Li, L., Qiu, J., Li, W., Yang, S., Zhou, Z., & Qiu, L. (2013). Stereoselective transformation of triadimefon to metabolite triadimenol in wheat and soil under field conditions. Journal of Hazardous Materials, 260, 929–936. doi: 10.1016/j.jhazmat.2013.06.046
- Liang, H., Qiu, J., Li, L., Li, W., Zhou, Z., Liu, F., & Qiu, L. (2012). Stereoselective separation and determination of triadimefon and triadimenol in wheat, straw, and soil by liquid chromatography-tandem mass spectrometry. Journal of Separation Science, 35(1), 166–173. doi: 10.1002/jssc.201100365
- Lin, L., Wu, X., Luo, P., Song, S., Zheng, Q., & Kuang, H. (2019). IC-ELISA and immunochromatographic strip assay based monoclonal antibody for the rapid detection of bisphenol S. Food and Agricultural Immunology, 30(1), 633–646. doi: 10.1080/09540105.2019.1612330
- Liu, L., Suryoprabowo, S., Zheng, Q., Song, S., & Kuang, H. (2017). Development of an immunochromatographic strip for detection of acetamiprid in cucumber and apple samples. Food and Agricultural Immunology, 28(5), 767–778. doi: 10.1080/09540105.2017.1312294
- Mai, B., Fan, J., Jiang, Y., He, R., Lai, Y., & Zhang, W. (2019). Fast enantioselective determination of triadimefon in different matrices by supercritical fluid chromatography. Journal of Chromatography. B. Analytical Technologies in the Biomedical and Life Sciences, 1126-1127, 121740. doi: 10.1016/j.jchromb.2019.121740
- Morais, E. H. d. C., Rodrigues, A. A. Z., Queiroz, M. E. L. R. d., Neves, A. A., & Morais, P. H. D. (2014). Determination of thiamethoxam, triadimenol and deltamethrin in pineapple using SLE-LTP extraction and gas chromatography. Food Control, 42, 9–17. doi: 10.1016/j.foodcont.2014.01.024
- Oplatowska-Stachowiak, M., Sajic, N., Xu, Y., Haughey, S. A., Mooney, M. H., Gong, Y. Y., … Elliott, C. T. (2016). Fast and sensitive aflatoxin B1 and total aflatoxins ELISAs for analysis of peanuts, maize and feed ingredients. Food Control, 63, 239–245. doi: 10.1016/j.foodcont.2015.11.041
- Paredes-Zuniga, S., Trost, N., De la Paz, J. F., Alcayaga, J., & Allende, M. L. (2019). Behavioral effects of triadimefon in zebrafish are associated with alterations of the dopaminergic and serotonergic pathways. Progress in Neuro-Psychopharmacology & Biological Psychiatry, 92, 118–126. doi: 10.1016/j.pnpbp.2018.12.012
- Reeves, R., Thiruchelvam, M., Richfield, E. K., & Cory-Slechta, D. A. (2004). The effect of developmental exposure to the fungicide triadimefon on behavioral sensitization to triadimefon during adulthood. Toxicology and Applied Pharmacology, 200(1), 54–63. doi: 10.1016/j.taap.2004.03.020
- Suryoprabowo, S., Liu, L., Kuang, H., Cui, G., & Xu, C. (2020). Gold immunochromatographic assay for simultaneous detection of sibutramine and sildenafil in slimming tea and coffee. Sci China Mater. doi: 10.1007/s40843-019-1228-2
- Wang, C., Li, X., Peng, T., Wang, Z., Wen, K., & Jiang, H. (2017). Latex bead and colloidal gold applied in a multiplex immunochromatographic assay for high-throughput detection of three classes of antibiotic residues in milk. Food Control, 77, 1–7. doi: 10.1016/j.foodcont.2017.01.016
- Wang, W., Liu, L., Song, S., Xu, L., Kuang, H., Zhu, J., & Xu, C. (2016). Gold nanoparticle-based strip sensor for multiple detection of twelve Salmonella strains with a genus-specific lipopolysaccharide antibody. Sci China Mater, 59(8), 665–674. doi: 10.1007/s40843-016-5077-0
- Wang, Z., Zhang, J., Liu, L., Wu, X., Kuang, H., Xu, C., & Xu, L. (2019). A colorimetric paper-based sensor for toltrazuril and its metabolites in feed, chicken, and egg samples. Food Chemistry, 276, 707–713. doi: 10.1016/j.foodchem.2018.10.047
- Xu, R., Feng, J., Hong, Y., Lv, C., Zhao, D., Lin, J., … Zhu, C. (2017). A novel colloidal gold immunochromatography assay strip for the diagnosis of schistosomiasis japonica in domestic animals. Infectious Diseases of Poverty, 6(1), 84. doi: 10.1186/s40249-017-0297-z
- Yao, Z., Li, X., Miao, Y., Lin, M., Xu, M., Wang, Q., & Zhang, H. (2015). Simultaneous enantioselective determination of triadimefon and its metabolite triadimenol in edible vegetable oil by gel permeation chromatography and ultraperformance convergence chromatography/tandem mass spectrometry. Analytical and Bioanalytical Chemistry, 407(29), 8849–8859. doi: 10.1007/s00216-015-9046-y
- Yinghong, L., Jing, H., Mingrong, Q., Qiang, W., & Hu, Z. (2018). Degradation of triadimefon and residue behaviors of metabolite triadimenol: Tracing rapeseed from harvesting, storage to household oil processing. %J Journal of the science of food and agriculture. Journal of the Science of Food and Agriculture, 99, 1484–1491.
- Zhang, W., Deng, Y., Chen, L., Zhang, L., Wang, Z., Liu, R., … Zhou, Z. (2020). Effect of triadimefon and its metabolite on adult amphibians Xenopus laevis. Chemosphere, 243. doi: 10.1016/j.chemosphere.2019.125288
- Zuo, J. Y., Jiao, Y. J., Zhu, J., & Ding, S. N. (2018). Rapid detection of severe fever with Thrombocytopenia Syndrome Virus via colloidal gold immunochromatography assay. ACS Omega, 3(11), 15399–15406. doi: 10.1021/acsomega.8b02366
- Zvereva, E. A., Zherdev, A. V., Xu, C., & Dzantiev, B. B. (2018). Highly sensitive immunochromatographic assay for qualitative and quantitative control of beta-agonist salbutamol and its structural analogs in foods. Food Control, 86, 50–58. doi: 10.1016/j.foodcont.2017.11.003