
 ?Mathematical formulae have been encoded as MathML and are displayed in this HTML version using MathJax in order to improve their display. Uncheck the box to turn MathJax off. This feature requires Javascript. Click on a formula to zoom.
ABSTRACT
In this study, a high sensitivity and specificity monoclonal antibody (mAb) was developed based on the hydroxy and carboxy-termini of ochratoxin A (OTA). A fluorescent microsphere immunochromatographic test strip (FM-ICTS) was assembled for the rapid detection the OTA in rice flour. Some relevant parameters were optimized including the best concentration of coating antigen and optimal diluent buffer composition. Under optimal conditions, the strip assay had a visual limit of detection (LOD) of 2 ng/mL and a cut-off value of 16 ng/mL for OTA in rice flour samples. By means of a strip scan reader, we obtained a quantitative measurement for OTA with an LOD of 1.27 ng/mL. No significant difference in the strip test results was seen when compared to an ic-ELISA assay or LC–MS/MS. This also shows, therefore, that the FM-ICTS has potential application for rapid and accurate quantitative detection in the market place.
1. Introduction
Ochratoxin A (OTA) is a class of toxic secondary metabolites mainly produced by molds such as Aspergiltus Ochratoxin, Aspergiltus sulphureus, and Penicillium verrucosum. It is classified as a possible human carcinogen by the International Agency for Research on Cancer (IARC) (Luci et al., Citation2018). There are mainly nine different structural analogs, which can be divided into four types: A, B, C, and D according to the different groups. OTA is the most toxic and most common ochratoxin. It can become a major food safety issue due to its toxicity and epidemiology.
OTA has severe nephrotoxicity and hepatotoxicity, and can also cause immune toxicity, genotoxicity, neurotoxicity, embryonic toxicity and is a teratogen (Chen et al., Citation2020). It can be detected in many plants and processed products, such as coffee beans, cereals, corn, cocoa, wine and beer (Andrade & Lancas, Citation2017; Lv et al., Citation2017; Wang et al., Citation2016). Although OTA cannot be completely eliminated, we can reduce its harm to human health by controlling its content in foods. To avoid high levels of ochratoxin in raw materials and products, and protect consumers, the European Union has enacted laws requiring the limit of OTA in cereals to be 5–10 µg/kg (Guilan et al., Citation2018; Nimal Selvaraj et al., Citation2015). Whereas the acceptable limit found in infant foods is the most stringent, reaching 0.5 μg/kg (Cappozzo et al., Citation2017).
In order to detect OTA in food and raw materials, many methods have been widely used in market factories, including high-performance liquid chromatography (HPLC) (Turner et al., Citation2015; Yang et al., Citation2020), liquid chromatography-tandem mass spectrometry (LC-MS/MS) (Kai et al., Citation2017) and Raman spectroscopy (Li et al., Citation2017), sensitive sensor (He et al., Citation2019) and enzyme-linked immunosorbent assay (ELISA) (Elaridi et al., Citation2019). With the advent of rapidly ecvolving time-resolved fluorometry (TR-FIA) (Liu et al., Citation2019), there have been many fluorescent microsphere (FM) immunoassay experiments that have been performed using fluorescent microsphere beads as probe (Zhang et al., Citation2016; Zhang, Xu, et al., Citation2019). These methods have proved to be of high sensitivity and specificity. However, HPLC and LC-MS/MS are not only expensive instruments, but also require professional technicians to operate them (Wang et al., Citation2011). Raman spectroscopy is very time consuming, and requires disposal of radio isotopic waste and is not suitable for screening large numbers of samples. The ELISA is a colorimetric and quantitative method based on antigen-antibody conjugation, but it involves many complicated operational steps that must be conducted under strict conditions (Liu et al., Citation2019). Fluorescent immunochromatography, however, is a rapid analytical method that combines fluorescent microsphere labelling with immunochromatography (Shao et al., Citation2019). The antibody is chemically bound to the FM surface to provide a high degree of long-term stability in sample testing (Huang et al., Citation2017). Fluorescent immunochromatography is widely used in the food safety industry (Duan et al., Citation2017; Yang et al., Citation2018). The combination of FM and immunochromatographic test strip (ICTS) (FM-ICTS) and a fluorescence analyzer make it possible to quantitatively read and analyze fluorescence signals and avoids errors caused by visual observation. Furthermore, the concentration of analyte can be calculated by establishing a fitting curve (Wang et al., Citation2019).
Few studies have focused on a FM-ICTS against OTA. In this study, we developed a highly sensitive mAb against OTA. This mAb was used in the development of a FM-ICTS for the detection of OTA in rice flour.
2. Material and methods
2.1. Chemicals and apparatus
OTA was purchased from J&K Scientific (Beijing, China). Enzyme immunoassay-grade horseradish peroxidase (HRP) labelled goat anti-mouse immunoglobulin were obtained from Sigma-Aldrich (St. Louis, MO, USA). Bovine serum albumin (BSA) and keyhole-limpet haemocyanin (KLH) were purchased from Solarbio Science & Technology, Co, Ltd. (Beijing, China).
Goat anti-mouse immunoglobulin (IgG) antibody was purchased from Sigma-Aldrich (St Louis, MO, USA). Freund’s Complete adjuvant, Freund’s Incomplete adjuvant, N,N′′-carbonyldiimidazolen (CDI), 1-ethyl-3-(3-dimethylaminopropyl) carbodiimide (EDC), were obtained from Sigma-Aldrich (St. Louis, MO, USA). 2-(4-Morpholino)-ethanesulfonic acid (MES) and N-hydroxysuccinimide (NHS) were obtained from Aladdin Chemistry Co., Ltd. (Shanghai, China). Tetramethyl benzidine was purchased from Aladdin Chemistry Co., Ltd. (Shanghai, China). RPMI-1640 cell culture medium and fetal calf serum were purchased from Gibco BRL (Paisley, UK). Other reagents used for cell fusion were from Sunshine Biotechnology Co., Ltd. (Nanjing, China). All other reagents and chemicals were supplied by the National Pharmaceutical Group Chemical Reagent Co., Ltd. (Shanghai, China). All buffer solutions were prepared using ultrapure water (Milli-Q purification system, Millipore Co., Bedford, MA, USA).
FluoSpheres® Carboxylate-Modified Microspheres (0.2 mm, red fluorescent (580/605 nm, Ex/Em), 2% solids), were obtained from Invitrogen (Carlsbad, CA, USA). Nitrocellulose (NC) high-flow plus membranes (Pura-bind RP) were obtained from Whatman-Xinhua Filter Paper Co., Ltd. (Hangzhou, China). The sample pads (CFKJ-0328) and absorbent pads (CH37K) were supplied by Shanghai Liangxin Co., Ltd. (Shanghai, China). Polyvinylchloride (PVC) backing card was purchased from Kinbio Tech Co., Ltd. (Shanghai, China). The experimental procedures involving animals in this study were approved by the Animal Care Center of the Jiangnan University, Wuxi, China.
2.2. Preparation of haptens and antigens
Since OTA molecules have carboxyl and hydroxyl groups on their surface, different methods can be used to activate the surface carboxyl groups and couple them to the carrier protein (Marino-Repizo et al., Citation2017, Citation2015).
Synthesis of immunogen. involved the use of 1 mg of OTA dissolved in 200 µL of DMF solution containing 1.89 mg of EDC and 0.57 mg of NHS. The mixture was stirred at room temperature for 4 h in the dark. After the activation was completed, the reaction solution was added dropwise to a KLH solution (6 mg of KLH dissolved in 2 mL of 0.1 M carbonate-bicarbonate buffer; pH 9.6), and the reaction was stirred at room temperature for 6 h in the dark. The conjugated product was dialyzed using a 0.01 M PBS system for three days, and the dialysate was changed every 8 h. After the dialysis was complete, the immunogen was aliquoted and stored at −20°C.
Synthesis of coating antigen. 1 mg of OTA was dissolved in 200 µL of anhydrous DMSO solution containing 10 mg of CDI, and the mixture was stirred at 37°C in the dark for 4 h. After the activation was completed, 50 µL of ultrapure water was added to the reaction solution to stop the reaction. After the reaction was terminated, the reaction solution was added dropwise into a BSA solution (6 mg of BSA dissolved in 2 mL of 0.1 M carbonate-bicarbonate buffer; pH 9.6), and the reaction was stirred at room temperature for 4 h in the dark, without magnetic stirring. The conjugate product was dialyzed in a 0.01 M PBS system for 3 days, and the dialysate was changed every 8 h. After the dialysis was completed, the immunogen was aliquoted and stored at −20°C.
2.3. Monoclonal antibody (mAb) production and characterization
Fifteen eight weeks old BALB/c mice were divided into three groups with five mice in each group. The three groups of mice were immunized with synthetic immunogen according to the method described previously (Li et al., Citation2020). Immunization was performed every three weeks. After the third week, serum was collected from the tail vein of the mice and screened using an ic-ELISA to obtain positive animals (Mengyuan et al., Citation2019). The mice were immunized intraperitoneally 18 days after the last serum test. Three days later, the splenocytes from the positive mice were fused with myeloma cells as described previously (Chen et al., Citation2017). After multiple screening of subclones, the best cell line was selected and expanded, collected and injected into the abdominal cavity of the mouse. Seven days after injection, ascites were collected from the mice. One week after the injection, ascites were collected and purified by the caprylic-acid-ammonium sulphate precipitation method (Zhang, Liu, et al., Citation2019). After three days of dialysis in 0.01M PBS, the purified antibody was stored at −20°C.
The Specificity and sensitivity of the mouse mAbs were evaluated using indirect competition and the half-maximal inhibitory concentration (IC50) and the limit of detection (LOD) values were calculated using a standard curve. The cross-reactivity (CR) determines the specificity of the mAb, and was calculated by the following formula:
2.4. Fluorescent microsphere-mAb conjugates
Fluorescent microspheres on the modified carboxylate group should be used at approximately pH 5.0 (Majdinasab et al., Citation2015). The anti-OTA mAb was coupled to the FMs according to the carboxyl activation coupling method (Wang et al., Citation2019). Briefly, 100 µL of FMs were suspended in 400 ul of 0.05 M BB (pH 8.0). Thirty ul of EDC (10 mg/ml) was added and stirred for 15 min at room temperature to activate the carboxylic groups on the surface of the FMs. Then, the supernatant was removed by centrifugation (13,000 rcf, 10°C, 10 min), the lower precipitate was reconstituted with 0.05 M BB (pH 8.0) and sonicated for 1 min, and then 100 µL of antibody (diluted 0.5 mg/mL with 0.02M BB) was added. It was then placed on a shaker at room temperature for 2 h. To terminate the reaction, 15 mL of 1% BSA was added and incubated for 2 h at room temperature, and the mixture was centrifuged at 8500 rcf for 1 h at 4° C. The supernatant was removed and the lower precipitate was reconstituted with 0.05 M BB (pH 8.0). After repeated centrifugation and washing, the solution was sonicated for 1 min and kept at 4°C until used.
2.5. Assembly of the FM-ICTS
The FM-ICTS consisted of four parts, which included the sample pad, nitrocellulose (NC) membrane, absorption pad and polyvinylchloride (PVC) backing card. As described previously (Wang et al., Citation2017; Xie et al., Citation2019). The OTA-BSA (2 mg/mL) was then coated onto a NC membrane to prepare the T line for sample detection, and dried overnight at 37°C. Goat anti-mouse IgG antibodies were coated onto the NC membrane to prepare the C line for quality control. The NC membrane, sample pad and absorption pad were pasted onto the PVC backing card, and cut into test strips using a strip cutting machine.
2.6. Detection of OTA in samples
We bought rice flour from the local market and weighed 1 g into two 15 mL centrifuge tubes, one tube as a negative control and the other as a positive control. Next, we added 5 ml 20% PBST (PBS + 5% Tween) to the negative control, and 100 μL of OTA standard to the positive control with the addition of 5 mL 20% PBST (PBS + 5% Tween). After 5 min, the supernatant was centrifuged (4000 rcf, 10 min), and a series of optimizations were performed.
2.7. Test principle of the strip assay
The principle of the FM-ICTS is based on the use of OTA Standards and OTA-BSA competition with the FM labelled anti-OTA mAb, with an excitation wavelength of 580 nm and an emission wavelength of 605 nm. Briefly, 7 μL of FM-mAb and 43 μL of resuspension buffer were added to a 96-well microtiter plate, and 15 μl of the negative or positive samples was added and mixed for 3 min. Then the test strip was inserted into the corresponding well of the microtiter plate for 5 min. For negative samples, the free FM-mAb conjugate will bind to the coated antigen OTA-BSA at the T line, and the excess FM-mAb. The conjugation will be captured by the specific secondary anti-mouse antibody at the C line, and the C and T lines will be red. OTA Standards in the sample will bind to the FM-mAb conjugate, resulting in less fluorescence at the T line. The amount of fluorescence can be quantified using the strip reader to provide useful information about the fluorescence intensity, and all processes can be completed in 10 min.
3. Results and discussion
3.1. Hapten and antigen characterization
Although the OTA is a small molecule hapten, it contains both hydroxy-terminal and carboxy-terminal groups within its structure . It can be coupled to a carrier protein using the activated ester method and CDI method, giving rise to a specific response.
Figure 1. Chemical structure of OTA.

As shown in (a), the OTA molecule has maxima at 340 and 380 nm, the maxima of BSA is at 280 nm. The complete antigen of OTA after dialysis to remove free OTA molecules, (OTA-BSA) has an ultraviolet absorption reading between 300 and 400 nm, and the strongest absorption is at 380 nm. The maximal reading is at 280 nm because OTA is coupled with the BSA carrier protein.
Figure 2. The UV spectra of OTA, proteins and conjugates; (a) The UV spectra characterization for OTA, BSA, and OTA-BSA; (b) The UV spectra characterization for OTA, KLH, and OTA-KLH.
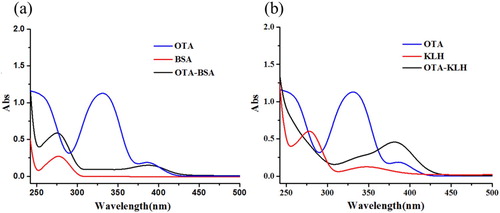
As shown in (b), the maxima for KLH is at 280 and 340 nm and OTA-KLH had an ultraviolet absorption between 280 nm and 300–400 nm, which masked the absorption peak of KLH, which is at 340 nm. The results show that the complete antigen had the characteristic peaks of OTA and carrier protein at the same time, and the coupling was successful.
3.2. Characterization of a mAb against OTA
In this experiment, the 3D6 cell line was used. The IC50 value of the mAb in the 3D6 cells was 0.052 ng/mL. The mAb sensitivity for 3D6 cells and specificity was tested by the ic-ELISA. Firstly, we diluted the antigen three times from 0.3 μg/mL. As shown in , an ic-ELISA was used to determine the sensitivity and specificity of the anti-OTA mAb. The LOD and IC50 of the antibody were calculated by plotting the relationship between the optical density (OD) and the concentration of OTA. The standard curve equation is y = 0.068 + 1.642/(1 + [x/0.0052]1.156), and the correlation coefficient (R2) was 0.998. We calculated the LOD and IC50 values to be 0.008 and 0.052 ng/mL using the standard curve. The specificity of this antibody is shown in , it can be seen that the mAb in 3D6 cells had different degrees of CR with each of the three ochratoxin compounds, but the crossover rate was not high.
Figure 3. Standard curve for OTA detection.
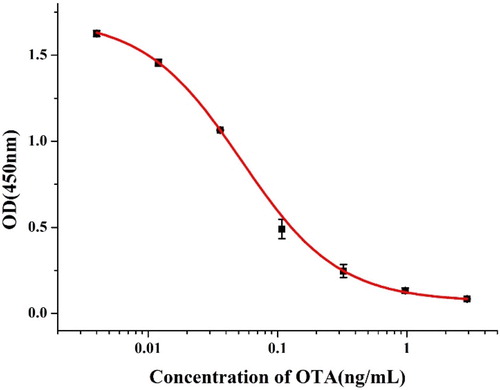
Table 1. Cross-reactivity of mAb 3D6 to four Ochratoxin.
3.3. Optimization of the FM-ICTS assay
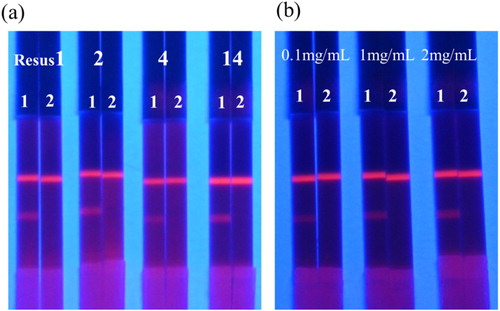
In order to be used as a reaction substrate in a FM-ICTS assay system, the applied material must be hydrophilic and have consistent flow characteristics. The NC membrane used as the supporting material for the receptor-analyte reaction is hydrophobic, but can be hydrophilic by using surfactants in the production of the sample pad because the surfactants can move along the sample pad toward the NC membrane due to capillarity action. Different surfactants make the flow rate of the NC film different; therefore, the selection of surfactant reagent is no guarantee of the success of the test. Typically, suspension buffers are composed of surfactant, protein protectant, and stabilizer. In this study, we optimized different surfactants (PEG, PVP, BSA and On-870). As shown in (a), when on-870 was selected, the OTA negative samples produced a dark red T line, while the remaining samples were light red or colourless. Therefore, on-870 was selected as the optimal surfactant. We optimized the concentration of OTA-BSA on the T line, which could affect the detection sensitivity of the ICTS. As shown in (b), the OTA-BSA concentration levels (0.1, 1, and 2 mg/mL) were evaluated by testing the 0 and 25 ng/mL OTA standards in rice noodle samples. The results showed that 2 mg/mL OTA-BSA contributed to deeper T0 lines and a satisfactory competitive response.
Figure 4. Optimization of conditions of test strip. (a) Result of using different surfactants (Resus1, 2, 4 and 14 represent PEG, PVP, BSA and On-870, respectively). 1 and 2 represent the OTA standard concentrations were 0 and 25 ng/mL, respectively, prepared in rice flour sample. (b) Optimization of the concentration of antigen on the T line by testing OTA standard prepared in rice flour sample. Each test was repeated thrice.
3.4. Sensitivity of the strip assay to rice flour
To test the sensitivity of the ICTS assay, we added different concentrations of OTA standards to the rice flour samples, including 0, 0.5, 1, 2, 4, 8, and 16 ng/mL, and as shown in (a), the fluorescence intensity decreased with an increase in OTA concentration in the standard sample. When the OTA concentration exceeds 16 ng/ml, the colour of the T line disappears.
Figure 5. Sensitivity test of strip. (a) Detection of OTA in rice flour samples using the FM-ICTS. (1 = 0 ng/mL, 2 = 0.5 ng/mL, 3 = 1 ng/mL, 4 = 2 ng/mL, 5 = 4 ng/mL, 6 = 8 ng/mL and 7 = 16 ng/mL). (b) The calibration curve obtained by a strip reader. The X-axis is shown as the concentrations of OTA; and the Y-axis is shown as the T/T0 value, which is defined as the ratio of the optical density of the positive sample to that of the negative sample.
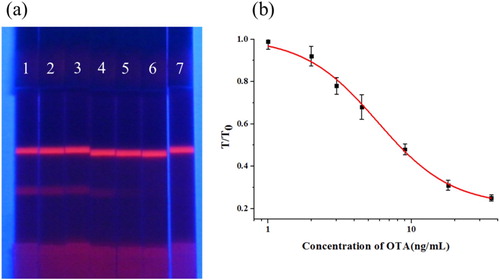
For quantitative detection, fluorescence intensity was detected by using a strip scan reader. T/T0 is defined as the ratio of the T line fluorescence intensity of a given positive sample to the T line fluorescence colour intensity of a negative sample, used to quantify the signal (Wang et al., Citation2020). The T/T0 value of each standard solution was plotted on the ordinate, and the corresponding concentration of the target chemical was plotted on the abscissa to establish a calibration curve. Using a band scanner, we obtained T/T0 values for unknown samples and calculated the concentration of OTA from the calibration curve. The LOD of the strip assay was defined as the concentration of OTA with 10% inhibition of the signal of the negative sample (Guo et al., Citation2019). From the curve shown in (b), the equation for the calibration curve was y = 0.214 + 0.793/(1 + [x/5.783]1.685), with an R2 of 0.997, and the LOD was calculated as 1.27 ng/mL. Compared with other methods, the strip assay could detect OTA with the same LOD more quickly and quantitatively. At present, rapid detection and quantitative detection of harmful substances in food are the main developmental directions in the field of food safety. Therefore, the FM-ICTS assay with accurate quantification and faster detection speed can become an effective tool for screening a large number of samples.
3.5. Analysis and comparison of OTA in rice flour sample
As shown in (a), the visual LOD for the FM-ICTS assay was 2 ng/mL, and the cut-off value was 16 ng/mL. If the concentration of OTA was ≤2 ng/mL, the T line cannot be identified from the control, and the sample was defined as negative (−). If the concentration of OTA in the sample was between 2 and 16 ng/mL, the T line colour was weaker than the control, and the sample was defined as weakly positive (±). If the concentration of OTA was ≥ 16 ng/mL, the T line was absent and the sample was defined as positive (+).
To characterize the test performance of the FM-ICTS assay for OTA, different concentrations of OTA (2, 4, 8, 16 ng/mL) were spiked into negative rice flour samples and tested using different methods (FM-ICTS, ic-ELISA and LC–MS/MS). As shown in , in rice flour samples, the results obtained using the FM-ICTS are consistent with those obtained by ic-ELISA and LC–MS/MS, and there are no significant differences between the three. In addition, the FM-ICTS assay can test samples faster than the ic-ELISA and LC–MS/MS methods because it uses a simplified detection method.
Table 2. Analysis of OTA in rice flour by ic-ELISA and LC–MS/MS and the FM-ICTS assay.
4. Conclusions
We successfully prepared monoclonal antibodies against OTA with high specificity and sensitivity, and then developed a FM-ICTS assay for the rapid quantitative detection of OTA in rice flour sample. We optimized the reaction conditions of the strip, including coating concentration and surfactants, for more accurate determination. For quantitative testing, we established a standard curve showing that the LOD of OTA in the rice flour sample was 1.27 ng/mL. In addition, the results measured by FM-ICTS were compared with those obtained by ic-ELISA and LC–MS/M, and the results were consistent with no significant differences between methods. Therefore, the FM-ICTS assay can be used for field monitoring of rice flour sample and other plant products.
Disclosure statement
No potential conflict of interest was reported by the author(s).
Additional information
Funding
References
- Andrade, M. A., & Lancas, F. M. (2017). Determination of ochratoxin A in wine by packed in-tube solid phase microextraction followed by high performance liquid chromatography coupled to tandem mass spectrometry. Journal of Chromatography A, 1493, 41–48. https://doi.org/10.1016/j.chroma.2017.02.053
- Cappozzo, J., Jackson, L., Lee, H. J., Zhou, W., Al-Taher, F., Zweigenbaum, J., & Ryu, D. (2017). Occurrence of ochratoxin A in infant foods in the United States. Journal of Food Protection, 80(2), 251–256. https://doi.org/10.4315/0362-028X.JFP-16-339
- Chen, R., Sun, Y., Huo, B., Yuan, S., Sun, X., Zhang, M., Yin, N., Fan, L., Yao, W., Wang, J., Han, D., Li, S., Peng, Y., Bai, J., Ning, B., Liang, J., & Gao, Z. (2020). Highly sensitive detection of ochratoxin A based on bio-barcode immunoassay and catalytic hairpin assembly signal amplification. Talanta, 208. https://doi.org/10.1016/j.talanta.2019.120405
- Chen, Y., Guo, L., Liu, L., Song, S., Kuang, H., & Xu, C. (2017). Ultrasensitive immunochromatographic strip for fast screening of 27 sulfonamides in honey and pork liver samples based on a monoclonal antibody. Journal of Agricultural and Food Chemistry, 65(37), 8248–8255. https://doi.org/10.1021/acs.jafc.7b03190
- Duan, H., Huang, X., Shao, Y., Zheng, L., Guo, L., & Xiong, Y. (2017). Size-dependent immunochromatographic assay with quantum dot nanobeads for sensitive and quantitative detection of ochratoxin A in corn. Analytical Chemistry, 89(13), 7062–7068. https://doi.org/10.1021/acs.analchem.7b00869
- Elaridi, J., Dimassi, H., & Hassan, H. (2019). Aflatoxin M1 and ochratoxin A in baby formulae marketed in Lebanon: Occurrence and safety evaluation. Food Control, 106. https://doi.org/10.1016/j.foodcont.2019.06.006
- Guilan, Z., Chao, Z., Yafei, H., Jiao, Y., & Ailiang, C. (2018). A lateral flow strip based aptasensor for detection of ochratoxin A in corn samples. Molecules, 23(2), 291. https://doi.org/10.3390/molecules23020291
- Guo, L., Liu, L., Cui, G., Ma, S., Wu, X., & Kuang, H. (2019). Gold immunochromatographic assay for kitasamycin and josamycin residues screening in milk and egg samples. Food and Agricultural Immunology, 30(1), 1189–1201. https://doi.org/10.1080/09540105.2019.1677567
- He, F., Zou, T., Yang, J., Wang, H., Deng, L., Tian, Y., Xu, Z., Sun, Y., Lei, H., Tan, X., & Shen, Y. (2019). Development of a skeleton-specific antibody and Au nanoparticle-based immunochromatographic sensor for simultaneous detection of various tadalafil adulterants in health food. Food and Agricultural Immunology, 30(1), 349–368. https://doi.org/10.1080/09540105.2019.1585417
- Huang, Z., Zhang, X., Zhang, X., Wang, S., Yang, B., Wang, K., Yuan, J., Tao, L., & Wei, Y. (2017). Synthesis of amphiphilic fluorescent copolymers with smart pH sensitivity via RAFT polymerization and their application in cell imaging. Polymer Bulletin, 74(11), 4525–4536. https://doi.org/10.1007/s00289-017-1969-3
- Kai, Z., Schaab, M. R., Southwood, G., Tor, E. R., Aston, L. S., Wenlu, S., Eitzer, B., Sanghamitra, M., Lapainis, T., Huy, M., Tran, K., El-Demerdash, A., Vega, V., Yanxuan, C., Wong, J. W., Krynitsky, A. J., & Begley, T. H. (2017). A collaborative study: Determination of mycotoxins in corn, peanut butter, and wheat flour using stable isotope dilution assay (SIDA) and liquid chromatography-tandem mass spectrometry (LC-MS/MS). Journal of Agricultural and Food Chemistry, 65(33), 7138–7152. https://doi.org/10.1021/acs.jafc.6b04872
- Li, S., Wu, X., Kuang, H., & Liu, L. (2020). Development of an ic-ELISA and an immunochromatographic strip assay for the detection of aconitine. Food and Agricultural Immunology, 31(1), 243–254. https://doi.org/10.1080/09540105.2020.1714555
- Li, Y., Liu, L., Song, S., & Kuang, H. (2017). Development of a gold nanoparticle immunochromatographic assay for the on-site analysis of 6-benzylaminopurine residues in bean sprouts. Food and Agricultural Immunology, 29(1), 14–26. https://doi.org/10.1080/09540105.2017.1354359
- Liu, Y., Ji, J., Cui, F., Sun, J., Wu, H., Pi, F., Zhang, Y., & Sun, X. (2019). Development of a two-step immunochromatographic assay for microcystin-LR based on fluorescent microspheres. Food Control, 95, 34–40. https://doi.org/10.1016/j.foodcont.2018.07.036
- Luci, G., Intorre, L., Ferruzzi, G., Mani, D., Giuliotti, L., Pretti, C., Tognetti, R., Bertini, S., & Meucci, V. (2018). Determination of ochratoxin A in tissues of wild boar (Sus scrofa L.) by enzymatic digestion (ED) coupled to high-performance liquid chromatography with a fluorescence detector (HPLC-FLD). Mycotoxin Research, 34(1), 1–8. https://doi.org/10.1007/s12550-017-0292-z
- Lv, L., Li, D. H., Cui, C. B., Zhao, Y. Y., & Guo, Z. J. (2017). Nuclease-aided target recycling signal amplification strategy for ochratoxin A monitoring. Biosensors & Bioelectronics, 87, 136–141. https://doi.org/10.1016/j.bios.2016.08.024
- Majdinasab, M., Sheikh-Zeinoddin, M., Soleimanian-Zad, S., Li, P., Zhang, Q., Li, X., Tang, X., & Li, J. (2015). A reliable and sensitive time-resolved fluorescent immunochromatographic assay (TRFICA) for ochratoxin A in agro-products. Food Control, 47, 126–134. https://doi.org/10.1016/j.foodcont.2014.06.044
- Marino-Repizo, L., Gargantini, R., Manzano, H., Raba, J., & Cerutti, S. (2017). Assessment of ochratoxin A occurrence in Argentine red wines using a novel sensitive quechers-solid phase extraction approach prior to ultra high performance liquid chromatography-tandem mass spectrometry methodology. Journal of the Science of Food and Agriculture, 97(8), 2487–2497. https://doi.org/10.1002/jsfa.8065
- Marino-Repizo, L., Kero, F., Vandell, V., Senior, A., Isabel Sanz-Ferramola, M., Cerutti, S., & Raba, J. (2015). A novel solid phase extraction–ultra high performance liquid chromatography-tandem mass spectrometry method for the quantification of ochratoxin A in red wines. Food Chemistry, 172, 663–668. https://doi.org/10.1016/j.foodchem.2014.09.094
- Mengyuan, G., Xiaoling, W., Shanshan, S., Qiankun, Z., Pengjie, L., Hua, K., Jiajia, S., & Liya, Y. (2019). Ultrasensitive anti-melamine monoclonal antibody and its use in the development of an immunochromatographic strip. Food and Agricultural Immunology, 30(1), 462–474. https://doi.org/10.1080/09540105.2019.1590318
- Nimal Selvaraj, J., Yan, W., Lu, Z., Yueju, Z., Fuguo, X., Xiaofeng, D., & Yang, L. (2015). Recent mycotoxin survey data and advanced mycotoxin detection techniques reported from China: A review. Food Additives & Contaminants: Part A, 32(4), 440–452. https://doi.org/10.1080/19440049.2015.1010185
- Shao, L., Zhang, L., Li, S., & Zhang, P. (2019). Design and quantitative analysis of cancer detection system based on fluorescence immune analysis. Journal of Healthcare Engineering, 2019. https://doi.org/10.1155/2019/1672940
- Turner, N. W., Bramhmbhatt, H., Szabo-Vezse, M., Poma, A., Coker, R., & Piletsky, S. A. (2015). Analytical methods for determination of mycotoxins: An update (2009–2014). Analytica Chimica Acta, 901, 12–33. https://doi.org/10.1016/j.aca.2015.10.013
- Wang, B., Wu, Y. Y., Chen, Y. F., Weng, B., Xu, L. Q., & Li, C. M. (2016). A highly sensitive aptasensor for OTA detection based on hybridization chain reaction and fluorescent perylene probe. Biosensors & Bioelectronics, 81, 125–130. https://doi.org/10.1016/j.bios.2016.02.062
- Wang, H., Guan, J., Liu, X., Shi, Y., Wu, Q., Luo, M., Zhu, Y., Wang, Z., Wang, L., & Pan, Y. (2019). Rapid detection of avian leukosis virus using a fluorescent microsphere immunochromatographic test strip assay. Poultry Science, 98(12), 6492–6496. https://doi.org/10.3382/ps/pez547
- Wang, J., Wang, Q., Zheng, Y., Peng, T., Yao, K., Xie, S., Zhang, X., Xia, X., Li, J., & Jiang, H. (2017). Development of a quantitative fluorescence-based lateral flow immunoassay for determination of chloramphenicol, thiamphenicol and florfenicol in milk. Food and Agricultural Immunology, 29(1), 56–66. https://doi.org/10.1080/09540105.2017.1359498
- Wang, L., Chen, W., Ma, W., Liu, L., Ma, W., Zhao, Y., Zhu, Y., Xu, L., Kuang, H., & Xu, C. (2011). Fluorescent strip sensor for rapid determination of toxins. Chemical Communication, 47(5), 1574–1576. https://doi.org/10.1039/C0CC04032K
- Wang, Z., Wu, X., Liu, L., Xu, L., Kuang, H., & Xu, C. (2020). Rapid and sensitive detection of diclazuril in chicken samples using a gold nanoparticle-based lateral-flow strip. Food Chemistry, 312. https://doi.org/10.1016/j.foodchem.2019.126116
- Xie, Y., Wu, J., Shi, H., & Le, T. (2019). A fluorescent immunochromatographic strip using quantum dots for 3-amino-5-methylmorpholino-2-oxazolidinone (AMOZ) detection in edible animal tissues. Food and Agricultural Immunology, 30(1), 208–221. https://doi.org/10.1080/09540105.2019.1566301
- Yang, H., Cheng, L.-Q., Kang, K.-R., Hao, D.-L., Zhu, L.-R., Liu, Y., Xiang, J.-J., & Huang, J.-F. (2018). Rapid immunological detection of copper ions using fluorescence immunochromatographic assay. Food and Agricultural Immunology, 30(1), 60–73. https://doi.org/10.1080/09540105.2018.1542421
- Yang, X., Wang, Y., Yang, J., Sun, Z., Chu, C., Yue, Z., Li, L., & Hu, X. (2020). Development of an immunochromatographic lateral flow strip test for the rapid detection of diclofenac in medicinal wine. Food and Agricultural Immunology, 31(1), 205–216. https://doi.org/10.1080/09540105.2020.1712331
- Zhang, G. G., Xu, S. L., Xiong, Y. H., Duan, H., Chen, W. Y., Li, X. M., Yuan, M. F., & Lai, W. H. (2019). Ultrabright fluorescent microsphere and its novel application for improving the sensitivity of immunochromatographic assay. Biosensors & Bioelectronics, 135, 173–180. https://doi.org/10.1016/j.bios.2019.04.023
- Zhang, J., Sun, Y., Dong, H., Zhang, X., Wang, W., & Chen, Z. (2016). An electrochemical non-enzymatic immunosensor for ultrasensitive detection of microcystin-LR using carbon nanofibers as the matrix. Sensors and Actuators B: Chemical, 233, 624–632. https://doi.org/10.1016/j.snb.2016.04.145
- Zhang, X. P., Liu, L. Q., Cui, G., Song, S. S., Kuang, H., & Xu, C. L. (2019). Preparation of an anti-isoprocarb monoclonal antibody and its application in developing an immunochromatographic strip assay. Biomedical Chromatography, 33(11), 9. https://doi.org/10.1002/bmc.4660