
 ?Mathematical formulae have been encoded as MathML and are displayed in this HTML version using MathJax in order to improve their display. Uncheck the box to turn MathJax off. This feature requires Javascript. Click on a formula to zoom.
ABSTRACT
In this study, a sensitive and specific monoclonal antibody against VIR M1 was produced based on a new hapten. The antibody had a linear detection range of 3.77–65.51 ng/mL with an IC50 of 15.26 ng/mL and good specificity for VIR M1. Gold nanoparticle (GNP)-based lateral flow strips were assembled for rapid screening of VIR M1 in feed samples. When evaluated with the naked eye, the visual limit of detection (LOD) in feed samples was 25 μg/kg, and the cut-off value was 200 μg/kg. Therefore, this GNP-based lateral flow strip assay can be used for on-site detection and rapid preliminary screening of VIR M1 in feed samples.
1. Introduction
Virginiamycin (VIR) is an animal-specific antibiotic containing a lactone ring. VIR is not a single molecule but contains 70–80% of the M1 component (M1 factor) ((a)) and 20–30% of the S1 component (S1 factor) ((b)). M1 is a macrolide and S1 is a cyclic polypeptide. The two have different antibacterial ranges but good synergy. The minimum inhibitory concentration (MIC) of the individual M1 component against Staphylococcus aureus is 0.25 μg/mL, and the S1 component is 4 μg/mL, whereas the combination of the two is 0.125 μg/mL, which improves the bactericidal effect 1∼30 times. Also due to the different structures of the two components, bacteria that are resistant to the S1 component remain sensitive to the M1 component.
Figure 1. Chemical structure of Virginiamycin M1 (a) and Virginiamycin S1 (b).
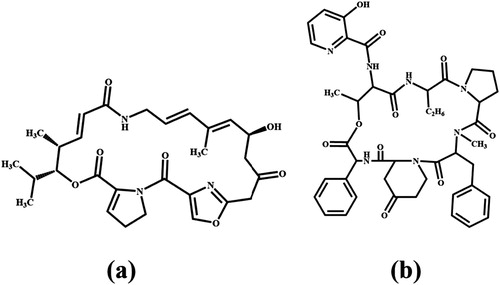
VIR as an anticoccidial drug that can effectively inhibit protein synthesis in Gram-positive bacteria (such as Staphylococcus aureus, Staphylococcus epidermidis, and Sar). Because the cell walls of Gram-negative bacteria are impermeable, VIR is less effective against most Gram-negative bacteria, especially Enterobacteria such as E. coli and Salmonella. VIR has now been widely used in animal feed additives, is less toxic, and rarely accumulates in animals and has good biodegradability (Chen et al., Citation2020; Maciel et al., Citation2019).
With the widespread application of antibiotics, resistance has become a global problem, which is an inevitable problem in the use of antibiotics. Therefore, the European Union first banned the use of VIR as an animal feed additive since 1999. Non-EU countries such as Japan and the United States have also imposed stringent regulations on the limits of VIR in animal foods. For example, Japan’s “Positive Agrochemical Residues in Foods System” stipulates that the maximum residue limit for VIR M1 in chicken meat is 0.05 mg/kg, and that of other animal muscles, eggs, and milk is 0.1 mg/kg, and 0.2 ∼ 0.3 mg/kg in animal liver (Edrington et al., Citation2014; Switzerland, Citation2017). In 2002, the Ministry of Agriculture of the People’s Republic of China No. 235 announced that the maximum residue limits for VIR in poultry liver and kidney is 0.3 and 0.5 mg/kg, respectively. The maximum residue limit in muscle and fat is 0.1 and 0.2 mg/kg and the maximum residue limits for liver and kidney in other animals is 0.3 and 0.4 mg/kg, and in muscle and fat it is 0.1 and 0.4 mg/kg, respectively.
In recent years, a variety of analytical methods have also been used in the detection of VIR M1, including high-performance liquid chromatography (HPLC) (Song et al., Citation2018), liquid chromatography-mass spectrometry (LC–MS) (Boison et al., Citation2015; Duelge et al., Citation2017; Germany, Citation2018; Switzerland, Citation2017; Tao et al., Citation2018). Due to the high proportion of M1 factor in VIR, the detection target is usually dominated by VIR M1. To reduce the risk of resistance to VIR it is necessary to develop a high-throughput and high-sensitivity assay to screen a range of food and feed samples. Although analysis using instrumental methods can also accurately quantify these compounds, they require expensive machines, professional operators, involve complex purification of large-scale samples, and need long processing times. Therefore, these analytical methods are not suitable for screening many feed samples quickly. Compared with these traditional methods, the GNP-based lateral flow strip method is relatively simple to operate and can process many samples quickly and results can be obtained within 5–10 min. This study attempted to establish a GNP-based lateral-flow strip method to quickly detect VIR M1 residues in animal feed.
2. Materials and methods
2.1. Chemicals and materials
The VIR M1, erythromycin, clarithromycin, azithromycin, spiramycin, josamycin, succinic anhydride and DMAP were purchased from J&K Scientific Ltd. (Beijing, China). The following were obtained from Sigma-Aldrich (St Louis, MO, USA): bovine serum albumin (BSA), ovalbumin (OVA), N,N′ -carbonyl diimidazole (CDI), Freund’s complete adjuvant (FCA), Freund’s incomplete adjuvant (FIA), 3,3′, 5,5′-tetramethylbenzidine (TMB), and gold chloride trihydrate. RPMI-1640 cell culture medium, hypoxanthine aminopterin thymidine supplement (HAT), hypoxanthine thymidine supplement (HT), polyethylene glycol (PEG) 1500, and fetal calf serum were purchased from Gibco BRL (Paisley, UK). Other materials such as dodecyl polyglycol ether (Brij) for the preparation of the test strips were obtained from Jie Yi Biotech. Co. Ltd. (Shanghai, China).
The characterization of the designed haptens and antigens was performed using a UV/Vis scanner (Bokin Instruments, Tusshima, Japan). All buffer solutions were prepared using ultrapure water produced by Waters Maldi Synapt Q-Tof MS (Waters, Shanghai, China); a Multiskan MKS microplate reader (Thermo Labsystems Company, Beijing, China) was used to measure indirect competitive ELISA. Indirect competitive enzyme-linked immunosorbent assay (ic-ELISA) was used to determine the results; other instruments used in this study are as follows: membrane dispenser (China Novelty Gene Technology Co., Ltd.), vortex machine (China Shanghai Huxi Analytical Instrument Factory Co., Ltd.) and water bath (Shanghai) Instrument Group Co., Ltd., Supply and Marketing Company, Shanghai, China).
2.2. Buffer solutions
Coating buffer (CB; 0.05 M carbonate bicarbonate, pH 9.6), blocking buffer (0.2% gelatin in coating buffer), washing buffer (PBST: 0.05% Tween-20 (v/v) in 0.01 M PBS), basic buffer (PBS, 0.01 M, pH 7.4) and stop solution (2 M sulfuric acid) were all prepared prior to assay. The substrate buffer consisted of solutions A (citric acid, 30% H2O2, and Na2HPO4) and B (0.06% v/v TMB in glycol) at a 5:1 (v/v) ratio.
2.3. Preparation of hapten and antigen
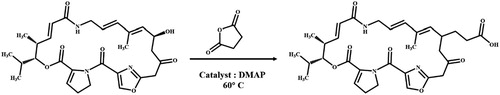
VIR M1 contains a free hydroxyl group in its structure and this study derivated it with reference to literature methods (Kong et al., Citation2019; Magoulas et al., Citation2015). shows the steps used in the preparation of the immunogen (A), using the succinic anhydride method. The VIR M1 standard (8 mg) was weighed and diluted in 4.5 mL of pyridine, and 50 mg of succinic anhydride, then 8 mg of DMAP was added to catalyze the reaction. The above mixture was reacted using a water bath set at 60°C overnight. Then 100 µL of ultrapure water was added and the mixture was dried with nitrogen which also stopped the reaction. It was then purified with chloroform three times, and dried once more (HS-VIR M1).
Figure 2. Synthesis of hapten HS-VIR M1.
The derivatized HS-VIR M1 structure contained a carboxyl group, which was coupled by the activated ester method, which is commonly used in our laboratory. In the first step, 8 mg of the HS-VIR M1 derivative obtained after the derivatization reaction was dissolved as a hapten in 500 μl of a dimethylformamide solution (DMF). In the second step, 3.74 mg of NHS was added, and after stirring at room temperature for half an hour, 8.76 mg of EDC was added, followed by stirring at room temperature for 6 h to cause activation (solution A). In the third step, BSA (6 mg) was mixed with 2 ml 0.1 M CB to produce solution B. Then solution A was added dropwise to solution B, stirred at room temperature overnight, and dialyzed with 0.01 M PBS for 3 days. The last step involved characterization of the solutions using UV/Vis and stored at −20°C (Lei et al., Citation2018; Li et al., Citation2020).
VIR M1-CDI-OVA was prepared by coupling protein to hapten using the carbonyldiimidazole method (Song et al., Citation2019). In the first step, VIR M1 original drug (8 mg) was diluted in 500 uL of dimethylformamide solution, then 12 mg of carbonyldiimidazole (CDI) was added and stirred under heating at 50°C in a water bath for 6–8 h. In the second step, the above solution was added dropwise to a 6 mg OVA solution and allowed to react at room temperature for 48 h. In the third step, unbound VIR M1 was removed by dialysis with 0.01 M PBS for 2–3 days. As a final step, characterized with UV/Vis analysis and stored at −20°C.
2.4. Production of monoclonal antibodies against VIR M1
A total of 15 6–8-week-old female BALB/c mice were injected subcutaneously using conventional immunization method (Chen, Guo, et al., Citation2017; Guo et al., Citation2018; Lin et al., Citation2019). For the first immunization, 100 μg of HS-VIR M1-EDC-BSA and FCA were completely emulsified, and then immunized with 50 μg of immunogen every 3 weeks, and boosted at least four or more times to enhance the immune effect. After each booster, blood was collected from the tail, and titres and inhibitory effects were determined by ic-ELISA. Mice displaying high titre and optimal specificity for VIR M1 were selected for intraperitoneal injection of 25 μg of immunogen dissolved in 100 μL of physiological saline, for the final short-range immunization. Three days after the sprint immunization, the mice were subjected to cell fusion.
The selected target mice were subjected to fusion and screening procedures for the hybridoma cells, for specific operation steps, refer to existing literature (Chen, Liu, et al., Citation2017; Kong et al., Citation2017; Peng et al., Citation2017). Briefly, spleen cells from the target mice and myeloma cells were fused with PEG1500 and distributed to a 96-well cell culture plate. One week later, the cell supernatant was double-detected by the ic-ELISA method. Cell from wells selected after ic-ELISA were cloned by the limiting dilution method. After three clones, monoclonal cells were selected for expansion and culture. Cell fluid was collected and injected into 5 well-growing BALB / c mice to obtain ascites, and the mAb was purified by the caprylic acid-ammonium sulfate precipitation method. After 3 days of dialysis, the mAb was stored at −20°C.
2.5. ic-ELISA procedure
The optimization of antibody and antigen concentrations was performed as follows:. in the first step, a 96-well polystyrene titre plate was coated with VIR M1-CDI-OVA (100 µL/well) diluted with the coating solution and incubated at 37°C for 2 h. In the second step, after washing three times with washing buffer (0.05% (v/v) Tween-20 in 0.01 M PBS), 200 μL of blocking buffer (0.05 M CBS containing 0.2% (w/v) Gelatin) was used to block at 37°C for 2 h. In the third step, after removing the blocking solution, an antibody gradient dilution (50 µL) and VIR M1 dilution (50 µL) were added and incubated at 37°C for 0.5 h. In the fourth step, 100 μL of HRP-labelled goat anti-mouse IgG was added after washing the plate and was incubated at 37°C for 0.5 h. In the fifth step, 100 μL of 3,3′, 5,5′-tetramethylbenzidine (TMB substrate was added after washing the plate, and the reaction was performed at 37°C for 15 min. In the final step, 50 μL of 2 M sulfuric acid was added to terminate the enzymatic reaction and it was then tested at 450 nm using a microplate reader. Each test was repeated four times (Chen, Liu, et al., Citation2017; Zhao et al., Citation2017).
2.6. Optimization of the ic-ELISA
In order to further improve the sensitivity of VIR M1 detection in feed products, an optimization experiment was performed on the ic-ELISA method to improve the specificity and sensitivity of detection. For the experimental method, refer to the previous literature. Optimized various factors including: pH (4.0, 5.6, 7.4, 8.8, 9.6) and ionic strength (NaCl content: 0.4%, 0.8%, 1.2%, 1.6%, 2.0%, w/v)(Chen, Guo, et al., Citation2017; Song et al., Citation2016).
2.7. Cross-reactivity
Cross-reactivity experiments (CR) were performed to identify the specificity of the VIR M1 mAb. Several anticoccidial drugs, erythromycin, clarithromycin, azithromycin, spiramycin and josamycin were tested by ic-ELISA. To calculate CR, we use the following formula:
2.8. Preparation of AuNP-labelled monoclonal antibodies
Refer to previous methods in the laboratory to label the mAbs with AuNPs (Chen et al., Citation2016; Guo et al., Citation2019; Wu et al., Citation2020) and in the first step, the gold nanoparticles GNPs are prepared. Briefly, 50 mL of HAuCl4 · 4H2O (0.01%, m/v) solution was heated to boiling with constant stirring. Then, 1 mL of freshly prepared sodium citrate solution (1%, w/v) was quickly added, and a purple-red colour appeared at the same time. The solution was then cooled to room temperature. The main step here was to adjust the pH of the GNP solution to 8.0 with 0.1 M K2CO3, and then slowly added purified anti-VIR M1 mAb (2 g/L, 80 µL). After reacting for 1 h at room temperature, 1 mL of BSA solution (5% (w/v) in 0.02 MPBS) was slowly added and incubated at room temperature for 2 h. In the next step, the mixture was centrifuged at 8000 × g for 30 min to remove the blocking agent and excess mAb from the previous step. In the final step, the precipitate from the previous step was washed three times with 0.02 M PBS (containing 5% sucrose, 1% BSA and 0.5% PEG 6000, pH 7.4) and dissolved in 5 mL of 0.02 M PBS (containing 0.02% NaN3), then stored at 4°C (Peng et al., Citation2016; Song et al., Citation2016).
2.9. Construction of the lateral-flow ICA strip
The immunoassay strip mainly includes the following components: sample pad, (PVC) backing card, NC membrane and adsorption pad. In the first step, a portion of the sample pad (strip assembly) was immersed in 0.01 M PBS (containing 1% BSA and 0.2% Tween-20) and dried at 37°C for 4 h. In the second step, the NC membrane was spray-coated with a coating antigen (0.5 mg/mL) and goat anti-mouse IgG antibody (0.1 mg/mL) at a concentration of 0.9 μL/cm to form the test and control lines. In the final step, the assembled ribbon cards were dried at 37°C for 30 min and then cut into test strips and used separately, and stored in a dryer for further testing (Chen, Liu, et al., Citation2017; Wang et al., Citation2017).
2.10. Principle of lateral-flow ICA strip
The principle of gold nanoparticle-based lateral-flow strips is based on the antibody–antigen reaction. The competitive/inhibitory response between VIR M1 in the sample and the coating antigen (VIR M1-CDI-OVA) was GNP labelled anti-VIR M1 mAb on the T-line (Li et al., Citation2020).
In the first step, 150 µL of the treated sample solution was mixed with 20 µL of mAb labelled with GNPs and reacted at room temperature for 5 min. In the second step, the above mixed solution was added to a previously prepared sample pad, and then slowly transferred to the absorption pad. After 5 min, the results could be visually observed. For the negative samples (excluding VIR M1), no VIR M1 standard reacted with GNP-labelled antibodies, and all the GNP-labelled antibodies could be captured by the T-line antigens and C-line goat anti-mouse IgG antibodies. The result presented as two red lines, both the C and T-lines were red. For positive samples (including VIR M1), VIR M1 standards competed with fixed capture reagents for a limited amount of detection reagents. The T-line could not capture the antibodies and caused the colour to weaken or even disappear. The colour intensity of the T-line was inversely proportional to the concentration of VIR M1 added in the feed samples.
For GNP-based lateral-flow strips, the visual limit of detection (vLOD) was defined as the lowest VIR M1 concentration, and the colour intensity of the T line was significantly reduced compared to the colour of the T line in the negative sample. The cut-off value was the concentration of VIR M1 that caused the T line to disappear (Guo et al., Citation2015; Lin et al., Citation2019).
2.11. Sample analysis
The Chicken feed samples prepared for the VIR M1 test were obtained from a local market. In the first step, 5 grams of feed was weighed and thoroughly ground into powder. In the second step, the feed powder was dissolved by shaking with a methanol solution containing 10% PBS, and the supernatant was centrifuged. The final step was extraction with an ethyl acetate organic solvent, followed by centrifugation at 8000 × g for 10 min. The lower methanol solution was removed and dried under nitrogen. Next, PBS was added to dissolve and diluate four-fold for subsequent experiments (Kong et al., Citation2017; Li et al., Citation2018).
3. Results and discussion
3.1. Hapten and antigen preparation
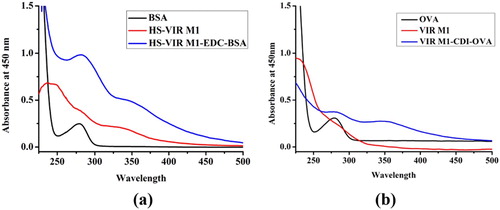
The structural design of the hapten and the coupling preparation of the antigen are essential to the production of monoclonal antibodies. Before combining with bovine serum albumin, the original drug VIR M1 was derivatized by succinic anhydride method. The obtained HS-VIR M1 was coupled with bovine serum protein by the activated ester method and the VIR M1 hapten was coupled with chicken ovalbumin using the carbonyldiimidazole method, and the coupled antigen was characterized by UV-VIS spectroscopy ((a,b)). HS VIR M1-EDC-BSA has two absorption peaks as shown in the figure. These two absorption peaks were generated by the protein (characteristic peak at 280 nm) and HS-VIR M1 (characteristic peak at 330 nm), indicating that the hapten has been successfully linked to bovine serum protein ((a)). VIR M1-CDI-OVA also has two absorption peaks which were generated by the protein (characteristic peak at 278 nm) and VIR M1 (characteristic peak at 225 nm), indicating that the hapten was successfully linked to chicken ovalbumin ((b)). HS-VIR M1-EDC-BSA was used as the immunogen, and VIR M1-CDI-OVA was used as the coating antigen.
Figure 3. (a) UV–VIS spectra of VIR M1 immunogen (HS-VIR M1-EDC-BSA); (b) UV–VIS spectra of VIR M1 coating antigen (VIR M1-CDI-OVA).
3.2. Characterization of mAb 4H12
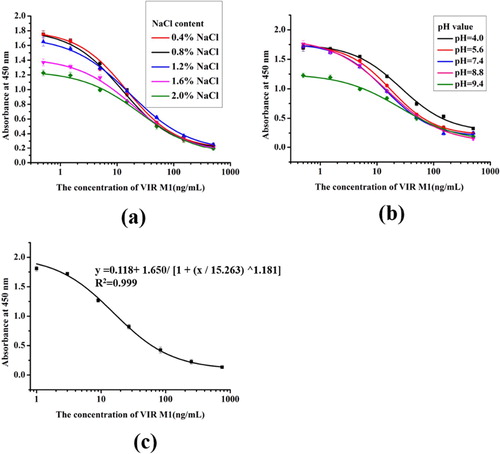
The selected hybridoma cell line was obtained by fusing the spleen cells and myeloma cells of the target mouse and multiple cloning, and the selected mAb 4H12 was purified from the extracted ascites. The titre of the mAb 4H12 was determined by ic-ELISA experiments > 6.5 × 10⁵. The IC50 value (half-inhibition rate) is a key criterion for assessing ELISA sensitivity. The lower the IC50 value of the test results, the higher the sensitivity of the monoclonal antibody. In this study, the IC50 of the mAb 4H12 was 15.26 ng/mL, and the measured LOD was 1.89 ng/mL ((c)).
Figure 4. Standard curve of VIR M1 by ic-ELISA. (a) The standard curve for VIR M1 with ic-ELISA based on different NaCl content; (b) The standard curve for VIR M1 with ic-ELISA based on different pH values; (c)Standard inhibition curve of VIR M1.
3.3. Development and optimization of the ic-ELISA
After fusion of target mouse spleen cells and myeloma cells, the selected cell line 4H12 was obtained through multiple dilution cloning operations, and the corresponding mAb was purified from the ascites of BALB/c mice, using the caprylic acid-saturated ammonium sulfate precipitation method. In order to further improve the sensitivity of VIR M1 detection in feed products, the developed ic-ELISA detection method was optimized to increase the sensitivity of the obtained mAb 4H12 and to make it more useful for the analysis of feed samples. Therefore, we analyzed different factors that may affect the detection in standard dilution buffer, including pH (4.0, 5.6, 7.4, 8.6, 9.6) ((a)) and ionic strength (NaCl content: 0.2%, 0.4%, 0.8%, 1.6%, 3.2%, w/v) ((b)). In the case of a coating antigen concentration of 0.1 µg/mL and an antibody concentration of 0.03 µg/mL, and the LOD and antibody dilution were used as evaluation criteria.
The optimization experiment results shown in indicate that the pH and ionic strength of the dilution buffer in the VIR M1 standards will affect the results of the ic-ELISA assay. The effect of pH is mainly manifested in hydrophobic interactions caused by the number of sites available for the antigen–antibody reaction. The influence of ionic strength is mainly due to the ionic bonds on the surface of the epitope and antibody, as they have an inhibitory effect on the antigen–antibody reaction, causing the epitope or para group to be charged and therefore hinder binding and affect the antibody titre and IC50. For different analytical conditions, a standard dilution buffer with pH 7.4 and a NaCl content of 0.8% w/v is more effective in reducing the IC50 and proper antibody titre.
A standard curve for the ic-ELISA was established under optimal conditions using standard dilution buffer: pH 7.4 and NaCl content of 0.8% w/v ((c)). The formula for the standard curve used was y = 0.118 + 1.650/ [1 + (x / 15.263) ^1.181], the linear regression correlation coefficient (R2) was 0.999, IC50 was 15.26 ng/mL and LOD (IC10) was 1.86 ng/mL.
3.4. Cross reactivity
The ic-ELISA method was used to test macrolide antibiotics of similar structure such as erythromycin, clarithromycin, azithromycin, spiramycin and josamycin. The results are shown in . The results show that the developed anti-VIR M1 monoclonal antibody is highly specific and does not interact with other anticoccidial drugs.
Table 1. CR results of VIR M1-mAb.
3.5. Antibody-labelled GNP preparation
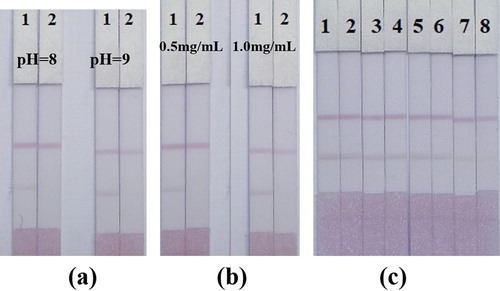
With reference to the results of previous studies, it can be known that at pH 8.2, all of the mouse IgG antibodies obtained were bound to the gold nanoparticles through electrostatic binding due to the positive charge. In order to further optimize the immunochromatographic ICA test strip we developed, the effect of different coating antigen concentrations and GNP-labelled mAb pH on the test strip structure was evaluated. It can be seen from (a) that the colour difference between pH 8.0 and pH 9.0 is not significant. However, pH 8.0 was still selected because pH represented milder reaction conditions compared to pH 9.0. As shown in (b), the antigen concentration was selected to be 0.5 mg/mL. The concentration of the test antigen dispersed on the NC membrane ranged from 0.2 to 2.5 mg/mL. Under the control of the appropriate test antigen concentration, the higher the antibody concentration, the stronger the red line and the lower the sensitivity. But again, too low an antibody concentration may lead to a reduced red line strength and may reduce the effectiveness of the assay, leading to false positive results. The optimal combination of antibody and antigen concentrations optimized for testing was 0.1 and 0.5 mg/mL. The antibody-labelled GNP solution was lyophilized in a microtiter plate well. To further verify the sensitivity and cut-off value of the developed test strips, a series of standard solutions of VIR M1 were prepared in PBS buffer at concentrations of 0, 1.88, 3.75, 6.25, 12.5, 25, 50, and 100 ng/mL to test the critical value. The standard solution was incubated with lyophilized antibody-labelled GNPs to fully react with the antigen and antibody. As shown in (c), when VIR M1 is not existed, red lines are displayed in both the test and control areas, indicating that the antibody-labelled GNPs react with the immobilized antigen and goat anti-mouse IgG. When the concentration of VIR was 100 ng/mL, only the C-line of the control line was observed, and the T-line was not coloured, indicating that the antibody bound to the GNPs was occupied by the free VIR and could not be captured by the immobilized antigen.
Figure 5. Optimization and detection of gold nanoparticle-based lateral flow strip detection methods. (a) Optimization of lateral flow strips based on gold nanoparticles with different GNP-labelled mAb pH values: group 1. GNP-labelled mAb concentration of 10 µg/ ml (pH 8.0); group 2. GNP-labelled mAb concentration of 10 µg/ml (pH 9.0); (b) Optimization of gold nanoparticle-based lateral flow strips with different concentrations of antigen: group 1: 0.5 mg/mL; group 2: 1.0 mg/mL). Strip 1. Negative sample without VIR M1 (0 ng / mL); Strip 2: Positive sample with VIR M1 (100 ng / mL). (c) Detection of VIR M1 in PBS samples by gold nanoparticle-based lateral flow bars. PBS samples: 1 = 0 ng / mL, 2 = 1.88 ng / mL, 3 = 3.75 ng / mL, 4 = 6.25 ng / mL, 5 = 12.5 ng / mL, 6 = 25 ng / mL, 7 = 50 ng / mL 8 = 100 ng / mL.
3.6. Detection of VIR in feed samples by immunochromatography
In order to further verify the developed rapid detection method, VIR M1 was artificially added to chicken feed samples. After sample processing, PBS was added to dissolve the samples and it was then diluted four times for subsequent experiments.
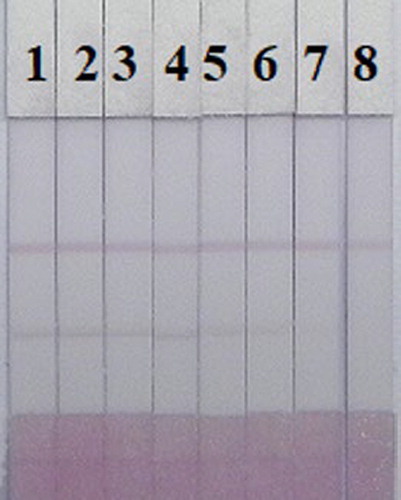
A range of concentrations of VIR M1 (0, 3.75, 6.25, 12.5, 25, 50, 100, and 200 ng / mL) was spiked into the feed samples. As shown on , when the concentration of the VIR M1 standard exceeded 200 ng / mL, only the control line was observed, indicating that the antibody bound to GNP was preferentially occupied by the free VIR M1 in the sample solution and could not be captured by the immobilized antigen. The vLOD reached 25 ng / mL based on the strip reader. Compared with the results in the PBS solution, feed samples led to the decrements in the ability for immunochromatographic analysis. Therefore, the developed GNP-based lateral-flow strips can be used as a tool for field screening to quickly detect the presence of VIR M1 residues in feed samples.
Figure 6. Image of gold nanoparticle-based lateral flow strips of VIR M1 in feed samples. The concentration of VIR M1 added to the feed samples was: (0 = blank sample, 1 = 3.75 ng / mL, 2 = 6.25 ng / mL, 3 = 12.5 ng / mL, 4 = 25 ng / mL, 5 = 50 ng / mL, 6 = 100 ng / mL and 7 = 200 ng / mL).
4. Conclusion
The purpose of this work was to develop fast, reliable, and portable GNP-based lateral-flow strips for the rapid detection of concentration of VIR M1 in feed samples. The VIR M1 mAb 4H12 had an IC50 of 15.73 ng/mL, and an LOD of 1.89 ng/mL. The cut-off value of the developed GNP-based strip for feed sample was 200 ng/mL. Collectively, the GNP-based lateral-flow strip method has become an analytical tool that can be used in monitoring of VIR residues in animal raising and this developed method has strong specificity, high sensitivity and good market application prospects.
Disclosure statement
No potential conflict of interest was reported by the author(s).
Additional information
Funding
References
- Boison, J. O., Lee, S., & Matus, J. (2015). A multi-residue method for the determination of seven polypeptide drug residues in chicken muscle tissues by LC-MS/MS. Analytical and Bioanalytical Chemistry, 407(14), 4065–4078. https://doi.org/10.1007/s00216-015-8644-z
- Chen, Y., Guo, L., Liu, L., Song, S., Kuang, H., & Xu, C. (2017). Ultrasensitive immunochromatographic strip for fast screening of 27 sulfonamides in honey and pork liver samples based on a monoclonal antibody. Journal of Agricultural and Food Chemistry, 65(37), 8248–8255. https://doi.org/10.1021/acs.jafc.7b03190
- Chen, Y., Kong, D., Liu, L., Song, S., Kuang, H., & Xu, C. (2016). Development of an ELISA and immunochromatographic assay for tetracycline, oxytetracycline, and chlortetracycline residues in milk and honey based on the class-specific monoclonal antibody. Food Analytical Methods, 9(4), 905–914. https://doi.org/10.1007/s12161-015-0262-z
- Chen, Y., Liu, L., Xie, Z., Zhu, J., Song, S., & Kuang, H. (2017). Gold immunochromatographic assay for trimethoprim in milk and honey samples based on a heterogenous monoclonal antibody. Food and Agricultural Immunology, 28(6), 1046–1057. https://doi.org/10.1080/09540105.2017.1325843
- Chen, Y., Wang, J., Yu, L., Xu, T., & Zhu, N. (2020). Microbiota and metabolome responses in the cecum and serum of broiler chickens fed with plant essential oils or virginiamycin. Scientific Reports, 10(1), 5382–5382. https://doi.org/10.1038/s41598-020-60135-x
- Duelge, K. J., Nishshanka, U., & De Alwis, H. G. (2017). An LC-MS/MS method for the determination of antibiotic residues in distillers grains. Journal of Chromatography B, 1053, 81–86. https://doi.org/10.1016/j.jchromb.2017.03.037
- Edrington, T. S., Bischoff, K. M., Loneragan, G. H., & Nisbet, D. J. (2014). Evaluation of feeding distiller’s grains, containing virginiamycin, on antimicrobial susceptibilities in fecal isolates of Enterococcus and Escherichia coli and prevalence of resistance genes in cattle. Journal of Animal Science, 92(3), 1144–1149. https://doi.org/10.2527/jas.2013-6954
- Germany, D. I. f. N. e. (2018). Animal feeding stuffs: Methods of sampling and analysis - Identification of tylosin, spiramycin, virginiamycin, carbadox and olaquindox at sub-additive levels in compound feed - Confirmatory analysis by LC-MS; German version EN 17049:2018. German Standard (DIN EN 17049): 34pp.-34pp.
- Guo, J., Liu, L., Xue, F., Xing, C., Song, S., Kuang, H., & Xu, C. (2015). Development of a monoclonal antibody-based immunochromatographic strip for cephalexin. Food and Agricultural Immunology, 26(2), 282–292. https://doi.org/10.1080/09540105.2014.907242
- Guo, L., Liu, L., Cui, G., Ma, S., Wu, X., & Kuang, H. (2019). Gold immunochromatographic assay for kitasamycin and josamycin residues screening in milk and egg samples. Food and Agricultural Immunology, 30(1), 1189–1201. https://doi.org/10.1080/09540105.2019.1677567
- Guo, L., Xu, L., Song, S., Liu, L., & Kuang, H. (2018). Development of an immunochromatographic strip for the rapid detection of maduramicin in chicken and egg samples. Food and Agricultural Immunology, 29(1), 458–469. https://doi.org/10.1080/09540105.2017.1401045
- Kong, D., Wu, X., Li, Y., Liu, L., Song, S., Zheng, Q., Kuang, H., & Xu, C. (2019). Ultrasensitive and eco-friendly immunoassays based monoclonal antibody for detection of deoxynivalenol in cereal and feed samples. Food Chemistry, 270, 130–137. https://doi.org/10.1016/j.foodchem.2018.07.075
- Kong, D., Xie, Z., Liu, L., Song, S., Kuang, H., & Xu, C. (2017). Development of ic-ELISA and lateral-flow immunochromatographic assay strip for the detection of vancomycin in raw milk and animal feed. Food and Agricultural Immunology, 28(3), 414–426. https://doi.org/10.1080/09540105.2017.1293014
- Lei, X., Xu, L., Song, S., Liu, L., & Kuang, H. (2018). Development of an ultrasensitive ic-ELISA and immunochromatographic strip assay for the simultaneous detection of florfenicol and thiamphenicol in eggs. Food and Agricultural Immunology, 29(1), 254–266. https://doi.org/10.1080/09540105.2017.1371114
- Li, Y., Liu, L., Kuang, H., & Xu, C. (2020). Preparing monoclonal antibodies and developing immunochromatographic strips for paraquat determination in water. Food Chemistry, 311, 125897. https://doi.org/10.1016/j.foodchem.2019.125897
- Li, Y., Liu, L., Song, S., Kuang, H., & Xu, C. (2018). A rapid and semi-quantitative gold nanoparticles based strip sensor for polymyxin B sulfate residues. Nanomaterials, 8(3). https://doi.org/10.3390/nano8030144
- Lin, L., Wu, X., Luo, P., Song, S., Zheng, Q., & Kuang, H. (2019). IC-ELISA and immunochromatographic strip assay based monoclonal antibody for the rapid detection of bisphenol S. Food and Agricultural Immunology, 30(1), 633–646. https://doi.org/10.1080/09540105.2019.1612330
- Maciel, I. C. F., Saturnino, H. M., Barbosa, F. A., Malacco, V. M. R., Andrade Junior, J. M. C., Maia Filho, G. H. B., & Costa, P. M. (2019). Virginiamycin and sodium monensin supplementation for beef cattle on pasture. Arquivo Brasileiro de Medicina Veterinária e Zootecnia, 71(6), 1999–2008. https://doi.org/10.1590/1678-4162-10659
- Magoulas, G. E., Kostopoulou, O. N., Garnelis, T., Athanassopoulos, C. M., Kournoutou, G. G., Leotsinidis, M., Dinos, G. P., Papaioannou, D., & Kalpaxis, D. L. (2015). Synthesis and antimicrobial activity of chloramphenicol-polyamine conjugates. Bioorganic & Medicinal Chemistry, 23(13), 3163–3174. https://doi.org/10.1016/j.bmc.2015.04.069
- Peng, J., Liu, L., Kuang, H., Cui, G., & Xu, C. (2017). Development of an icELISA and immunochromatographic strip for detection of norfloxacin and its analogs in milk. Food and Agricultural Immunology, 28(2), 288–298. https://doi.org/10.1080/09540105.2016.1263987
- Peng, J., Wang, Y., Liu, L., Kuang, H., Li, A., & Xu, C. (2016). Multiplex lateral flow immunoassay for five antibiotics detection based on gold nanoparticle aggregations. RSC Advances, 6(10), 7798–7805. https://doi.org/10.1039/C5RA22583C
- Song, S., Suryoprabowo, S., Liu, L., Kuang, H., Xu, L., Ma, W., & Wu, X. (2019). Development of monoclonal antibody-based colloidal gold immunochromatographic assay for analysis of halofuginone in milk. Food and Agricultural Immunology, 30(1), 112–122. https://doi.org/10.1080/09540105.2018.1550058
- Song, X., Xie, J., Zhang, M., Zhang, Y., Li, J., Huang, Q., & He, L. (2018). Simultaneous determination of eight cyclopolypeptide antibiotics in feed by high performance liquid chromatography coupled with evaporation light scattering detection. Journal of Chromatography B, 1076, 103–109. https://doi.org/10.1016/j.jchromb.2018.01.020
- Song, Y., Song, S., Liu, L., Kuang, H., Guo, L., & Xu, C. (2016). Simultaneous detection of tylosin and tilmicosin in honey using a novel immunoassay and immunochromatographic strip based on an innovative hapten. Food and Agricultural Immunology, 27(3), 314–328. https://doi.org/10.1080/09540105.2015.1089843
- Switzerland, S. N.-V. (2017). Animal feeding stuffs: Methods of sampling and analysis - Detection of tylosin, spiramycin and virginiamycin - Thin Layer Chromatography and bioautography. Swiss Standard (SN EN 16939): 26pp.-26pp.
- Tao, Y., Xie, S., Zhu, Y., Chen, D., Pan, Y., Wang, X., Liu, Z., Huang, L., Peng, D., & Yuan, Z. (2018). Analysis of major components of bacitracin, colistin and virginiamycin in feed using matrix solid-phase dispersion extraction by liquid chromatography-electrospray ionization tandem mass spectrometry. Journal of Chromatographic Science, 56(3), 285–291. https://doi.org/10.1093/chromsci/bmx096
- Wang, J., Wang, Y., Pan, Y., Chen, D., Liu, Z., Feng, L., Peng, D., & Yuan, Z. (2017). Preparation of a generic monoclonal antibody and development of a highly sensitive indirect competitive ELISA for the detection of phenothiazines in animal feed. Food Chemistry, 221, 1004–1013. https://doi.org/10.1016/j.foodchem.2016.11.062
- Wu, X., Suryoprabowo, S., Kuang, H., & Liu, L. (2020). Detection of aminophylline in serum using an immunochromatographic strip test. Food and Agricultural Immunology, 31(1), 33–44. https://doi.org/10.1080/09540105.2019.1691508
- Zhao, L., Li, J., Li, Y., Wang, T., Jin, X., Wang, K., Rahman, E., Xing, Y., Ji, B., & Zhou, F. (2017). Preparation of monoclonal antibody and development of an indirect competitive enzyme-linked immunosorbent assay for ornidazole detection. Food Chemistry, 229, 439–444. https://doi.org/10.1016/j.foodchem.2017.02.100