
 ?Mathematical formulae have been encoded as MathML and are displayed in this HTML version using MathJax in order to improve their display. Uncheck the box to turn MathJax off. This feature requires Javascript. Click on a formula to zoom.
ABSTRACT
In this study, an indirect competitive enzyme-linked immunosorbent assay (ic-ELISA) and a gold immunochromatographic assay were developed to detect the furaltadone metabolite, 3-amino-5-morpholinomethyl-2-oxazolidinone (AMOZ). The detection of AMOZ was based on the AMOZ derivative 3-([2-nitrophenyl] methyleneamino)-5-morpholinomethyl-2-oxazolidinone (2-NPAMOZ). The monoclonal anti-2-NPAMOZ antibody 4G11, was prepared and exhibited a 50%-inhibitory concentration (IC50) of 0.049 ng/mL. Its cross-reactivity with structurally related analogues was less than 3%. This immunochromatographic assay was assembled for the rapid screening of AMOZ in catfish samples. The strip assay had a cut-off value of 0.1 μg/kg and a limit of detection (LOD) of 0.009 μg/kg. Analysis of AMOZ in catfish indicated that the results from the strip assay were highly comparable to results obtained using ic-ELISA and LC-MS/MS. Therefore, the colloidal gold (CG) immunoassay is a sensitive screening method for the detection of AMOZ residues in catfish samples.
1. Introduction
Furaltadone is a frequently used synthetic antibacterial agent, which has been widely used in the treatment of aquatic animals, poultry and swine, against various bacterial and protozoan infections (Fernando et al., Citation2017; Kaufmann et al., Citation2015). Extensive research suggests that furaltadone and its metabolite, 3-amino-5-morpholinomethyl-2-oxazolidinone (AMOZ), are toxic and have carcinogenic, and mutagenic properties (Points et al., Citation2015; Zhao et al., Citation2016). Therefore, these drugs have been prohibited in animal treatment and feed in many countries. The minimum required performance limit acceptable in the European Union was set at under 1 μg/kg in animal-derived food (Kaufmann et al., Citation2015). Then, a minimum required performance limit for aquatic products of 0.25 μg/kg was proposed by the Ministry of Agriculture in China (Zhang et al., Citation2018).
The half-life of furaltadone is short, only several minutes, whereas AMOZ is discharged from the body for several weeks and can be detectable for long periods because of its high affinity to tissue proteins (Li et al., Citation2017; Sun et al., Citation2018; Zhang et al., Citation2019). Therefore, AMOZ has been widely used in the detection of furaltadone residues (Le et al., Citation2018; Park et al., Citation2017). Various methods have been used to evaluate furaltadone residues, including immunoassays, liquid chromatography–mass spectrometry (LC-MS), liquid chromatography–tandem mass spectrometry (LC-MS/MS), high performance liquid chromatography (HPLC), and high pressure liquid chromatography–tandem mass spectrometry (UPLC-MS-MS) (Aldeek et al., Citation2018; Kulikovskii et al., Citation2019). Mass spectrometry provides qualitative and quantitative information, but requires a complex treatment process and the methodology is expensive and time-consuming. Most importantly, these requirements limit their use for on-site detection of large sample numbers.
Immunoassays have the advantages of high sensitivity, rapid turnaround times, and high throughput (Gu et al., Citation2015; Li et al., Citation2020; Tan et al., Citation2020) and numerous studies have reported their use in the detection of AMOZ in aquatic animals, chicken, pork, beef, and eggs (Wang et al., Citation2019; Q. Wang et al., Citation2018; Xie et al., Citation2019). Although these immunoassays can detect AMOZ in a variety of sample types, detection limits are high. Therefore, we prepared a highly sensitive and specific monoclonal antibody (mAb) for AMOZ and developed a Colloidal gold (CG)-based immunochromatographic strip assay for the detection of AMOZ in fish samples.
2. Material and methods
2.1. Chemicals and apparatus
1-Aminohydantoin hydrochloride (AHD), 3-amino-2-oxazolidinone (AOZ), AMOZ, semicarbazide, furazolidone, nitrofurantoin, furaltadone, nitrofurazone, 2-nitrobenzal-dehyde (2-NBA), 3-nitrobenzaldehyde, 4-nitrobenzaldehyde, 2-carboxybenzaldehyde (2-CBA) were obtained from Sigma-Aldrich (St. Louis, MO, USA). Keyhole limpet haemocyanin (KLH), ovalbumin (OVA), bovine serum albumin (BSA), 1-ethyl-3-(3-dimethylaminopropyl) carbodiimide (EDC), N-hydroxysuccinimide (NHS), tributylamine, isobutyl chloroformate, Freund’s complete adjuvant and Freund’s incomplete adjuvant were also obtained from Sigma-Aldrich (St. Louis, MO, USA). Cell fusion reagents, including RPMI 1640 medium, polyethylene (PEG, MW 1450), foetal bovine serum, hypoxanthine-aminopterin-thymidine supplement, and hypoxanthine-thymidine supplement were obtained from Thermo Fisher Scientific Inc. (Shanghai, China).
The derivatives of AMOZ (2-CPAMOZ, 2-NPAMOZ) were characterized by a Waters Maldi Synapt Q-Tof mass spectrometer (Shanghai, China). Other instruments were purchased from the following suppliers: UV/Vis scanner (Bokin Instruments, Tsushima, Japan), Milli-Q synthesis system (Millipore Co., Bedford, MA, USA), Multiskan MKS microplate reader (Thermo Labsystems Company, Beijing, China), vortex machine (Shanghai Huxi Analysis Instrument Factory Co., Ltd, Shanghai, China), water bath (Shanghai Instrument Group Co., Ltd, Supply & Sales Co., Shanghai, China) and scan reader (Xinqidian Gene-Technology Co. Ltd, Beijing, China).
2.2. Synthesis and characterization of AMOZ derivatives
Distilled water (1.5 mL) and 1 M HCl (80 μL) were added to 2-CBA (56.0 mg) in a round bottom flask. Dimethylformamide (DMF) was added dropwise to the 2-CBA and mixed using a magnetic stirrer until they completely dissolved. Then AMOZ (50 mg) was added to the solution and the mixture was placed in a water bath at 60°C overnight to produce a white precipitate. After the mixture was cooled to room temperature, the solid product was dried completely with nitrogen to produce 2-CPAMOZ. LC-MS/MS analysis demonstrated the identity and purity of the target product. An additional derivative, 2-NPAMOZ (derived from AMOZ and 2-NBA) used to evaluate the specificity of the antibody was obtained by the same method.
2.3. Preparation of antigens
The immunogen 2-CPAMOZ-KLH was prepared using the mixed-anhydride method (Z. Wang et al., Citation2018). 2-CPAMOZ (4.5 mg), tributylamine (5 mg, 12.8 μL), and isobutyl chloroformate (7.4 mg, 7 μL) were stirred at 4°C for 1 h. Then, this activating solution was added to 6 mg of KLH solution (2 mg/mL in carbonate–bicarbonate buffer solution, pH 9.6) and the mixture was stirred for 4 h at 4°C. The reaction solution was dialysed against 0.01 M phosphate buffer (PBS, pH 7.4) for 3 days and was then stored at −20°C.
The coating antigen 2-CPAMOZ-OVA was prepared by the active ester method (Z. X. Wang et al., Citation2017). Briefly, EDC (3.1 mg) and NHS (1.84 mg) were added to 2-CPAMOZ (2.6 mg) dissolved in 400 μL of DMF and stirred continuously for 6 h at room temperature. Then, this activating solution was added to 6 mg OVA solution (2 mg/mL in carbonate–bicarbonate buffer solution, pH 9.6) and the mixture was stirred overnight. The reaction solution was dialysed using PBS for 3 days and was stored at −20°C. An additional coating antigen, 2-CPAMOZ-BSA was obtained by the same method.
2.4. Production of mAb
Ten 6 week-old female BALB/c mice were immunized with 2-CPAMOZ-KLH as previously described (Kong et al., Citation2019; J. Wang et al., Citation2017). Each mouse was immunized subcutaneously with 100 µg of 2-CPAMOZ-KLH emulsified with Freund’s complete adjuvant at the first immunization. Five sequential booster immunizations were performed with 50 µg of 2-CPAMOZ-KLH emulsified with Freund’s incomplete adjuvant at 4 week intervals. The mouse with the highest titer and the lowest half-maximal inhibitory concentration was given an intraperitoneal injection of 25 μg 2-CPAMOZ-KLH dissolved in 100 μL of normal saline. After 3 days, the mouse spleens were removed for cell fusion.
Hybridoma cells were generated by fusing the mouse splenocytes with Sp 2/0 myeloma cells using PEG 1500. An indirect ELISA was used to select target hybridomas. After subcloning three times, the optimal cell line was expanded and injected intraperitoneally into BALB/c mice to produce ascites. After one week, the ascites were collected and purified using the caprylic-acid-ammonium sulphate precipitation method (Peng et al., Citation2016).
2.5. Characterization of mAbs
The sensitivity, affinity and specificity of the mAbs was investigated by ic-ELISA. The mAb affinity and sensitivity was characterized by titration and inhibition rate. A series of 2-NPAMOZ standard solutions (0, 0.0025, 0.0074, 0.022, 0.067, 0.2, 0.6, and 1.8 ng/mL) were selected to construct a standard curve to determine optimal mAb sensitivity. The level of detection (LOD) and half-maximal inhibitory concentration (IC50) from the standard curve, further characterized the sensitivity of this mAb. The specificity of the mAb was assessed by its cross-reactivity (CR) with structurally related analogues and CR was calculated by the following equation,
2.6. Sample pretreatment
Raw catfish muscle samples were purchased from a local market and were found to be negative for nitrofurans or their metabolites by LC-MS. The method used for sample processing has been described elsewhere (He et al., Citation2017). Catfish muscle was minced and hydrolysed using 1 M HCl, and 2-NBA was added and used for the derivatization reagent and the sample was extracted three times with ethyl acetate. Finally, the residue was dried and resuspended in 0.01 M PBS containing 0.05% Tween-20 and then tested for the presence of AMOZ.
2.7. Preparation of colloidal gold-labelled mAb
Colloidal gold was prepared using the citrate reduction method, as described previously (Shen et al., Citation2019; Z. X. Wang et al., Citation2017; Yang et al., Citation2015). Briefly, 100 mL of distilled water containing 0.01% (w/w) chloroauric acid was heated under continuous stirring, and after boiling, immediately mixed with 5 mL of 1% trisodium citrate. When the colour became wine-red, the mixture was heated to boiling for 10 min and then cooled to room temperature and stored at 4°C.
The anti-2-NPAMOZ mAb labelled CG particles were produced using methods previously described (Li et al., Citation2018; Z. Wang et al., Citation2016). The anti-2-NPAMOZ mAb (6.0 µg) was dropped into 1 mL of the CG solution (adjusted to pH 8.2 with 0.1 mol/L K2CO3) and stirring for 50 min at room temperature. After this, 1 mL of 10% BSA aqueous solution was used to block the unconjugated CG particles and the solution kept at room temperature for another 60 min. The unlabelled mAb was removed by three repeated centrifugation steps (8000rcf, 45 min). The supernatant was discarded, and the precipitate was dissolved with gold-labelled resuspension buffer (20 mmol/L Tris, 0.1% PEG, 5% sucrose, 0.2% BSA, 0.1% Tween, 5% trehalose, and 5% Brij, pH 8.2). Finally, the precipitated gold-labelled mAb was resuspended in the same buffer (1 mL) and stored at 4°C.
2.8. Preparation of the immunochromatographic strip
Nitrocellulose (NC) membrane, polyvinylchloride (PVC) backing card, sample pad and absorption pad were used to construct the immunochromatographic strip (Z. Wang et al., Citation2018). A test zone (T line) for the coating antigen (1 mg/mL 2-CPAMOZ-OVA) and a control zone (C line) for the goat anti-mouse IgG antibody (1 mg/mL) were immobilized on an NC membrane using a dispenser. The NC membrane was pasted onto the middle of the PVC backing card. The absorption pad and sample pad were assembled on both ends of the PVC backing card. The assembled card was dried for 2 h at 37°C, and then cut into 3 mm wide strips.
2.9. Test procedure and principle
A standard AMOZ sample solution (150 µL) was mixed with the mAb labelled CG and kept at room temperature for 5 min. After it was added to the sample pad, the mixture migrated to the absorbent pad due to capillary action and results were visible to the naked eye after 5 min. A series of standard AMOZ samples were prepared for detection. A scan reader was used to measure the colour intensity of the T line. For quantitative detection, a standard curve was fitted according to the colour intensity and the corresponding concentrations. The calculated level of detection (cLOD) from the standard curve characterized the sensitivity of this strip.
In AMOZ-negative samples, the labelled mAb was trapped by the coating antigen and the goat anti-mouse IgG, which had been immobilized on the T and C lines, resulting in two red lines. In AMOZ-positive samples, the fixed antigen and the free AMOZ competed for the binding of the CG-labelled antibody. Therefore, the colour of the T line is determined by the concentration of AMOZ in the sample. With increasing AMOZ concentrations, the amount of mAb-antigen bound decreases and the T line becomes lighter. When the concentration of AMOZ was high enough to react with all the CG-labelled antibody, the T line is not visible. Whereas the colour of C line would be present because the GC-labelled mAb is bound to the goat anti-mouse IgG.
3. Results and discussion
3.1. Preparation of AMOZ derivatives and conjugates of the hapten
AMOZ (MW = 201.22) has a low molecular weight and is not easy to detect, but the condensation reactions of the aldehyde and ammonia groups present are very easy to detect and convenient to perform. Therefore, we selected the condensation product of 2-NBA and AMOZ (2-NPAMOZ) as the standard. At the same time, the condensation product of 2-CBA and AMOZ (2-CPAMOZ) was selected as the hapten. The route of synthesis for the 2-CPAMOZ and 2-NPAMOZ are shown in . The structures of 2-CPAMOZ and 2-NPAMOZ were confirmed using LC-MS/MS. In the mass spectrum, 2-CPAMOZ was measured by ES-. An m/z ratio of 332.1 confirmed that the structure of 2-CPAMOZ (C16H19N3O5, MW = 333.1 Da) was synthesized successfully. Similarly, 2-NPAMOZ (C15H18N4O5, MW = 334.3 Da) was measured by ES+, and an m/z ratio of 335.3 was obtained.
Figure 1. The synthesis routes of the 2-CPAMOZ and 2-NPAMOZ.
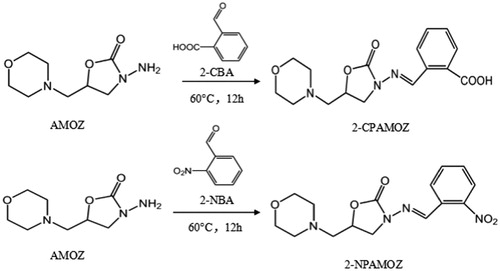
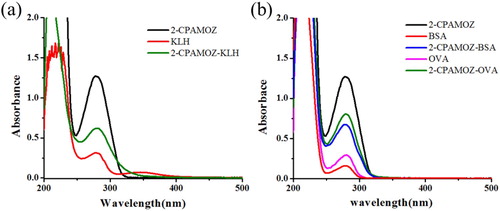
2-CPAMOZ has no immunogenicity, and therefore, needs to be linked to a carrier protein to synthesize an antigen. It can react directly with a carrier protein using the mixed aldehyde method, and the active ester, because of its active groups (–COOH) reacts with amino groups on the carrier protein. The immunogen 2-CPAMOZ-KLH prepared by the mixed aldehyde method, and the coating antigens 2-CPAMOZ-OVA and 2-CPAMOZ-BSA were prepared by the active ester method. In this study, the immunogen and coating antigen were analysed by UV spectrophotometry, which is shown in . The 2-CPAMOZ had an absorption peak at 270–280 nm, whereas the KLH had a high absorption peak and a low absorption peak at 278 and 350 nm, respectively. Both OVA and BSA had a peak at 280 nm. The conjugate 2-CPAMOZ-KLH had two absorption peaks: one at 272 nm, which showed the first peak of KLH and moved to the 2-CPAMOZ peak and one at 350 nm, which showed the second peak of KLH. The peak for 2-CPAMOZ-OVA was similar to the peaks of OVA and 2-CPAMOZ, and the peak of 2-CPAMOZ-BSA was similar to the peaks of BSA and 2-CPAMOZ. Therefore, the production of 2-CPAMOZ-KLH, 2-CPAMOZ-BSA and 2-CPAMOZ-OVA were completely successful.
Figure 2. The UV-VIS spectroscopy of 2-CPAMOZ, protein and conjugates: (a) confirmation of immunogen (2-CPAMOZ-KLH) and (b) confirmation of coating antigen (2-CPAMOZ-OVA, 2-CPAMOZ-BSA).
3.2. Characterization of mAb
Four mAbs (2E4, 3A2, 3F4 and 4G11) were generated by mice immunity and cell fusion. Usually, different antibody and coating antigen combinations affect antibody sensitivity and affinity. Therefore, in our experiment, the affinity and sensitivity of the mAbs were confirmed by an ic-ELISA. Coating antigen 2-CPAMOZ-BSA and 2-CPAMOZ-OVA were used to evaluate the efficacy of these mAbs. At first, the concentration of coating antigen and antibody were optimized by a chessboard orthogonal decomposition, and the coating antigen concentrations of 0.3, 0.1, 0.03 and 0.01 μg/mL and antibody concentrations of 0.3, 0.1, 0.03 and 0.01 μg/mL were determined simultaneously. The inhibition rate against 0.05 ng/mL of 2-NPAMOZ was highest when the concentration of the antibodies (2E4, 3A2, 3F4 and 4G11) and coating antigens (2-CPAMOZ-OVA and 2-CPAMOZ-BSA) were both 0.03 μg/mL. shows the absorbance at 450 nm when the concentration of the antibodies (2E4, 3A2, 3F4 and 4G11) and coating antigens (2-CPAMOZ-OVA and 2-CPAMOZ-BSA) were both 0.03 μg/mL, and inhibition rate against 0.05 ng/mL of 2-NPAMOZ. From the results, it can be seen that when the coating antigen was 2-CPAMOZ-OVA and the antibody used was 4G11, a high titer (A450nm = 2.1) and inhibition rate (54%) was seen. Therefore, we selected the combination of 4G11 mAb and 2-CPAMOZ-OVA coating antigen because of its high sensitivity and affinity. The sensitivity of the 4G11 mAb was evaluated using a standard curve. As shown in , the equation for this standard curve was y = 0.093 + 1.591/ (1 + [x/0.05]1.293), with a correlation coefficient (R2) of 0.998. IC20, IC50, and IC80 for the mAb against 2-NPAMOZ was 0.019, 0.049, and 0.093 ng/mL, respectively. The linear range for 2-NPAMOZ was 0.019-0.093 ng/mL and the LOD was 0.009 ng/mL. The specificity of the 4G11 mAb was confirmed by ic-ELISA, and the results are presented in , showing the high specificity towards 2-NPAMOZ with CR values of <3% when compared to the other analogues.
Figure 3. Standard curve for 2-CPAMOZ detection with mAb 4G11.
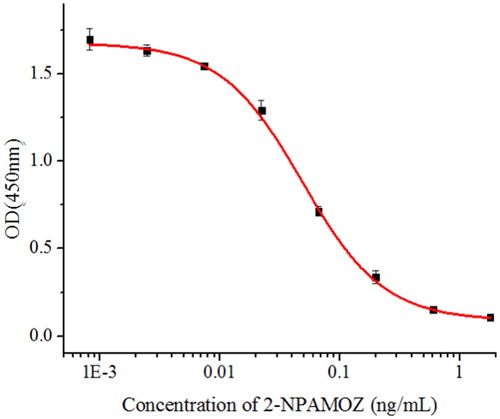
Table 1. Sensitivity and affinity of mAbs with different coating antigens.
Table 2. CR of mAb 4G11 with various drugs and marker residues.
3.3. Sensitivity of the strip assay
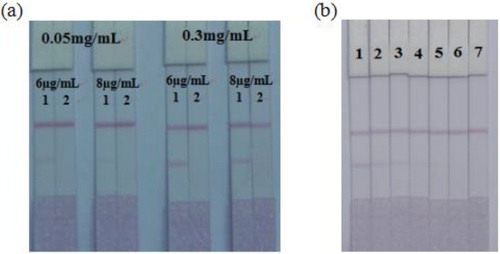
Based on our previous publication (Peng et al., Citation2016), 20 nm gold nanoparticles were selected for the labelling of the mAb. The conjugation reaction between the mAb and the CG nanoparticles was stable when the pH value was greater than or equal to the isoelectric point of the mAb. Therefore, a pH of 8.2 was selected for the labelling reaction. In this experiment, the concentration of the mAb was optimized. We optimized 1 mL of gold nanoparticles with 4 µL K2CO3 and 6 or 8 µg/mL of antibody, and the coating concentrations were 0.05 or 0.3 mg/mL. The results are shown in . When the amount of mAb was 6 µg/mL with 0.3 mg/mL coating antigen, the T line colour was the lightest, demonstrating the best inhibition to 2-NPAMOZ. Therefore, the optimal choice was 6 µg/mL mAb, and the concentration of coating antigen was 0.3 mg/mL.
Figure 4. The strip results for AMOZ in PBS: (a) Optimization of the concentrations of mAb and coating antigen. 1 = 0 ng/mL, 2 = 5 ng/mL. (b) Photo image of detection a series of 2-NPAMOZ in PBS by gold immunochromatographic strip. 1 = 0 ng/mL, 2 = 0.0025 ng/mL, 3 = 0.005 ng/mL, 4 = 0.01 ng/mL, 5 = 0.025 ng/mL, 6 = 0.05 ng/mL, 7 = 0.1 ng/mL.
3.4. Detection of AMOZ in PBS by strip assay
Based on the optimization above, we added 0, 0.0025, 0.005, 0.01, 0.025, 0.05, or 0.1 ng/mL 2-NPAMOZ in PBS to the strip, and the results could be seen by eye due to the visibility of the CG particles. The qualitative determination of the strip assay can be evaluated by two indicators: the cut-off value and the visual LOD (vLOD). Usually, the cut-off value and the vLOD are defined according to the colour of the T line. When the T line disappears completely, the detectable concentration represents the cut-off value. When the colour of the T line started to lighten, the lowest detectable concentration was defined as vLOD. As shown in , when no 2-NPAMOZ was present, the colour of the C line and T line were both red. When the concentration of 2-NPAMOZ ≥ 0.01 ng/mL, the colour of the T line gradually became lighter, until the concentration reached 0.1 ng/mL, then the T line disappeared completely. Thus, the cut-off value was 0.1 ng/mL and the vLOD was 0.01 ng/mL in PBS.
3.5. Detection of AMOZ in catfish samples by strip assay
In this study, catfish muscle was used as the sample and extracted by the ethyl acetate method. To investigate the effect of the sample matrix, a series of AMOZ concentrations of 0, 0.01, 0.025, 0.05, 0.1, and 0.25 µg/kg were spiked into catfish samples and analysed by the strip assay. shows that the cut-off value was 0.1 µg/kg and the vLOD was 0.01 µg/kg. When the concentration of AMOZ was ≤0.01 µg/kg, a negative result was displayed in this strip. When the concentration of AMOZ was 0.01–0.1 µg/kg, a weakly positive result was displayed in this strip; when the concentration of AMOZ was ≥0.1 µg/kg, the T line disappeared, and the result was positive.
Figure 5. The strip results for AMOZ in spiked catfish samples: (a) Photo image of detection a series of catfish samples spiked AMOZ by gold immunochromatographic strip. 1 = 0 μg/kg, 2 = 0.01 μg/kg, 3 = 0.025 μg/kg, 4 = 0.05 μg/kg, 5 = 0.1 μg/kg, 6 = 0.25 μg/kg. (b) The calibration curve for the strip result. The Y-axis is shown as the T/T0 value; The X-axis is shown as the concentrations of AMOZ. T: the colour intensity of the given sample; T0: the colour intensity of the blank sample.
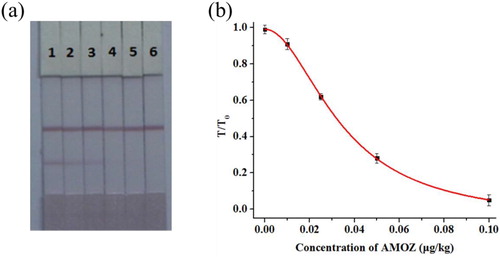
For quantitative detection, we use a strip scan reader to measure the colour intensity of the T line. The T/T0 value was used to indicate the intensity of the signal, where the value T represented the colour intensity of the given sample and the value T0 represented the colour intensity of the blank sample. In our experiment, a standard curve was fitted by plotting T/T0 values for each concentration of AMOZ against the corresponding concentrations. The calculated LOD (cLOD) of the strip assay was defined as the concentration of AMOZ with 10% inhibition of the blank sample signal. As shown in , the equation for the standard curve was y = −0.065 + 1.057/(1 + [x/0.034]1.954) with an R2 of 0.999 and the cLOD was calculated as 0.009 μg/kg.
From the above results, the test strip can be used for detecting the furaltadone metabolite AMOZ in catfish samples and is largely immune to matrix interference. When compared with previous immunoassays (Xie et al., Citation2019; Zhang et al., Citation2018) for the detection of AMOZ, this strip assay could detect AMOZ with a lower vLOD and cut-off value, and a greater sensitively. Moreover, the strip assay was more convenient and AMOZ spiked into the samples could be detected directly.
3.6. Analysis of AMOZ in catfish samples
To validate the accuracy of the immunochromatographic assay, spiked and recovery experiments were tested by ic-ELISA and the strip assay, and confirmed by LC-MS/MS. Each sample was assayed three times. The catfish samples were added to different concentrations of AMOZ (0, 0.02, 0.05, or 0.1 μg/kg).
As shown in , recovery rates ranged from 90.2% to 112.7% with a coefficient of variance of 5.3–7.8% using an ic-ELISA compared with 92.3–119.3% with a coefficient of variance of 3.3–5.9% using the strip assay. At the same time, recovery rates ranged from 90.5–98.7% with a coefficient of variance of 4.3–6.9% using LC-MS/MS. These findings indicate that results using the strip assay and ic-ELISA were both consistent with those of LC-MS/MS. The strip assay also provided a qualitative detection of AMOZ. When there was no AMOZ present, the result was negative (−), When the AMOZ concentration was 0.02 and 0.05 µg/kg, the results were weakly positive (±), when the AMOZ concentration was 0.1 µg/kg, the result was positive (+). Therefore, the strip assay had a high degree of reliability for the detection of AMOZ in the catfish samples and was able to detect samples more rapidly than LC-MS/MS and ic-ELISA. Currently, in the field of food safety, rapid and real-time inspection of harmful residues in food or raw materials is very important. Therefore, gold nanoparticle-based immunochromatographic strips with a more rapid detection and lower cLOD could be used as an effective tool for the detection of AMOZ in large sample sizes.
Table 3. Analysis of AMOZ in spiked catfish samples by ic-ELISA, LC–MS/MS and strip assay.
4. Conclusions
In this study, we prepared a monoclonal antibody against 2-NPAMOZ with an IC50 of 0.049 ng/ml, and a very low CR. Therefore, the mAb had a very high sensitivity and specificity against 2-NPAMOZ. Based on this mAb, a gold immunochromatographic assay was established for the detection of AMOZ residues for both qualitative and quantitative use, which had a lower cut-off value (0.1 µg/kg) and cLOD (0.009 µg/kg) when compared to previous studies. The result from the immunochromatographic assay correlated well with the results seen using an ic-ELISA, which was confirmed by LC-MS. Therefore, the CG assay could be used as an on-site screening tool for the detection of AMOZ, with high sensitivity.
Disclosure statement
No potential conflict of interest was reported by the author(s).
Additional information
Funding
References
- Aldeek, F., Hsieh, K. C., Ugochukwu, O. N., Gerard, G., & Hammack, W. (2018). Accurate quantitation and analysis of nitrofuran metabolites, chloramphenicol, and florfenicol in seafood by ultrahigh-performance liquid chromatography-tandem mass spectrometry: Method validation and regulatory samples. Journal of Agricultural and Food Chemistry, 66(20), 5018–5030. https://doi.org/10.1021/acs.jafc.7b04360
- Fernando, R., Munasinghe, D. M. S., Gunasena, A. R. C., & Abeynayake, P. (2017). Determination of nitrofuran metabolites in shrimp muscle by liquid chromatography-photo diode array detection. Food Control, 72, 300–305. https://doi.org/10.1016/j.foodcont.2015.08.044
- Gu, H., Liu, L., Song, S., Kuang, H., & Xu, C. (2015). Development of an immunochromatographic strip assay for ractopamine detection using an ultrasensitive monoclonal antibody. Food and Agricultural Immunology, 27(4), 471–483. https://doi.org/10.1080/09540105.2015.1126808
- He, L. M., Gao, F. M., Li, E. F., Lee, J. T., Bian, L. Q., & Armstrong, D. W. (2017). Chromatographic separation of racemic praziquantel and its residual determination in perch by LC-MS/MS. Talanta, 174, 380–386. https://doi.org/10.1016/j.talanta.2017.05.026
- Kaufmann, A., Butcher, P., Maden, K., Walker, S., & Widmer, M. (2015). Determination of nitrofuran and chloramphenicol residues by high resolution mass spectrometry versus tandem quadrupole mass spectrometry. Analytica Chimica Acta, 862, 41–52. https://doi.org/10.1016/j.aca.2014.12.036
- Kong, D., Wu, X., Li, Y., Liu, L., Song, S., Zheng, Q., Kuang, H., & Xu, C. (2019). Ultrasensitive and eco-friendly immunoassays based monoclonal antibody for detection of deoxynivalenol in cereal and feed samples. Food Chemistry, 270, 130–137. https://doi.org/10.1016/j.foodchem.2018.07.075
- Kulikovskii, A. V., Gorlov, I. F., Slozhenkina, M. I., Vostrikova, N. L., Ivankin, A. N., & Kuznetsova, O. A. (2019). Determination of nitrofuran metabolites in Muscular tissue by high-performance liquid chromatography with mass spectrometric detection. Journal of Analytical Chemistry, 74(9), 906–912. https://doi.org/10.1134/S106193481907013X
- Le, T., Zhang, Z. H., Wu, J., Shi, H. X., & Cao, X. D. (2018). A fluorescent immunochromatographic strip test using a quantum dot-antibody probe for rapid and quantitative detection of 1-aminohydantoin in edible animal tissues. Analytical and Bioanalytical Chemistry, 410(2), 565–572. https://doi.org/10.1007/s00216-017-0756-1
- Li, Y., Liu, L. Q., Kuang, H., & Xu, C. L. (2020). Preparing monoclonal antibodies and developing immunochromatographic strips for paraquat determination in water. Food Chemistry, 311, 9. https://doi.org/10.1016/j.foodchem.2019.125897
- Li, Y., Liu, L. Q., Song, S. S., & Kuang, H. (2018). Development of a gold nanoparticle immunochromatographic assay for the on-site analysis of 6-benzylaminopurine residues in bean sprouts. Food and Agricultural Immunology, 29(1), 14–26. https://doi.org/10.1080/09540105.2017.1354359
- Li, Z. H., Li, Z. M., & Xu, D. K. (2017). Simultaneous detection of four nitrofuran metabolites in honey by using a visualized microarray screen assay. Food Chemistry, 221, 1813–1821. https://doi.org/10.1016/j.foodchem.2016.10.099
- Park, M. S., Kim, K. T., & Kang, J. S. (2017). Development of an analytical method for detecting nitrofurans in bee pollen by liquid chromatography-electrospray ionization tandem mass spectrometry. Journal of Chromatography B, 1046, 172–176. https://doi.org/10.1016/j.jchromb.2016.11.042
- Peng, J., Liu, L., Xu, L., Song, S., Kuang, H., Cui, G., & Xu, C. (2016). Gold nanoparticle-based paper sensor for ultrasensitive and multiple detection of 32 (fluoro)quinolones by one monoclonal antibody. Nano Research, 10(1), 108–120. https://doi.org/10.1007/s12274-016-1270-z
- Points, J., Burns, D. T., & Walker, M. J. (2015). Forensic issues in the analysis of trace nitrofuran veterinary residues in food of animal origin. Food Control, 50, 92–103. https://doi.org/10.1016/j.foodcont.2014.08.037
- Shen, X., Liu, L., Xu, L., Ma, W., Wu, X., Cui, G., & Kuang, H. (2019). Rapid detection of praziquantel using monoclonal antibody-based ic-ELISA and immunochromatographic strips. Food and Agricultural Immunology, 30(1), 913–923. https://doi.org/10.1080/09540105.2019.1641068
- Sun, Q., Luo, J. H., Zhang, L., Zhang, Z. H., & Le, T. (2018). Development of monoclonal antibody-based ultrasensitive enzyme-linked immunosorbent assay and fluorescence-linked immunosorbent assay for 1-aminohydantoin detection in aquatic animals. Journal of Pharmaceutical and Biomedical Analysis, 147, 417–424. https://doi.org/10.1016/j.jpba.2017.06.068
- Tan, G. Y., Zhao, Y. J., Wang, M., Chen, X. J., Wang, B. M., & Li, Q. X. (2020). Ultrasensitive quantitation of imidacloprid in vegetables by colloidal gold and time-resolved fluorescent nanobead traced lateral flow immunoassays. Food Chemistry, 311, 7. https://doi.org/10.1016/j.foodchem.2019.126055
- Wang, J., Chang, X. X., Zuo, X. W., Liu, H. B., Ma, L. C., Li, H. J., & Tao, X. Q. (2019). A multiplex immunochromatographic assay employing colored latex beads for simultaneously quantitative detection of four nitrofuran metabolites in animal-derived food. Food Analytical Methods, 12(2), 503–516. https://doi.org/10.1007/s12161-018-1381-0
- Wang, J., Wang, Y., Pan, Y., Chen, D., Liu, Z., Feng, L., Peng, D., & Yuan, Z. (2017). Preparation of a generic monoclonal antibody and development of a highly sensitive indirect competitive ELISA for the detection of phenothiazines in animal feed. Food Chemistry, 221, 1004–1013. https://doi.org/10.1016/j.foodchem.2016.11.062
- Wang, Q., Liu, Y., Wang, M., Chen, Y., & Jiang, W. (2018). A multiplex immunochromatographic test using gold nanoparticles for the rapid and simultaneous detection of four nitrofuran metabolites in fish samples. Analytical and Bioanalytical Chemistry, 410(1), 223–233. https://doi.org/10.1007/s00216-017-0714-y
- Wang, Z., Guo, L., Liu, L., Kuang, H., & Xu, C. (2018). Colloidal gold-based immunochromatographic strip assay for the rapid detection of three natural estrogens in milk. Food Chemistry, 259, 122–129. https://doi.org/10.1016/j.foodchem.2018.03.087
- Wang, Z. X., Xie, Z. J., Cui, G., Liu, L. Q., Song, S. S., Kuang, H., & Xu, C. L. (2017). Development of an indirect competitive enzyme-linked immunosorbent assay and immunochromatographic assay for hydrocortisone residues in milk. Food and Agricultural Immunology, 28(3), 476–488. https://doi.org/10.1080/09540105.2017.1297779
- Wang, Z., Zou, S., Xing, C., Song, S., Liu, L., & Xu, C. (2016). Preparation of a monoclonal antibody against testosterone and its use in development of an immunochromatographic assay. Food and Agricultural Immunology, 27(4), 547–558. https://doi.org/10.1080/09540105.2015.1137276
- Xie, Y., Wu, J., Shi, H., & Le, T. (2019). A fluorescent immunochromatographic strip using quantum dots for 3-amino-5-methylmorpholino-2-oxazolidinone (AMOZ) detection in edible animal tissues. Food and Agricultural Immunology, 30(1), 208–221. https://doi.org/10.1080/09540105.2019.1566301
- Yang, X., Zhang, G., Wang, F., Wang, Y., Hu, X., Li, Q., Jia, G., Liu, Z., Wang, Y., Deng, R., & Zeng, X. (2015). Development of a colloidal gold-based strip test for the detection of chlorothalonil residues in cucumber. Food and Agricultural Immunology, 26(5), 729–737. https://doi.org/10.1080/09540105.2015.1018875
- Zhang, X. Y., Zhang, D. H., & He, K. (2019). Combining an effective immuno-affinity column with ELISA for reliable and visual detection of furaltadone metabolites in aquatic products. Analytical Methods, 11(9), 1270–1275. https://doi.org/10.1039/C8AY02597E
- Zhang, Y., Zhao, C., Wu, B., Li, Y., Lv, F., Zhang, J., Zhou, B., Fan, J., & Huang, B. (2018). Rapid and sensitive determination of furaltadone metabolite 3-amino-5-morpholinomethyl-2-oxazolidinone by biotin–streptavidin-amplified time-resolved fluoroimmunoassay. Fisheries Science, 84(4), 715–721. https://doi.org/10.1007/s12562-018-1211-8
- Zhao, H., Guo, W., Quan, W., Jiang, J., & Qu, B. (2016). Occurrence and levels of nitrofuran metabolites in sea cucumber from Dalian, China. . Food Additives & Contaminants: Part A, 33(11), 1672–1677. https://doi.org/10.1080/19440049.2016.1217069