
 ?Mathematical formulae have been encoded as MathML and are displayed in this HTML version using MathJax in order to improve their display. Uncheck the box to turn MathJax off. This feature requires Javascript. Click on a formula to zoom.
ABSTRACT
This study reports a fluorescence ratio immunosensor method for detecting dibutyl phthalate (DBP) sensitively and specifically using dual-emission carbon quantum dots labelled with amino-modified nucleic acid aptamers. Under optimal experimental conditions, the linearity range of the method for detecting DBP was from 12.5 to 1500 μg/L, with a limit of detection of 5.0 μg/L. Compared with detection results for two structural analogues, this method showed good specificity for DBP. Liquor samples spiked with DBP measured by this method exhibited a standard recovery of 93.2% to 112.4% with a relative standard deviation of 1.59% to 4.54%. The method was used to determine the DBP content in edible oil samples, providing results not significantly different from those obtained by gas chromatography. Compared with the single wavelength emission method, this method had a stronger anti-interference ability and provided more accurate results, so can be used for highly sensitive detection of DBP in food samples.
Introduction
Plasticisers are an important type of chemical additive which improve the plasticity of a polymer so are widely applied in plastics for cosmetics and food packaging material (Frederiksen et al., Citation2007; Schecter et al., Citation2013; Wittassek et al., Citation2011; Zhang et al., Citation2013). However, they are considered as the fourth most toxic chemical substance, and as they are only physically combined with plastic and other materials, they can be easily dissolved by oil and other substances to enter the human body through the respiratory and digestive tracts and the skin (Bi et al., Citation2013; Lu et al., Citation2019; Zhao et al., Citation2018). Recent studies have found that phthalates have been detected in the blood of girls, the urine of women of childbearing age (Wang et al., Citation2015; Watkins et al., Citation2014). Because phthalate plasticisers cause great harm to the human body, they are prohibited from use in any food, medicine or health care products.
As one of the common phthalate plasticiser, a method is urgently needed to detect the content of dibutyl phthalate (DBP) in food samples. The methods currently used include gas chromatography (GC) (Makkliang et al., Citation2015), gas chromatography-mass spectrometry (Brossa et al., Citation2003; Carlo et al., Citation2008; Peng et al., Citation2013), high-performance liquid chromatography (Luo et al., Citation2014), high performance liquid chromatography-mass spectrometry (Liou et al., Citation2014), near-infrared spectroscopy (Marcilla et al., Citation2008), and immunoassay (Zhang et al., Citation2006). Of these methods, chromatography and mass spectrometry have the advantages of automatic operation and high detection sensitivity but the disadvantages of high costs of equipment and the need for daily maintenance. Near infrared spectroscopy can detect DBP rapidly, but has low sensitivity and cannot detect low concentrations. Traditional immunoassay relies on antigen–antibody binding and the specificity of this method is good (He et al., Citation2020), but preparing the antibodies is a complex and time-consuming process. Therefore, an inexpensive, sensitive and specific method for detecting DBP in food samples needs to be urgently developed.
Aptamers are oligonucleotide fragments obtained by SELEX (systematic evolution of ligands by exponential enrichment) technology. In recent years, they have been widely used in several analytical techniques because of their high ability to bond specifically with target substances and their easy modification and fixation (Cruz-Aguado & Penner, Citation2008; Duan et al., Citation2012; Espiritu et al., Citation2018; Fenzl et al., Citation2017; Noonan et al., Citation2013). Aptamers are often used in combination with fluorescent labelling materials to achieve sensitive and intuitive detection (Gao et al., Citation2017; Wu et al., Citation2018). Currently, the most widely used fluorescent labelling materials are organic fluorescent dyes, fluorescent proteins, and quantum dot materials. Organic fluorescent dyes and fluorescent proteins are difficult to use for long-term fluorescent labelling and tracking because of their poor optical stability, severe photobleaching and photodegradation. Recently, fluorescent quantum dots have become more popular based on their excellent optical properties (Chen et al., Citation2009; Ding et al., Citation2006; Zhang et al., Citation2014). However, the most widely used quantum dots in various fields, mostly CdTe, CdSe and CdS, contain the heavy metal cadmium, whose toxicity severely limits their practical application (Khan et al., Citation2019). Carbon quantum dots (CDs) have attracted widespread attention because they not only have excellent optical properties and small size characteristics, but also good biocompatibility, low cost and toxicity, so are a good alternative to the traditional heavy metal quantum dots. These properties mean that CDs offer greater prospects for application as fluorescent probes for biological imaging and detection (Cui et al., Citation2017; Liao et al., Citation2019; Ren et al., Citation2019; Wang et al., Citation2019; Xiao et al., Citation2015). However, as fluorescence analysis has developed, the shortcomings of single-emission CDs constructed with a single fluorophore have gradually emerged, the detection results being easily affected by environmental changes and instrument interference. CDs with dual-emission are now receiving more attentions. The ratio of the fluorescence intensity of the two emission peaks is related linearly to the concentration of the target analyte. Compared with the single-emission CDs method, this new anti-interference detection method can effectively overcome the instability caused by changes in the concentration of the probe, background interference of the instrument and external interference, and thus greatly improves the accuracy of detection (Han et al., Citation2017; Ju et al., Citation2018).
Although some CDs have double-emission peaks by changing the excitation wavelength, this is at the expense of fluorescence intensity, so these are not true dual-emission CDs. In the present study, a simple colorimetric fluorescence method based on water-soluble intrinsic dual-emission CDs has been proposed for detecting DBP. The dual-emission CDs can be synthesised by the one-pot solvent thermal method, where the blue emission comes from the inherent surface defects of CDs, and the long wave emission comes from the solvent molecules connected to the surface of the CDs by hydrogen bonds. The dual-emission CDs can be used as fluorescent groups, connected to amino-modified aptamers to form a fluorescently-labelled aptamer-CDs complex.
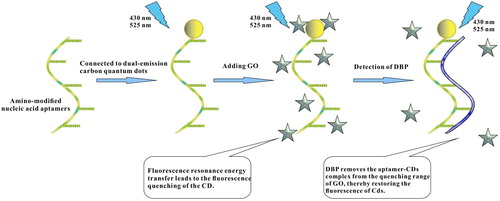
Traditionally, fluorescence resonance energy transfer requires that the emission spectrum of the donor overlaps with the absorption spectrum of the recipient, but when the recipient is graphene oxide (GO), no emission spectrum is required (Yang et al., Citation2019), so GO has been chosen as the fluorescence quencher in the present study. After adding GO, the aptamer can be adsorbed to it, resulting in fluorescence quenching of the CDs. The aptamer becomes specifically bound to DBP, thereby removing the aptamer-CDs complex from the quenching range of GO and restoring the fluorescence of the CDs when the target is present. In the present study, the recovered fluorescence will be used as the output signal for constructing the dual-emission CDs-aptamer fluorescence ratio sensor. The experimental conditions will be optimised and the selectivity and accuracy of the method will be evaluated. This is the first investigation to combine dual-emission CDs and aptamers for detecting DBP, thus providing a specific and sensitive method for detecting other phthalic plasticiser using appropriate aptamers.
Material and methods
Samples
Samples of edible liquor (42%Vol) and soybean oil were purchased from RT-Mart in March 2019 (Tai’an, China). All samples were packed in plastic barrels and stored in a cool, dark place.
Reagents and chemicals
DBP (99%) and butyl benzyl phthalate were provided by Beijing Dikma Technology Co., Ltd. (Beijing, China), glyceryl triacetate (98.5%) by Aladdin Reagent Co., Ltd. (Shanghai, China), nucleic acid aptamers by Sangon Biotech Co., Ltd. (Shanghai, China), GO aqueous solution (2 mg/mL) by Suzhou Tanfeng Graphene Technology Co., Ltd. (Suzhou, China), 1-ethyl-3- (3-dimethoxypropyl) carbodiimide hydrochloride (EDC, 99%) by Shanghai Yuanye Bio-Technology Co., Ltd. (Shanghai, China), N-hydroxysuccinimide (NHS, 98%) by Macklin Biochemical Technology Co., Ltd. (Shanghai, China), chromatography-grade acetonitrile, acetone and n-hexane, and analytical-grade ethanol, methanol, ethylene glycol, and ascorbic acid by Tianjin Kaitong Chemical Reagent Co., Ltd. (China). The 0.22-μm filter membranes and 5 kDa ultrafiltration centrifugal tubes were purchased from Jiangsu Green Union Science Instrument Co., Ltd. (Taizhou, Jiangsu, China). Double-distilled water (DDW, 18.2 ΜΩ cm), used in all experiments, was prepared using the Aike ultrapure water system (Chengdu, China). All the laboratory glassware used was washed three times with DDW, soaked in acetone, dried then cooled to room temperature before use.
Solution
DBP stock solution was diluted to concentrations of 1, 3, 5, 7, 12.5, 25, 50, 100, 125, 250, 500, 1000 and 1500 μg/L, and then stored at 4°C before use.
The aptamer chain was 5′-CTTTCTGTCCTTCCGTCACATCCCACGCATTCTCCACAT-3′ and the aminated aptamer chain was NH2 (C6) -5′- CTTTCTGTCCTTCCGTCACATCCCACGCATTCTCCACAT-3′. Each optical density (OD) aptamer was dissolved in 30 μL of DDW, then stored separately under cryopreservation at −20°C.
Apparatus
A PSA solid phase extraction (SPE) column was provided by Beijing Dikma Technology Co., Ltd. (Beijing, China). The FT-IR spectra of the dual-emission CDs were measured using a Nicolet IS10 Fourier transform infrared spectrometer (Thermo Fisher Scientific, Shanghai, China). Fluorescent measurements were made using a Lumina fluorescence spectrometer (Thermo Fisher Scientific) with an excitation wavelength of 365 nm.
A 2010 GC system (Shimadzu Corp., Kyoto, Japan) was used to determine DBP in the edible liquor and soybean oil samples using the flame ionisation detector (FID) with a Rtx-5 elastic model quartz capillary column (30 m × 0.32 mm × 0.25 m, Restek, Bellefonte, PA, USA). The carrier gas was nitrogen (99.9% purity), at a flow rate of 1.5 mL/min. The inlet temperature was 250°C, and 1 μL was injected by splitless injection. The temperature of the FID detector was 280°C, and the temperature was programmed as follows: maintained at 60°C for 2 min, then increased to 220°C at 20°C/min for 3 min, and finally increased to 280°C at 5°C/min for 5 min.
Synthesis and activation of dual-emission fluorescent CDs
The method for synthesising dual-emission fluorescent CDs was mainly based on a previous report (Liu et al., Citation2015) where 0.8 g of ascorbic acid was dissolved in 20 mL of methanol–water solution (volume ratio: 13:7). After vigorous stirring, the solution was then placed in a reaction kettle and heated at 160°C for 70 min. During this process, the colour of the mixture changed from colourless to dark yellow, indicating the formation of CDs. After the solution had cooled to room temperature, the dual-emission fluorescent CDs solution was obtained, which was stored at 4°C in the dark.
The CDs with carboxyl groups on the surface needed to be activated before use. The activation method was as follows: the CDs (500 μL) were mixed with 1 mL of DDW and 20 mg EDC, left to react at room temperature in the dark for 20 min, then 30 mg NHS was slowly added, and the mixed solution incubated at room temperature for 10 min. During this process, the pH of the solution had to remain below 7.0.
Preparation of fluorescent-labelled aptamer-CDs complex
Before binding to the CDs, the aptamer was incubated at 90°C for 10 min then placed immediately in ice for 4 min. One hundred μL of CDs and 200 μL of aptamers were placed in a 1.5-mL centrifuge tube then allowed to react at room temperature for 120 min. During this process, continuous oscillation was required to promote the binding of the CDs and aptamers. Finally, the aptamer-CDs complex was purified using a 5-kDa ultrafiltration centrifuge tube at 4440 × g for 10 min to remove the uncoupled CDs.
Fluorescence ratio sensor procedure
First, 250 μL of GO (0.15 g/L) were added to the aptamer-CDs complex solution, then the solution was reacted at 37°C for 5 min. After adding 250 μL of DBP solution, the solution was allowed to stand for 2 h at 37°C (Scheme 1). Three parallel reactions were performed for each group, and the fluorescence intensity was measured by a spectrophotometer.
Scheme 1. The illustrative diagram of fluorescence ratio immunosensor based on dual-emission carbon quantum dot labeled aptamers.
Sample preparation
For the soybean oil (1.0 mL), acetonitrile saturated n-hexane solution (5 mL; purified solution) and n-hexane saturated acetonitrile solution (10 mL; extraction solution) were placed in a centrifuge tube. After 20 min of ultrasonic treatment, the solution was centrifuged at 7104 × g for 10 min, then the lower layer of the solution was extracted three times and dried by rotary evaporation at 38°C. After reconstitution with methanol (1.0 mL), acetone (5 mL) and n-hexane (5 mL) were added to the SPE column in turn to activate the column bed. The extract was then passed through the SPE column at 1 mL/min. The effluent was collected, then n-hexane (5 mL) and 4% acetone/n-hexane (5 mL) were added in turn, and the effluent was collected. The collected solution was then dried by rotary evaporation at 38°C and redissolved in 1.0 mL n-hexane. Before analysis, the solution was filtered through a 0.22-μM membrane.
An edible liquor sample was pretreated similar to that of soybean oil except that no purification solution was added during the pretreatment process. The filtrate was analysed by GC method, and the DBP level was calculated.
Data analysis
The ANOVA test was used to evaluate the differences between the mean values of results obtained from dual-emission CDs fluorescence ratio sensor and GC method using SAS software (SAS Institute, Cary, NC, USA).
Results and discussion
Optimisation of conditions for synthesising dual-emission CDs
In the first step, ascorbic acid was dissolved in water as a carbon source, which was decomposed and polymerised under hydrothermal conditions to form CDs. If the amount of ascorbic acid was excessive, the ascorbic acid molecules acted as surface groups on the CDs to form blue emitters, which could only be obtained in water. The CDs were also encased in alcohol molecules, forming yellow emitters. In the alcohol-water system, the excess ascorbic acid and alcohol molecules competed for CDs thus allowing dual-emission characteristics to be established. Therefore, the dual-emission fluorescent CDs could be synthesised by a one-pot solvent thermal method in one step, which was simple and feasible. The fluorescence intensity of CDs synthesised by this method did not decrease after two months of storage at 4°C.
The effect of different solvents, methanol, ethanol and ethylene glycol, on the fluorescence of CDs were investigated. The position of the emission peaks of CDs prepared using ethylene glycol (366, 430 nm) was very different from those prepared using methanol and ethanol (430, 525 nm), leading to a low fluorescence intensity, so this method was abandoned. Figure S1 shows that the fluorescence intensity of the CDs prepared using ethanol was lower than that of those using methanol at the double emission peaks, so the methanol–water system was used for preparing the experimental CDs.
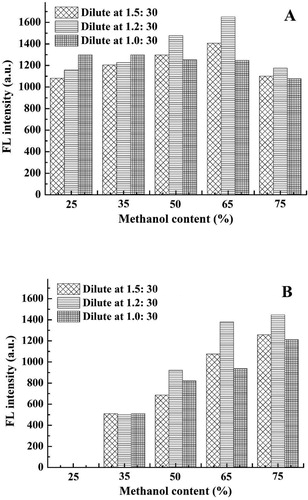
For the next step, the volume ratio of methanol and water in the CDs synthesis system was optimised. shows that the methanol content greatly affected the emission peak at 525 nm, and as it increased, the fluorescence intensity at 525 nm also increased. However, if the methanol content was too high, the fluorescence intensity at 425 nm was suppressed. Considering the fluorescence intensity of the two emission peaks in the system, 65% methanol was used to synthesise the CDs in the present study.
Figure 1. Fluorescence intensities at 430 nm (A) and 525 nm (B) of CDs prepared with different methanol contents at different dilution ratios.
FT-IR analysis of dual-emission CDs
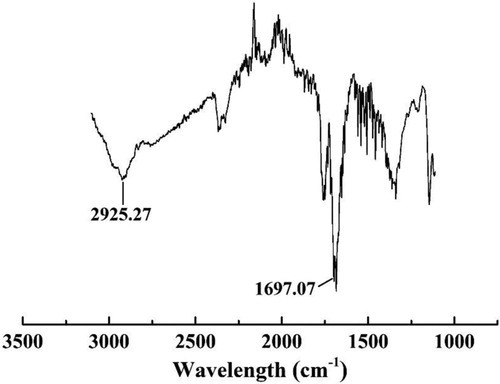
The carboxyl group on the surface of the CDs played a key role in this study, giving CDs good water solubility and allowing them to bind with the aptamer through the amide bond. To verify that the CDs synthesised in this study contained carboxyl groups on the surface, the CDs were analysed by FT-IR (). The CDs had absorption peaks at 1697.0 and 2925.27 cm−1, which indicated the presence of the C=O stretching vibration peak and O–H stretching vibration, respectively. This confirmed that carboxyl functional groups existed on the surface of the CDs.
Figure 2. FT-IR analysis of dual-emission CDs.
Optimisation of experimental conditions
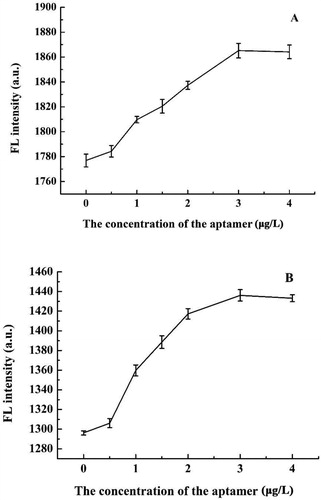
Due to the fluorescence self-quenching effect of stock solutions with high concentration of CDs, they needed to be diluted before use. As the dilution ratio increased, the fluorescence intensity tended to increase at first then decrease later (). The fluorescence intensity reached a maximum when the dilution ratio was 1.2:30, so this dilution ratio was selected.
The concentration of the aptamer was optimised to ensure that the fluorescence ratio sensor method had high sensitivity. shows that when the concentration of the aptamer was less than 3 μM, the fluorescence intensity of the aptamer-CDs complex became stronger as the concentration of the aptamer increased. This occurred because when the aptamer was combined with the CDs, the conjugation structure expanded, thus repairing the surface defects of the CDs, and enhancing the fluorescence of the system. However, when the concentration of the aptamer was further increased to reach saturation, the fluorescence intensity no longer increased. Therefore, 3 μM was chosen as the optimal concentration of aptamer in following experiment.
Figure 3. Effect of different dosages of aptamers on the fluorescence intensities at 430 nm (A) and 525 nm (B).
In the present study, GO was used to quench fluorescence, so the effect of its concentration on the sensitivity of detection was investigated. Different concentrations of GO (0.02, 0.05, 0.1, 0.15, 0.2, and 0.25 g/L) were selected to quench the fluorescence of the CDs-aptamer complex with the relationship between fluorescence intensity and GO concentration shown in Figure S2. Results indicate that as the GO concentration increased, the quenching efficiency also increased. However, if the concentration of GO was too high, fluorescence recovery would be difficult or even impossible because of its poor water solubility. The quenching efficiency was clear at a GO concentration of 0.15 g/L, with no significant difference in efficiency at higher concentrations. Therefore, 0.15 g/L was selected as the optimal concentration of GO in the present study when the concentration of aptamer was 3 μM.
The effect of different GO reaction times on fluorescence quenching was also studied (Figure S3). This shows that the fluorescence of the CDs was quickly quenched after adding GO. When GO was reacted with CDs for 5 min, the fluorescence intensity at 430 nm dropped rapidly from 1812 to 473 a.u., and at 525 nm it also decreased significantly from 1406 to 244 a.u. As reaction times increased above 5 min, the fluorescence intensity no longer changed. Therefore, 5 min was selected as the best reaction time for GO.
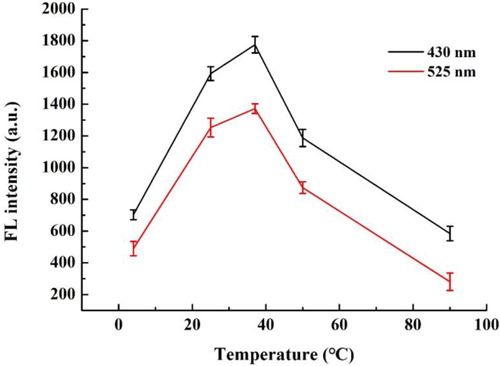
To ensure the accuracy of the method, the effect of different temperatures on the binding of the aptamers with DBP was also explored. shows that the temperature has an important effect on the fluorescence intensity. When the temperature was less than 37°C, the fluorescence intensity gradually increased with the reaction temperature increasing. At 37°C, the fluorescence intensity reached the maximum. The results indicated that the binding ability of the aptamer gradually improved with the increase of temperature, so that GO was far away from the target and the fluorescence was restored. If the temperature increased further, the fluorescence intensity decreased, because the higher temperature decreased the stability of the aptamer structure, thus reducing its specificity. So 37°C was chosen as the optimal temperature for the present study.
Figure 4. Effect of combination temperature of aptamers with DBP on the fluorescence intensities at 430 and 525 nm.
Analytical performance of immunosensor method
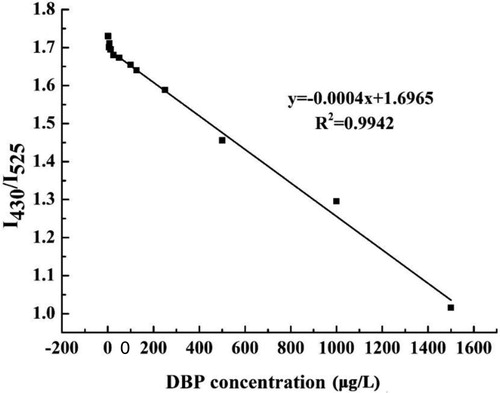
In the present study, the dual-emission CDs-aptamer fluorescence ratio immunosensor method was developed for detecting the content of DBP in food samples. shows that the DBP concentration in the range from 12.5 to 1500 μg/L exhibited a good linear relationship with the ratio of the dual wavelength fluorescence intensities (R2 = 0.9942). The linear regression equation was:where y is the DBP concentration and x is the ratio of fluorescence intensity at the two wavelengths.
Figure 5. Linear relationships between the dual-emission ratio fluorescence and DBP ranging from 12.5 to 1500 μg/L.
The fluorescence signals generated by different concentrations of DBP under the optimal experimental conditions are shown in Figure S4. As the DBP concentration increased, the aptamer-CDs complex became more separate from the GO surface, so the fluorescence intensity also gradually increased. The limit of detection of the immunosensor was 5.0 μg/L, which was lower than that of GC method (36.4 ± 0.5 ng/mL) and the maximum residue limits of DBP set by China and European Union regulations (Fang et al., Citation2016; Makkliang et al., Citation2015). So this method can meet the need of sensitivity of trace DBP determination.
Evaluation of the fluorescence ratio sensor
To evaluate the specificity of the developed method, the responses of the phthalic plasticiser, butyl benzyl phthalate, and non-phthalic plasticiser, glyceride triacetate, to the method were investigated. The experimental results in Figure S5 showed that the fluorescence intensity obtained in the presence of other plasticisers was very close to that with no addition of DBP, and that the strong fluorescence intensity produced by DBP was significantly higher than that produced by the other plasticisers. Due to the specific binding of DBP to the aptamer, the aptamer-CDs complex was separated from the surface of the GO. However, as the other plasticisers could not bind to the aptamer, the fluorescence intensity remained almost unchanged, indicating that this immunosensor method had a high selectivity for DBP.
The detection results of the immunosensor were compared with those of the single emission fluorescence method to verify its accuracy. Figure S6 shows that the single emission fluorescence method was not as linear as the dual-emission ratio fluorescence method. According to the experimental results shown in Figure S6, the single emission fluorescence method has a poor linear relationship at a low concentration, which may be due to the fact that when the content of DBP in the standard solution is too low, the interference of other factors in the experiment is more prominent, resulting in poor accuracy of the results. A comparison of the detection results at three concentrations (50, 100 and 200 μg/L) in Table S1, showed that there was no significant difference between the results from the dual-emission ratio fluorescence method and the standard solution. However, the results of the single emission measurement were significantly different from those of the standard solution because the accuracy of the single emission fluorescence method was affected by systematic errors caused by concentration changes and background interference of the instrument. Above results showed that the dual-emission ratio fluorescence method were more accurate.
To verify the feasibility of the developed method, an edible liquor sample spiked with DBP at levels of 10, 50 or 100 μg/L was detected. shows that good recoveries for the dual-emission CDs-aptamer fluorescence ratio sensor method were obtained in the range from 93.2% to 112.4%, with a relative standard deviation from 1.59% to 4.54%.
Table 1. The recoveries for DBP in the edible liquor sample by determination using dual-emission CDs-aptamer fluorescence ratio immunosensor.
To verify the practicability of the method for detecting DBP in actual food samples, soybean oil samples were tested using GC and the established dual-emission CDs-aptamer fluorescence ratio sensor method. The results of the sensor and GC methods were DBP contents of 102.2 ± 2.79 and 108.7 ± 3.05 μg/L, respectively, so the two methods provided consistent analytical results (P > 0.05). Above results showed that this newly-established sensor method could be applied to its detection in actual food samples. However, the analysis data of this method will be much affected by the operating temperature, which should be improved in the further study.
Conclusions
In this study, dual-emission CDs were synthesised using a one-pot solvent thermal method, and a simple detection method based on dual-emission CDs-aptamer fluorescence ratio immunosensor was established. This method could detect DBP well with good specificity, accuracy and sensitivity. This method has good prospects for application to the analysis of DBP in food samples.
Compliance with Ethical Standards
Ethical approval
This article does not contain any studies with animals performed by any of the authors.
Informed consent
Informed consent was obtained from all individual participants included in the study.
Supplemental Material
Download MS Word (798.6 KB)Acknowledgements
This work was financially supported by the National Key R & D Program (NO. 2016YFD04011201) and Key R & D Project of Jining (2019NYNS002).
Disclosure statement
No potential conflict of interest was reported by the author(s).
Additional information
Funding
References
- Bi, X. L., Pan, X. J., Yuan, S. J., & Wang, Q. Q. (2013). Plasticizer contamination in edible vegetable oil in a U.S. retail market. Journal of Agricultural and Food Chemistry, 61(39), 9502–9509. https://doi.org/10.1021/jf402576a
- Brossa, L., Marcé, R. M., Borrull, F., & Pocurull, E. (2003). Determination of endocrine-disrupting compounds in water samples by on-line solid-phase extraction-programmed-temperature vaporisation-gas chromatography-mass spectrometry. Journal of Chromatography A, 998(1), 41–50. https://doi.org/10.1016/S0021-9673(03)00649-6
- Carlo, M. D., Pepe, A., Sacchetti, G., Compagnone, D., Mastrocola, D., & Cichelli, A. (2008). Determination of phthalate esters in wine using solid-phase extraction and gas chromatography-mass spectrometry. Food Chemistry, 111(3), 771–777. https://doi.org/10.1016/j.foodchem.2008.04.065
- Chen, J., Xu, F., Jiang, H., Hou, Y., Rao, Q., Guo, P., & Ding, S. (2009). A novel quantum dot-based fluoroimmunoassay method for detection of enrofloxacin residue in chicken muscle tissue. Food Chemistry, 113(4), 1197–1201. https://doi.org/10.1016/j.foodchem.2008.08.006
- Cruz-Aguado, J. A., & Penner, G. (2008). Determination of ochratoxin a with a DNA aptamer. Journal of Agricultural and Food Chemistry, 56(22), 10456–10461. https://doi.org/10.1021/jf801957h
- Cui, B., Feng, X.-t., Zhang, F., Wang, Y.-l., Liu, X.-g., Yang, Y.-z., & Jia, H.-s. (2017). The use of carbon quantum dots as fluorescent materials in white LEDs. New Carbon Materials, 32(5), 385–401. https://doi.org/10.1016/S1872-5805(17)60130-6
- Ding, S., Chen, J., Jiang, H., He, J., Shi, W., Zhao, W., & Shen, J. (2006). Application of quantum dot-antibody conjugates for detection of sulfamethazine residue in chicken muscle tissue. Journal of Agricultural and Food Chemistry, 54(17), 6139–6142. https://doi.org/10.1021/jf0606961
- Duan, N., Wu, S. J., Chen, X. J., Huang, Y. K., & Wang, Z. P. (2012). Selection and identification of a DNA aptamer targeted to vibrio parahemolyticus. Journal of Agricultural and Food Chemistry, 60(16), 4034–4038. https://doi.org/10.1021/jf300395z
- Espiritu, C. A. L., Justo, C. A. C., Rubio, M. J., Svobodova, M., Bashammakh, A. S., Alyoubi, A. O., Rivera, W. L., Rollon, A. P., & O’Sullivan, C. K. (2018). Aptamer selection against a trichomonas vaginalis adhesion protein for diagnostic applications. ACS Infectious Diseases, 4(9), 1306–1315. https://doi.org/10.1021/acsinfecdis.8b00065
- Fang, H., Wang, J., & Lynch, R. A. (2016). Migration of di(2-ethylhexyl)phthalate (DEHP) and di-n-butylphthalate (DBP) from polypropylene food containers. Food Control, 73, 1298–1302. https://doi.org/10.1016/j.foodcont.2016.10.050
- Fenzl, C., Nayak, P., Hirsch, T., Wolfbeis, O. S., Alshareef, H. N., & Baeumner, A. J. (2017). Laser-scribed graphene electrodes for aptamer-based biosensing. ACS Sensors, 2(5), 616–620. https://doi.org/10.1021/acssensors.7b00066
- Frederiksen, H., Skakkebaek, N. E., & Andersson, A. M. (2007). Metabolism of phthalates in humans. Molecular Nutrition & Food Research, 51(7), 899–911. https://doi.org/10.1002/mnfr.200600243
- Gao, M., Guo, J., Song, Y., Zhu, Z., & Yang, C. J. (2017). Detection of T4 polynucleotide kinase via allosteric aptamer probe platform. ACS Applied Materials & Interfaces, 9(44), 38356–38363. https://doi.org/10.1021/acsami.7b14185
- Han, L., Liu, S. G., Dong, J. X., Liang, J. Y., Li, L. J., Li, N. B., & Luo, H. Q. (2017). Facile synthesis of multicolor photoluminescent polymer carbon dots with surface-state energy gap-controlled emission. Journal of Materials Chemistry C, 5(41), 10785–10793. https://doi.org/10.1039/C7TC03314A
- He, J. B., Liu, G. Y., Jiang, M. D., Xu, L. H., Kong, F. F., & Xu, Z. X. (2020). Development of novel biomimetic enzyme-linked immunosorbent assay method based on Au@SiO2 nanozyme labeling for the detection of sulfadiazine. Food and Agricultural Immunology, 31(1), 341–351. https://doi.org/10.1080/09540105.2020.1728234
- Ju, B., Nie, H., Zhang, X. G., Chen, Q. N., Guo, X. W., Xing, Z., Li, M. J., & Zhang, S. X. A. (2018). Inorganic salt incorporated solvothermal synthesis of multi-color carbon dots, emission mechanism and anti-bacterial study. ACS Applied Nano Materials, 1(11), 6131–6138. https://doi.org/10.1021/acsanm.8b01355
- Khan, Z. M. S., Saifi, S., Shumaila, A. Z., Khan, S. A., & Zulfequar, M. (2019). A facile one step hydrothermal synthesis of carbon quantum dots for label -free fluorescence sensing approach to detect picric acid in aqueous solution. Journal of Photochemistry and Photobiology A: Chemistry, 76, 468–480. https://doi.org/10.1016/j.jphotochem.2019.112201
- Liao, Y., Cui, X., Chen, G., Wang, Y., Qin, G., Li, M., Zhang, X., Zhang, Y., Zhang, C., Du, P., Yan, F., El-Aty, A. M. A., Wang, J., Zhang, C., & Jin, M. (2019). Simple and sensitive detection of triazophos pesticide by using quantum dots nanobeads based on immunoassay. Food and Agricultural Immunology, 30(1), 522–532. https://doi.org/10.1080/09540105.2019.1597022
- Liou, S. H., Yang, C. C., Wang, C. L., & Chiu, Y. H. (2014). Monitoring of PAEMs and beta-agonists in urine for a small group of experimental subjects and PAEs and beta-agonists in drinking water consumed by the same subjects. Journal of Hazardous Materials, 277, 169–179. https://doi.org/10.1016/j.jhazmat.2014.02.024
- Liu, D. Y., Qu, F., Zhao, X. E., & You, J. M. (2015). Generalized one-pot strategy enabling different surface functionalizations of carbon nanodots to produce dual emissions in alcohol-water binary systems. The Journal of Physical Chemistry C, 119(31), 17979–17987. https://doi.org/10.1021/acs.jpcc.5b05786
- Lu, Z. Z., Zhang, C. T., Han, C. Q., An, Q. L., Cheng, Y. T., Chen, Y. Z., Meng, R., Zhang, Y., & Su, J (2019). Plasticizer bis (2-ethylhexyl) phthalate causes meiosis defects and decreases fertilization ability of mouse oocytes in vivo. Journal of Agricultural and Food Chemistry, 67(12), 3459–3468. https://doi.org/10.1021/acs.jafc.9b00121
- Luo, X., Zhang, F. F., Ji, S., Yang, B. C., & Liang, X. M. (2014). Graphene nanoplatelets as a highly efficient solid-phase extraction sorbent for determination of phthalate esters in aqueous solution. Talanta, 120, 71–75. https://doi.org/10.1016/j.talanta.2013.11.079
- Makkliang, F., Kanatharana, P., Thavarungkul, P., & Thammakhet, C. (2015). Development of magnetic micro-solid phase extraction for analysis of phthalate esters in packaged food. Food Chemistry, 166, 275–282. https://doi.org/10.1016/j.foodchem.2014.06.036
- Marcilla, A., Garcia, S., & Garcia-Quesada, J. C. (2008). Migrability of PVC plasticizers. Polymer Testing, 27(2), 221–233. https://doi.org/10.1016/j.polymertesting.2007.10.007
- Noonan, P. S., Roberts, R. H., & Schwartz, D. K. (2013). Liquid crystal reorientation induced by aptamer conformational changes. Journal of the American Chemical Society, 135(13), 5183–5189. https://doi.org/10.1021/ja400619k
- Peng, X. W., Feng, L. J., & Li, X. G. (2013). Pathway of diethyl phthalate photolysis in sea-water determined by gas chromatography–mass spectrometry and compound-specific isotope analysis. Chemosphere, 90(2), 220–226. https://doi.org/10.1016/j.chemosphere.2012.06.045
- Ren, R. B., Zhang, Z. Y., Zhao, P. H., Shi, J. T., Han, K. C., Yang, Z. Q., Gao, D. X., & Bi, F. (2019). Facile and one-step preparation carbon quantum dots from biomass residue and their applications as efficient surfactants. Journal of Dispersion Science and Technology, 40(5), 627–633. https://doi.org/10.1080/01932691.2018.1475239
- Schecter, A., Lorber, M., Guo, Y., Wu, Q., Yun, S. H., Kannan, K., Hommel, M., Imran, N., Hynan, L. S., Cheng, D. L., Colacino, J. A., & Birnbaum, L. S. (2013). Phthalate concentrations and dietary exposure from food purchased in New York State. Environmental Health Perspectives, 121(4), 473–479. https://doi.org/10.1289/ehp.1206367
- Wang, X. M., Chen, C., Xu, L. H., Zhang, H. Y., & Xu, Z. X. (2019). Development of molecularly imprinted biomimetic immunoassay method based on quantum dot marker for detection of phthalates. Food and Agricultural Immunology, 30(1), 1007–1019. https://doi.org/10.1080/09540105.2019.1649371
- Wang, B., Wang, H. X., Zhou, W., Chen, Y., Zhou, Y., & Jiang, Q. W. (2015). Urinary excretion of phthalate metabolites in school children of China: Implication for cumulative risk assessment of phthalate exposure. Environmental Science & Technology, 49(2), 1120–1129. https://doi.org/10.1021/es504455a
- Watkins, D. J., Eliot, M., & Sathyanarayana, S. (2014). Variability and predictors of urinary concentrations of phthalate metabolites during early childhood. Environmental Science & Technology, 48(15), 8881–8890. https://doi.org/10.1021/es501744v
- Wittassek, M., Koch, H. M., Angerer, J., & Brüning, T. (2011). Assessing exposure to phthalates – the human biomonitoring approach. Molecular Nutrition & Food Research, 55(1), 7–31. https://doi.org/10.1002/mnfr.201000121
- Wu, S., Liu, L., Duan, N., Li, Q., Zhou, Y., & Wang, Z. (2018). An aptamer-based lateral flow test strip for rapid detection of zearalenone in corn samples. Journal of Agricultural and Food Chemistry, 66(8), 1949–1954. https://doi.org/10.1021/acs.jafc.7b05326
- Xiao, D. L., Pan, R. F., Li, S. Q., He, J., Qi, M., Kong, S. M., Gu, Y., Lin, R., & He, H. (2015). Porous carbon quantum dots: One step green synthesis via L-cysteine and applications in metal ion detection. RSC Advances, 5(3), 2039–2046. https://doi.org/10.1039/C4RA11179F
- Yang, J. J., Zhang, Z. F., Pang, W. T., Chen, H. J., & Yan, G. Q. (2019). Graphene oxide based fluorescence super-quencher@QDs composite aptasensor for detection of Ricin B-chain. Sensors and Actuators B: Chemical, 301, 127014. https://doi.org/10.1016/j.snb.2019.127014
- Zhang, M. C., Hu, Y. R., Liu, S. H., Cong, Y., Liu, B. L., & Wang, L. (2013). A highly sensitive enzyme-linked immunosorbent assay for the detection of dipropyl phthalate in plastic food contact materials. Food and Agricultural Immunology, 24(2), 165–177. https://doi.org/10.1080/09540105.2012.670615
- Zhang, Z. W., Li, Y. Y., Li, P. W., Zhang, Q., Zhang, W., Hu, X. F., & Ding, X. X. (2014). Monoclonal antibody-quantum dots CdTe conjugate-based fluoroimmunoassay for the determination of aflatoxin B1 in peanuts. Food Chemistry, 146, 314–319. https://doi.org/10.1016/j.foodchem.2013.09.048
- Zhang, M. C., Wang, Q. E., & Zhuang, H. S. (2006). A novel competitive fluorescence immunoassay for the determination of dibutyl phthalate. Analytical and Bioanalytical Chemistry, 386(5), 1401–1406. https://doi.org/10.1007/s00216-006-0703-z
- Zhao, H. M., Huang, H. B., Luo, Y. M., Huang, C.-Q., Du, H., Xiang, L., Cai, Q.-Y., Li, Y.-W., Li, H., Mo, C.-H., & He, Z. (2018). Differences in root physiological and proteomic responses to dibutyl phthalate (DBP) exposure between low- and high-DBP accumulation cultivars of Brassica parachinensis. Journal of Agricultural and Food Chemistry, 66(51), 13541–13551. https://doi.org/10.1021/acs.jafc.8b04956