
ABSTRACT
This research was designed to investigate if antioxidant sulforaphane (SFN) alleviates methamphetamine (METH)-induced neurotoxicity by activation of the Nrf2-mediated pathway. Oxidative damage, apoptosis and mitochondrial membrane potential were evaluated in PC12 cells or the prefrontal cortex of SD rats post METH treatment with/without SFN. In addition, knockdown of Nrf2 expression in PC12 cells was used to further study the underlying mechanism. The results showed that METH exposure induced increased oxidative damage and apoptosis accompanied by decreased expressions of Nrf2, HO-1 and GCS in PC12 cells and the prefrontal cortex of SD rats. Meanwhile SFN effectively prevented METH-induced cell oxidative damage, apoptosis and mitochondrial membrane potential; however, the knockdown of Nrf2 expression partly reversed the protective effect of SFN in reducing METH-induced oxidative damage and apoptosis in PC12 cells. These results indicate that SFN might be a promising functional food-derived compound for preventing METH-induced neurotoxicity via the Nrf2-mediated pathway.
1. Introduction
Methamphetamine (METH) abuse has been recognized as a major global health issue in recent decades (Nordahl et al., Citation2003). METH is a psychostimulant drug that triggers severe effects to diverse organs, including the brain, lungs and immune system (Prakash et al., Citation2017; Ramirez et al., Citation2009; Ramirez et al., Citation2018) via multiple mechanisms, such as oxidative stress, apoptosis and inflammation (Shah et al., Citation2013; Xu et al., Citation2018). Specifically, the oxidative stress-induced production of excess free radicals has been shown to be mainly responsible for the neurotoxicity caused by METH (Lord et al., Citation2010). However, there is no effective medication for treating METH-induced neurotoxicity because the exact molecular mechanisms underlying in the nervous system remain unclear.
Oxidative damage is mainly correlated with the overproduction of reactive oxygen species (ROS) and reactive nitrogen species (RNS). METH exposure induced oxidative stress via increasing ROS production in rat hippocampal neurons (Kang et al., Citation2019). RNS also plays an important role in regulating membrane potential to protect mitochondria from the oxidative damage induced by METH (Meo et al., Citation2016; Xiong et al., Citation2018), for instance, NO production is demonstrated to be responsible for cell late apoptosis (Murray et al., Citation1997). Meanwhile, an accumulation of ROS/RNS production can induce oxidative DNA damage in the rat striatum post METH treatment (Johnson et al., Citation2015; Wang et al., Citation2019). Consequently the increased DNA damage is related to elevated oxidative stress and decreased antioxidant capacity (Banerjee et al., Citation2016; Szeto et al., Citation2014). Extensive research has shown that the potent nuclear factor erythroid 2-related factor 2 (Nrf2) is essential as a redox gene in the alleviation of oxidative stress (Jumnongprakhon et al., Citation2015). Nrf2 plays an important role in cellular protection against oxidative damage via regulating its downstream antioxidant genes, including heme oxygenase-1 (HO-1) and glucosylceramide synthase (GCS) (Kim et al., Citation2017). However, the role of Nrf2 in the mediation of the antioxidant pathway in METH-induced oxidative damage has not been fully investigated.
Apoptosis is a type of cell death in response to physiological and pathological conditions. METH exposure is demonstrated to induce neurotoxic responses that can lead to cellular apoptosis, as demonstrated by an increased apoptotic rate in SH-SY5Y cells and markedly elevated expressions of cleaved caspase 3 in the brains of C57BL/6J mice (Qiao et al., Citation2019; Wongprayoon & Govitrapong, Citation2017). In addition, Brant et al. (Citation2019) found that METH treatment caused mitochondrial dysfunction in C6 glial cells, which is also correlated with apoptosis (Thrash-Williams et al., Citation2013). In this research, the detailed mechanism of METH-induced apoptosis in PC12 cells will be elucidated.
Naturally occurring isothiocyanates sulforaphane (SFN) is found mostly in cruciferous vegetables, such as broccoli and cabbages (Ares et al., Citation2015; Tarozzi et al., Citation2013). Pharmacological studies have shown that SFN might be a promising agent in the protection of the central nervous system because it can easily cross the blood-brain barrier (Sajja et al., Citation2017). SFN is a powerful antioxidant. Researchers have demonstrated that SFN mainly exerts its cytoprotective effects via the elimination of excess free radicals through the activation of multiple cellular targets both in vitro and in vivo (Jiao et al., Citation2017; Wang, Xu et al., Citation2017). Furthermore, SFN is recognized as a Nrf2 agonist that could effectively protect cells against oxidative stress and cell death by stimulating Nrf2 and its downstream antioxidant genes HO-1 and GCS both in vitro and in vivo to eliminate excessive ROS production (Yang et al., Citation2018). SFN is also known to prevent DNA damage and apoptosis in cells (Kim & Keum, Citation2016; Menegon et al., Citation2016). The cytoprotective effects of SFN on neuronal death have also been well-documented (Poulose et al., Citation2017), which might contribute to the therapeutic function of SFN in regulating METH-induced neurotoxicity. and therefore more studies are still needed to determine whether SFN could prevent METH-induced neurotoxicity by mitigating oxidative damage..
The purpose of this study was to investigate the important role of SFN in mediating METH-induced neurotoxicity and to determine whether SFN exerts neuroprotective effects via alleviating METH-induced oxidative damage by affecting expressions of Nrf2 and its downstream antioxidant HO-1 and GCS proteins. Therefore, the current study was designed to examine the potential function of SFN in preventing METH-induced neuronal oxidative damage and apoptosis by mediating Nrf2- mediated pathway,, which might shed light on the application of SFN in future clinical treatment of METH-induced neurotoxicity.
2. Materials and methods
2.1. Chemicals
Hubei Public Security Bureau generally provided METH for the current study. Trypsin, penicillin, RPMI 1640 culture medium, streptomycin and fetal bovine serum (FBS) were commercially available from Life Science (Carlsbad, USA). DCFH-DA, MTT, 95% pure SFN (Cat. #S6317) and dimethyl sulfoxide (DMSO) were obtained from Sigma Chemical Company (St Louis, USA). The MuseTM Apoptosis Assay Kit and MitoPotential Assay Kit were purchased from the Millipore Company (Darmstadt, Germany). NO kit was from Beyotime Company (Haimen, China). The primary antibodies used were Nrf2 antibody (Boster Company, China), Cleaved caspase 3, HO-1 and GCS antibodies (Absin Bioscience Inc, China), GAPDH antibody (Boster Company, China), β-actin and Lamin B antibodies (Cell signaling, USA). The anti-rabbit HRP-conjugated secondary antibody (Boster Company, China). Nrf2 shRNA lentiviral and Control shRNA lentiviral were totally obtained from Santa Cruz Company (Santa Cruz, USA).
2.2. Cultivation of cell lines
Rat adrenal pheochromocytoma tumour (PC12) cell lines were obtained from Shanghai Cell Bank of the Chinese Academy of Sciences and were used as a cell model in the current study. PC12 cells were cultured with an RPMI-1640 medium including FBS [10% (v/v)] and antibiotics including 100 U/ml penicillin and 100 μg/ml streptomycin. PC12 cells were cultured in a humid environment with a 5% (v/v) CO2 incubator. The cells were then collected and plated in culture plates at a density of 5 × 10⁴ (96-well), 3 × 10⁵ (24-well) and 2 × 10⁶ (6-well) cells/well respectively followed by diverse experimental procedures.
2.3. Animals with drug treatment and tissue collection
The adult male Sprague Dawley (SD) rats (170–210 g, 6–8 weeks old) were obtained from Beijing vital river laboratory animal technology co., ltd. The animals were raised with cages in a constant temperature room (about 22 °C) at a 12 h light/dark cycle. Animal care and experimental procedures were in accordance with the Institutional Animal Care and Use Committee at the Jianghan University. Specifically, animal experiments were divided into two parts:
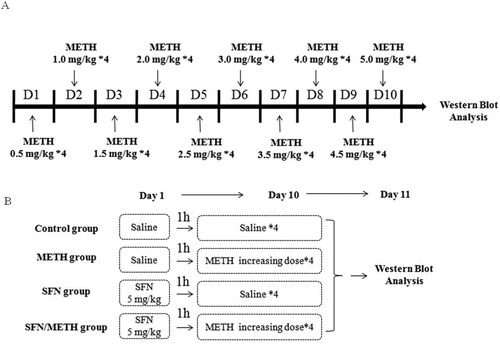
Experiment 1: Animals were habituated to animal facilities for at least 3 days before experiments. The rats were divided randomly into two groups (n = 4/group): saline control group and chronic METH exposure group. METH was dissolved in saline. The rats in the chronic METH exposure group received intraperitoneal injections of METH for 10 days following the schedule in (A). The saline control group (vehicle group) rats received a similar volume of physiological 0.9% saline. The METH exposure paradigm was selected to replicate the behavior of long-term human drug abusers according to the reference with little modification (Li et al., Citation2017). All animals survived during and after METH exposure.
Experiment 2: Rats were distributed into four groups at random (n = 4/group): saline control group and chronic METH exposure group, SFN group, as well as combined application of SFN and METH exposure group. METH was administrated in accordance with the schedule in (A). To study the therapeutic effect of SFN, SFN (5 mg/kg) (Jang & Cho, Citation2016; Noh et al., Citation2015) i.p. injection was chosen followed by the reference and administrated 1 h before the METH first injection everyday ((B)). All rats were sacrificed by cervical dislocation after anesthesia post the last injection in 24 h. Then removed the brain samples, and dissected the cortex samples on a cold plate, quickly frozen, and finally kept samples at −80°C refrigerator.
Figure 1. The design of animal experiments. Animal experimental procedures were shown in A and B. In Experiment 1, rats were divided randomly into saline group and METH exposure group. The rats in the METH exposure group received intraperitoneal injections of METH for 10 days following the schedule in A. The saline group rats received a similar volume of saline. In Experiment 2, rats were treated with saline, METH or SFN by intraperitoneal injection (i.p.). Specifically, the method of METH treatment in B was followed by the same METH increasing dose treatment procedure in A. The detailed experimental procedures were described in Method 2.3.
2.4. METH exposure treatment and incubation with SFN
PC12 cells were treated by METH with 3 mM METH for 24 h to examine the effects of METH on neurotoxicity. In addition, the application of METH (3 mM) and SFN (1–10 μM) treated PC12 cells were also observed in current study. Then cells were harvested to be used in the following experiments.
2.5. Cell viability analysis
MTT was applied to detect the cell viability. Briefly, cells were plated on a 96-well plate (Corning, USA) in an incubator overnight. Then cells were then incubated with diverse substance. 20 μl of MTT reagent was added to all samples for another 4 h in the incubator, and 150 μl of DMSO was incubated with the samples. The absorbance was detected at 490 nm (A490) by microplate reader (Thermal Scientific, USA).
2.6. The generation of NO
The measurement of the sodium nitrite quantity was an efficient way to examine NO production. Briefly, cultured PC12 cells were treated with different substances. Supernatants were kept to calculate NO production after 24 h of incubation. Generally, both the tested sample supernatants and the standard samples were transferred to 96-well plates (50 μl/well). Next, Griess Reagents (50 μl/well) were applied to all samples. The results were then determined using a microplate reader at an absorbance of 540 nm. The standard curve was made to calculate the production of NO for each group.
2.7. ROS level detection
The fluorescent label DCFH-DA (Sigma-Aldrich, USA) was applied to determine the intracellular ROS level. Generally, PC12 cells were treated with diverse substances and the DCFH-DA probe (100 μmol/l) was used to treat cells for 1 h. Finally, the DCFH-DA probe was removed and the fluorescent signal was measured at an absorbance of Ex485nm/Em538nm by a fluorescent Automatic Microplate Washer (Thermo Scientific company, USA).
2.8. Annexin V apoptosis staining
The Muse Annexin V & Dead Cell Kit was applied to measure the apoptosis rate. Briefly, PC12 cells were incubated with different substances. Cells were suspended in an RPMI 1640 complete medium (100 μl) and mixed cells with an apoptotic detection reagent (100 μl) for another 20 min. The cell apoptosis rates were calculated using the Muse™ Cell Analyzer.
2.9. Evaluation of mitochondrial membrane potential (ΔΨm)
Alterations of ΔΨm were measured by the Muse MitoPotential assay. Generally, PC12 cells were treated with diverse substances. Cells were dissolved in 100 μL PBS, and then the MitoPotential working solution (95 μL) was incubated with cells for 20 min. Cells were then incubated with 5 μl of the 7-AAD dye reagent for another 5 min in the dark. Alterations in the ΔΨm were determined by the Muse™ Cell Analyzer.
2.10. RNA interference
PC12 cells were transfected with Nrf2 shRNA (sc156128, Santa Cruz Biotechnology, USA) or control shRNA (sc108080, Santa Cruz Biotechnology, USA), and a transfection reagent was used following a previous study (Choi & Kim, Citation2018). In brief, cells were seeded on a 6-well plate (grown to 70%–80%) and were treated with Nrf2 shRNA or control shRNA lentiviral particles (containing 5 μg/ml polybrene to promote transfection efficacy) for 24 h. Next, the culture medium was discarded, and cells were incubated with a complete medium without polybrene overnight. The cells were then grown in a selective medium with puromycin (5 μg/ml) for an additional 72 h incubation. Until the surviving shRNA lentiviral transfected cells formed colonies, they were seeded at a density of 1.0 × 10⁶ cells/ml in 100 mm culture dishes. The cells were expanded in a fresh puromycin-containing medium every 3–4 d until the assay for a stable shRNA expression which was examined by Western Blot.
2.11. Western blot
Protein extracts were generally prepared in a cell lysis buffer (Boster Company, China) with PMSF and a Cocktail. Specifically, nuclear Nrf2 protein was obtained by the Nuclear and cytoplasmic protein extraction kit. The BCA assay kit was used to calculate the protein concentrations. The procedures of the Western blot were manipulated as previously describhed (Gu et al., Citation2017). Generally, proteins were separated with SDS-PAGE gel (10%) and transferred to the PVDF membrane. The proteins were then incubated with diverse primary antibodies: anti-γH2AX (1:500), anti-Nrf2 (1:500), anti-HO-1 (1:500), anti-GCS (1:1000), anti-cleaved caspase-3 (1:500), anti-β-actin (1:1000), anti-GAPDH (1:1000) and anti-laminB (1:500). They were incubated with PVDF membranes in TBST (containing 5% milk) at 4°C overnight. After incubation with these primary antibodies, the membranes were washed with TBS for 3 times. The HRP-conjugated secondary antibodies (Boster Company, China) were further incubated with membranes at dilution of 1:3000 for 1 h. Finally, the proteins were detected using an ECL kit (Thermo Fisher, USA). GenTools Software (Gene Company, China) was used to calculate the band quantification. β-actin, GAPDH or laminB were used as corresponding loading controls. Hence, the density values represented the relative intensity of all bands against the corresponding loading controls.
2.12. Alkaline comet assay
The comet assay is an effective method used to determine DNA damage at the single cell level. The DNA damage analysis procedure was performed in accordance with a former published research method (Jeong et al., Citation2019). In brief, PC12 cells were incubated with diverse substance treatments. The low melting point agarose (5%) was treated with cells, and then the cells were further seeded on pre-treated microscope slides for 10 min. The slides were placed in a cell lysis solution for 1.5 h at 4°C. Then slides were electrophoresed for 20 min to disentangle the DNA. Finally, the slides were washed and stained with SuperStain (Cwbio Company, China) for 20 min avoiding light. The pictures were analyzed with a fluorescence microscopy (Olympus, Japan). The comets were analyzed with Comet assay software project 12.2 software (CASP). DNA damage was calculated according to the percentage of DNA in the tail.
2.13. Statistical analysis
Data are expressed as mean ± standard error ( ± SE), and the experiments were completed three times. The data statistical comparison was analyzed by the one-way analysis of variance (ANOVA) using the application software of SPSS 16.0 (IBM Corporation, New York, USA) followed by a Tukey post hoc analysis, and P < 0.05 was considered a significant difference.
3. Results
3.1. METH exposure likely induced oxidative damage and apoptosis via the down-regulation of the Nrf2/HO-1/GCS pathway both in vitro and in vivo
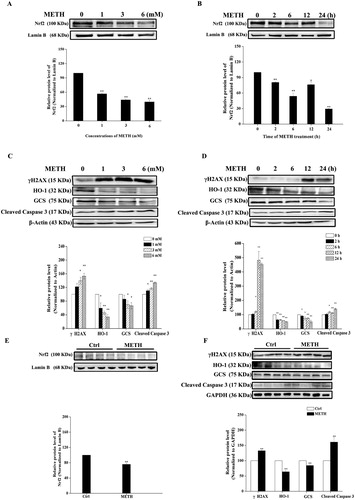
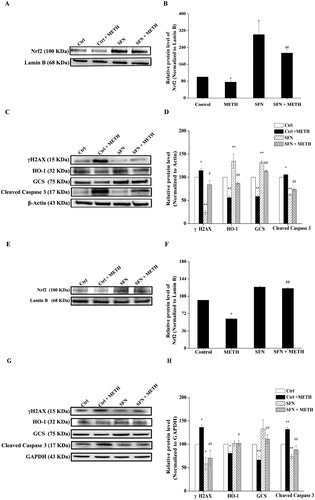
The Western blot was used to investigate the underlying mechanism of METH-induced oxidative damage and apoptosis both in vitro and in vivo. (A and C) showed that both 3 and 6 mM of METH treatment effectively decreased Nrf2, HO-1 and GCS protein expressions, while it markedly increased both γH2AX and cleaved caspase 3 protein expressions (P < 0.01 or P < 0.05). In addition, protein expressions post different time points of METH treatment were evaluated. (B and D) indicate that compared to the control group, Nrf2, HO-1 and GCS protein expressions were significantly declined (P < 0.01 or P < 0.05), while γH2AX and cleaved caspase 3 protein expressions increased significantly post different time points of METH treatment (P < 0.01 or P < 0.05). Similar results were also demonstrated in the prefrontal cortex of SD rats following chronic METH exposure. (E and F) show that Nrf2, HO-1 and GCS protein levels were reduced significantly (P < 0.01 or P < 0.05), while the protein expressions of γH2AX and cleaved caspase 3 increased significantly (P < 0.01 or P < 0.05) in rats post METH treatment. Taken together, these results indicated that METH exposure induced oxidative DNA damage and apoptosis likely via inhibiting the Nrf2/HO-1/GCS antioxidant signaling pathway both in vitro and in vivo.
Figure 2. METH-induced oxidative stress, oxidative DNA damage and apoptosis in vitro and in vivo. Western blot and quantitative analyses were used to examine Nrf2 expression in PC12 cells (A, B) and prefrontal cortex of SD rats (E). Western blot with quantitative analyses was also used to determine the expressions of γH2AX, HO-1, GCS, and cleaved caspase 3 induced by METH treatment in PC12 cells (C, D) and prefrontal cortex of SD rats (F). Protein data values were normalized to either actin, GAPDH or lamin B level. Results were expressed as mean ± standard error of three separate experiments. Statistical significance: *P < 0.05 or **P < 0.01 compared to the control group.
3.2. Effect of SFN on cell viability and oxidative damage in PC12 cells post METH exposure
An MTT assay was applied to evaluate the cytotoxicity of SFN (1, 2.5, 5, 10 μM) in PC12 cells post METH treatment. In accordance with current results and previous related published researches (Li et al., Citation2017; Qiao et al., Citation2014; Tian et al., Citation2017; Xiong et al., Citation2018), 3 mM METH was chosen to conduct this study. As shown in (A), METH exposure significantly decreased cell viability compared to the control group (P < 0.05), while different concentrations of SFN markedly increased cell viability in contrast to the METH treated group (P < 0.01 or P < 0.05), especially, the cell survival rates were over 90% after treatment of SFN at the concentration of 5 and 10 μM, indicating that SFN effectively prevented METH-induced decreased cell survival rates in PC12 cells.
Figure 3. The effect of SFN on cell viability and oxidative damages in PC12 cells post METH treatment. PC12 cells were divided in to control, METH treated, and combined of SFN (1, 2.5, 5, 10 μM) and METH (3 mM) treated groups. MTT method was used to examine the cell viability in PC12 cells after SFN (1, 2.5, 5, 10 μM) and METH (3 mM) treatment (A); the probe DCFH-DA (100 μmol/L) was used to detect the intracellular ROS level in different groups (B); and all samples were incubated with Griess Reagent kits to determine the intracellular production of NO according to the protocol (C); while comet assay (D) with corresponding quantitative analysis (E) was used to detect oxidative DNA damages. All the results were expressed as mean ± standard error of three separate experiments. Statistical significance: *P < 0.05 or **P < 0.01 compared to the control group, #P < 0.05 or ##P < 0.01 compared to the METH group.
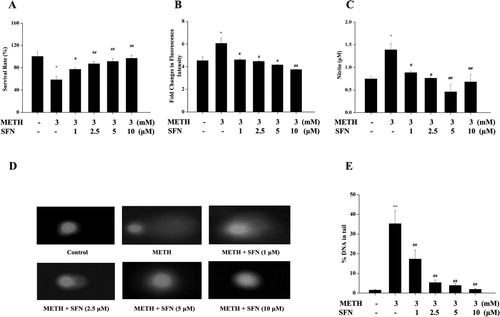
Next, the effect of SFN on oxidative damage post METH treatment was determined by examining the production of ROS and NO, as well as oxidative DNA damage. (B) showed that METH treatment significantly increased the production of ROS compared with the control group, yet SFN markedly decreased levels of ROS in contrast to the METH treated group (P < 0.01 or P < 0.05). Similarly, the production of NO ((C)) was significantly increased post METH treatment in comparison to the control group, while different concentrations of SFN markedly decreased generation of NO post METH treatment compared to the METH treated group (P < 0.01 or P < 0.05), especially treatment of 5 μM SFN decreased NO production over 50% in PC12 cells post METH exposure in contrast to the METH treated group (P < 0.01). In addition, the comet assay was used to evaluate the effect of SFN on cell oxidative DNA damage post METH treatment as shown by the percentage of DNA in the tail. (D) and its quantitative result ((E)) respectively showed that METH-induced a significant elevation in DNA damage in PC12 cells compared with the control group (P < 0.01), meanwhile the addition of SFN in PC12 cells post METH treatment induced a significant decline in DNA damages (all P < 0.01). Consequently, these results suggested SFN promoted cell viability and prevented METH-induced oxidative damage in PC12 cells.
3.3. Effect of SFN on cell apoptosis and mitochondrial membrane potential post METH exposure in PC12 cells
Annexin V/7-AAD was applied to detect the METH-induced apoptotic effect in PC12 cells. As shown in (A and B), METH-only treated PC12 cells exhibited a significant rise in the apoptotic rate, compared with the control group (P < 0.01). The SFN significantly decreased the apoptotic rate when the concentrations were 2.5 and 10 μM compared with the METH-treated group (P < 0.05).
Figure 4. The effect of SFN on apoptosis rate (A) and total depolarization of mitochondria (B) were evaluated in PC 12 cells post METH treatment. Cells were treated with METH (3 mM) and SFN (1, 2.5, 5, 10 μM) for 24 h and were analyzed by Muse Annexin V & Dead Cell assay kit for cell apoptosis evaluation. A representative dot plots in live, dead, late apoptotic/dead and early apoptotic phase is shown in the figure A, while the quantification of the mean percentage of cell apoptosis is expressed in the figure B. Cells were treated with METH (3 mM) and SFN (1, 2.5, 5, 10 μM) for 24 h and analyzed by Muse MitoPotential assay kit. A representative dot plots in live, depolarized/live, depolarized/dead and dead phase is shown in figure C, while the mean percentage of the total depolarization is expressed by a histogram in the figure D. Each representative calculation was from three independent experiments for cell apoptosis and mitochondria membrane potential tests. Results were expressed as mean ± standard error of three separate experiments. Statistical significance: *P < 0.05 or **P < 0.01 compared to the control group, #P < 0.05 compared to the METH group.
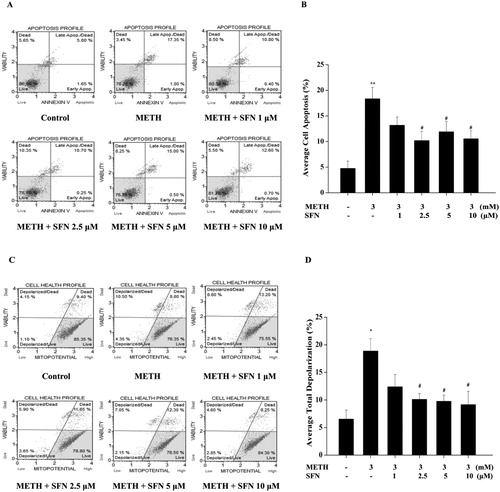
ΔΨm is an important marker of mitochondrial dysfunction, while the loss of ΔΨ is also a hallmark for apoptosis. (C and D) showed that METH-induced a significant increase in the total depolarization of the mitochondria compared with the control group (P < 0.05), which indicated that a significant dissipation of ΔΨ was triggered by METH treatment. Different concentrations of SFN (2.5–10 μM) significantly decreased the total depolarization in contrast with the METH treated group (P < 0.05). Hence, these results showed that SFN might inhibited cell apoptosis via the mitochondria-dependent apoptotic pathway.
3.4. Effect of SFN in mediating the expressions of γH2AX, cleaved caspase 3 and the Nrf2/HO-1/GCS pathway both in vitro and in vivo
The Western blot analysis was used to determine whether SFN exerted neuroprotective effects against METH-induced oxidative DNA damage and apoptosis via the activation of the Nrf2/HO-1/GCS pathway. The results showed that in comparison with the control group, METH significantly increased the expressions of γH2AX and cleaved caspase 3, while significantly decreased the expressions of Nrf2, HO-1 and GCS; however, the pre-treatment of SFN (5 μM) in PC12 cells effectively decreased expressions of γH2AX and cleaved caspase 3, as well as increased the expression of Nrf2, HO-1 and GCS in PC12 cells post METH exposure (P < 0.01 or P < 0.05, (A–D)). Similarly, as shown in (E–H), the protein expressions of Nrf2, HO-1, and GCS were significantly reduced in the prefrontal cortex of rats with repeated METH exposure, while the protein expressions of γH2AX and cleaved caspase 3 were significantly increased. Moreover, pre-treatment with 5 mg/kg SFN could increase protein expressions of Nrf2, HO-1, GCS, and decreased expressions of γH2AX and cleaved caspase 3 post METH treatment in prefrontal cortex of SD rats (P < 0.01 or P < 0.05). Therefore, it is speculated that SFN likely decreased oxidative DNA damage and apoptosis induced by METH exposure via the activation of the Nrf2/HO-1/GCS pathway.
Figure 5. The regulation of SFN on oxidative DNA damage, apoptosis and Nrf2/HO-1/GCS pathway post METH treatment both in vitro and in vivo. Based on MTT results and previous published articles, both PC12 cells and rats were divided into control, METH treated, SFN and SFN + METH treated groups. Western blot (A, C) and quantitative analyses (B, D) were used to determine the expressions of γH2AX, cleaved caspase 3, Nrf2, HO-1 and GCS in PC12 cells post 24 h METH treatment; while figure E and G with corresponding quantitative analyses (F, H) represented the expression changes of γH2AX, cleaved caspase 3, Nrf2 and its related downstream proteins in prefrontal cortex of rats post 24 h METH treatment. Protein data values were normalized to actin, GAPDH or lamin B level. Results were expressed as mean ± standard error of three separate experiments. Statistical significance: *P < 0.05 or **P < 0.01 compared to the control group, #P < 0.05 or##P < 0.01 compared to the METH group.
3.5. Effect of SFN in regulating METH-induced PC12 cell viability via the activation of Nrf2
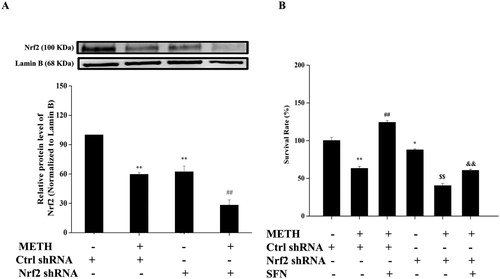
To further determine whether Nrf2 was involved in the protective effects of SFN in METH-induced neurotoxicity, western blot was used to confirmed the successful knock down of Nrf2 expression in PC12 cells post METH exposure. As shown in (A), the Nrf2 shRNA group post METH treatment indicated a further decrease in Nrf2 expression compared to the Nrf2 shRNA group (P < 0.01). The cell viability of PC12 cells post Nrf2 shRNA transfection was also determined by the MTT method. The results ((B)) showed that SFN significantly increased cell viability in contrast to the control group post METH treatment. Nrf2 shRNA group expressed a significant decrease in cell viability compared with the control shRNA group (P < 0.05). Nrf2 shRNA group post 24 h of METH treatment showed a significant decrease in cell viability in comparison with the Nrf2 shRNA group (P < 0.01), while the cell viability of the SFN and METH treated Nrf2 shRNA group significantly decreased compared with the SFN and METH treated control shRNA group (P < 0.01), indicating that the knockdown of Nrf2 partly inhibited the protective effect of SFN in METH-induced decreased cell viability in PC12 cells.
Figure 6. The regulation of SFN on cell viability by activation of Nrf2 in PC12 cells post METH treatment. Cells were divided into control shRNA group, control shRNA + METH group, control shRNA + METH + SFN group, Nrf2 shRNA group, Nrf2 shRNA + METH group, Nrf2 shRNA + METH + SFN group. Expression of Nrf2 was evaluated in Nrf2 shRNA transfected PC12 cells by western blot to confirm the success knock-down of Nrf2 expression in PC12 cells (A); MTT method was applied to examine the cell viability in Nrf2 transfected PC12 cells, as well as to determine the effect of SFN on cell viability in Nrf2 shRNA transfected PC12 cells (B). Results were expressed as mean ± standard error of three separate experiments. Statistical significance: **P < 0.01 compared to the control group, #P < 0.05 compared to the METH group, $$P < 0.01 compared to the Nrf2 shRNA group. &&P < 0.01 compared to the METH and SFN treated control shRNA group.
3.6. SFN significantly decreased apoptosis and mitochondria membrane potential via the activation of Nrf2 in PC12 cells post METH exposure
Apoptosis and mitochondrial dysfunction were also examined during the Nrf2 knockdown experiments induced by METH treatment. In (A,B), the apoptotic rate of the Nrf2 shRNA group also increased significantly in comparison with the control shRNA transfected group (P < 0.01). The Nrf2 shRNA group after METH exposure showed a further increase in the apoptotic rate in contrast with the METH treated control shRNA group (P < 0.05). The addition of SFN to the METH treated Nrf2 shRNA group increased the apoptotic rate significantly compared with the SFN and METH treated control shRNA group (P < 0.05)
Figure 7. The regulation of SFN on cell apoptosis rate and mitochondrial membrane potential by activation of Nrf2 in PC12 cells post METH treatment. Cells were divided into control shRNA group, control shRNA + METH group, control shRNA + METH + SFN group, Nrf2 shRNA group, Nrf2 shRNA + METH group, Nrf2 shRNA + METH + SFN group. Knock-down of Nrf2 expression in PC12 cells post METH treatment was analyzed by Muse Annexin V & Dead Cell assay for cell apoptosis evaluation. A representative dot plots in live, dead, late apoptotic/dead and early apoptotic phase is shown in the figure A, while the quantification of the mean percentage of cell apoptosis is expressed in the figure B. Muse MitoPotential assay was used to detect mitochondrial membrane potential in Nrf2 knock-down PC12 cells. A representative dot plots in live, depolarized/live, depolarized/dead and dead phase is shown in figure C, while the mean percentage of the total depolarization is expressed by a histogram in the figure D. Each representative calculation is from three independent experiments for cell apoptosis and mitochondrial membrane potential analyses. Results were expressed as mean ± standard error of three separate experiments. Statistical significance: *P < 0.05 or **P < 0.01 compared to the control group, #P < 0.05 compared to the METH treated control shRNA group, $$P < 0.01 compared to the Nrf2 shRNA group. &P < 0.05 compared to the METH and SFN treated control shRNA group.
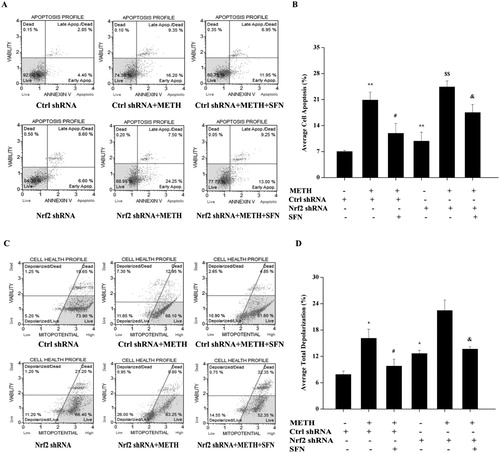
As shown in (C,D), SFN markedly decreased total depolarization compared to the METH treated control shRNA group (P < 0.05), while the Nrf2 shRNA group showed a significant rise in total depolarization, compared with the control shRNA group (P < 0.05), indicating a significant dissipation of ΔΨ was observed in Nrf2 shRNA group. Supplement of SFN significantly decreased the total depolarization in METH treated control shRNA group, compared to the METH treated control shRNA group (P < 0.05). However, the results showed that after knockdown of Nrf2, the supplement of SFN significantly increased the total depolarization in METH treated Nrf2 shRNA group, compared to the SFN and METH treated control shRNA group (P < 0.05), suggesting that inhibition of Nrf2 expression significantly attenuated the protective effect of SFN in preventing mitochondrial dysfunction in PC12 cells post METH treatment. Hence the knockdown of Nrf2 significantly inhibited the protective effects of SFN in METH-induced apoptosis and mitochondrial dysfunction. These results also suggested that SFN protected cells against the mitochondria-dependent apoptotic pathway likely by stimulating Nrf2 expression.
3.7. SFN effectively prevented oxidative damage via the activation of the Nrf2/HO-1/GCS pathway in PC12 cells post METH exposure
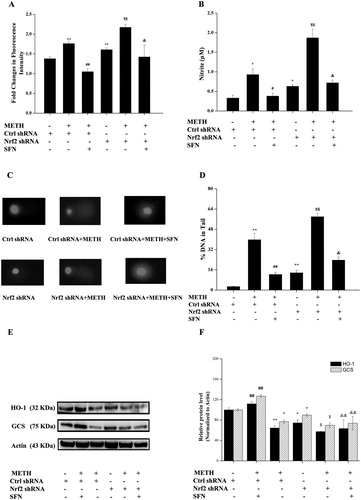
(A and B) indicated that the production of ROS and NO in the Nrf2 shRNA group increased significantly in contrast with the control shRNA PC12 cells (P < 0.01 or P < 0.05). In addition, METH treated Nrf2 shRNA group exhibited a further increased production of ROS and NO compared with the METH treated control shRNA group (P < 0.05). The supplement of SFN for the METH treated Nrf2 shRNA group significantly increased the production of ROS and NO in comparison with the SFN and METH treated control shRNA group (P < 0.05). The comet assay ((C and D)) showed that SFN effectively decreased DNA damage in the post METH treated control shRNA group in contrast to the METH treated control shRNA group (P < 0.01). The combined treatment of METH and SFN in the Nrf2 shRNA group significantly increased DNA damage in comparison with the SFN and METH treated control shRNA group (P < 0.05). To investigate the mechanism of SFN involved in mediating METH-induced oxidative damage, the expressions of HO-1 and GCS were analyzed in PC12 cells. (E–F) showed that METH treated Nrf2 shRNA group further decreased the expressions of HO-1 and GCS in contrast to the METH treated control shRNA group (P < 0.05 or P < 0.01). While the expressions of HO-1 and GCS in SFN and METH treated Nrf2 shRNA group significantly decreased compared with that in the SFN and METH treated control shRNA group (P < 0.05). These results together indicated that SFN exerted its anti-oxidant property via the activation of the Nrf2-mediated pathway in PC12 cells post METH treatment.
Figure 8. The regulation of SFN on oxidative damages by activation of Nrf2 in PC12 cells post METH treatment. Cells were divided into control shRNA group, control shRNA + METH group, control shRNA + METH + SFN group, Nrf2 shRNA group, Nrf2 shRNA + METH group, Nrf2 shRNA + METH + SFN group. The probe DCFH-DA (100 μmol/L) was used to detect the intracellular ROS level in different groups (A); and all samples were incubated with Griess Reagent kits to determine the intracellular production of NO (B); while the comet assay (C) and its corresponding quantitative result (D) were used to evaluate oxidative DNA damages in different cell groups post 24 h METH treatment; western blot (E) and quantitative analyses (F) were used to determine the expressions of HO-1 and GCS in different cell groups post 24 h METH treatment. Protein data values were normalized to actin level. Results were expressed as mean ± standard error of three separate experiments. Statistical significance: *P < 0.05 or **P < 0.01 compared to the control shRNA group, #P < 0.05 or ##P < 0.01 compared to the METH treated control shRNA group, $P < 0.05 or $$P < 0.05 compared to the Nrf2 shRNA group, &P < 0.05 or &&P < 0.01compared to the METH and SFN treated control shRNA group.
4. Discussion
METH is an illegal neurotoxin and it is widely used as an amphetamine-type stimulant that induces severe damages to the central nervous system, including brain damage and neurotoxcity (Shaerzadeh et al., Citation2018; Yu et al., Citation2015); however, there are few reports regarding the detailed mechanism of METH-induced neurotoxicity in the nervous system. SFN is a remarkable cytoprotective compound with a potent antioxidant function. The purpose of the current study was to investigate the essential function of SFN in regulating METH-induced neurotoxicity and its underlying molecular mechanism. Our results showed that SFN pre-treatment markedly decreased METH-induced oxidative damage, cell apoptosis and mitochondrial dysfunction via the activation of the Nrf2-mediated signaling pathway. However the neuroprotective effect of SFN was inhibited after the knockdown of Nrf2 expression post METH treatment in PC12 cells. Therefore, we concluded that SFN attenuated METH-induced neurotoxicity by alleviating oxidative damage in a Nrf2 dependent manner.
Related studies and our previously published study have demonstrated that administration of METH-induced neurotoxicity, including cell death, mitochondrial dysfunction and apoptosis both in vitro and in vivo (Borgmann & Ghorpade, Citation2018; Xiong et al., Citation2018). The loss of membrane potential loss (ΔΨm), an indicator of the mitochondrial dysfunction further induces cytochrome c release and the activation of cleaved caspase 3, which initiates mitochondria-dependent apoptosis (Zhang et al., Citation2019). Previous studies (Potula et al., Citation2010; Qiao et al., Citation2014) have shown that the disturbances in the levels of ΔΨm is observed in PC12 cells after METH exposure. Cell apoptosis was also observed in SH-SY5Y and PC12 cells post METH treatment, (Faghiri & Bazan, Citation2010; Xiong et al., Citation2018). Consistent with these findings, our results showed that METH exposure induced a significant elevation in cell apoptotic rate and in the expression of cleaved caspase 3 with a loss of ΔΨm. Nevertheless, there are currently no effective candidate agents for treating METH-induced neurotoxicity currently. Chen et al. (Citation2012) found that SFN pre-treatment significantly attenuated METH-induced acute hyperlocomotion and behavioural sensitization, indicating that SFN might be essential in treating METH-induced central nervous system abnormalities, however the underlying mechanism was not yet clear. In the present study, it was found that SFN significantly reduced cell apoptosis and the loss of ΔΨm, as well as markedly increased PC12 cell viability post METH exposure. These results indicated that SFN was important in protecting against METH-induced neuronal damage via inhibiting the mitochondrial-dependent apoptotic pathway post METH treatment in PC12 cells.
Oxidative stress is present for many neurodegenerative diseases (Bakir et al., Citation2020). The overproduction of ROS and NO beyond the antioxidant capacity of cells could cause irrevocable severe oxidative damage to the cells post METH administration (Solhi et al., Citation2014; Wells et al., Citation2016). The excessive production of ROS also induces neuronal DNA damage that eventually leads to neurotoxicity (Pamies et al., Citation2018; Vahidirad et al., Citation2018). The increased percentage of the DNA tail and γH2AX represented the hallmarks for the detection of DNA damage (Chan et al., Citation2016). The structural integrity of DNA is essential for cell survival, consequently, prompt inhibition of oxidative DNA damage could prevent neurotoxicity in neurodegenerative diseases (Wang, Gu et al., Citation2017). SFN was demonstrated to inhibit oxidative damage via suppressing ROS production in the methylmercury-induced rat cerebral cortex (Feng et al., Citation2017), and SFN could also decrease DNA damage in colon cancer cells (Okonkwo et al., Citation2018). In accordance with these results, SFN effectively prevented METH-induced oxidative damage, including ROS and NO production, as well as decreased oxidative DNA damage via inhibiting the percentage of the DNA tail and the expression of γH2AX. Hence, SFN could exert cytoprotective effects against METH-induced neurotoxicity by mitigating oxidative damage.
Accumulating studies suggests that the mechanism of METH-induced neurotoxicity is also correlated with the inhibition of the antioxidant defence system (Borgmann & Ghorpade, Citation2018; Tian et al., Citation2017; Wongprayoon & Govitrapong, Citation2016). It is generally accepted that Nrf2 is an essential redox-regulated transcription factor that binds to Kelch-like ECH associating protein 1 (Keap1) in the cytoplasm as an inactive form. Once oxidant molecules disrupt the Keap1/Nrf2 complex by releasing Nrf2 to the nucleus and binding to the antioxidant responsive element (ARE), Nrf2 can regulate the transcription of HO-1 and GCS during oxidative stress in the brain (Han et al., Citation2019; Yang et al., Citation2019), therefore, SFN is considered to exert cytoprotective effect as an activator of the Nrf2-mediated pathway (Russo et al., Citation2018). The current research showed that METH significantly reduced expressions of Nrf2, HO-1 and GCS both in PC12 cells and SD rats, while the addition of SFN markedly increased these protein expressions post METH treatment both in vitro and in vivo. Therefore, the aim is to further determine whether SFN reduced METH-induced neurotoxicity via the activation of Nrf2 expression. The results demonstrated that the protective effect of SFN on cell viability, apoptosis, mitochondrial membrane potential and oxidative damage induced by METH were significantly inhibited in Nrf2 shRNA transfected PC12 cells. Consequently, it was confirmed that SFN pre-treatment effectively decreased METH-induced neurotoxicity via inhibiting apoptosis and oxidative stress through the activation of Nrf2 expression.
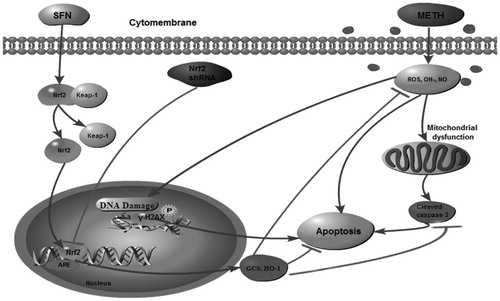
Extensive evidence demonstrates that SFN activates Nrf2-mediated pathway to regulate oxidative stress and apoptosis in neurodegenerative diseases (Gao et al., Citation2019). describes the protective effect of SFN in METH-induced oxidative damage and apoptosis by stimulating Nrf2. Firstly, METH triggered neuronal oxidative stress and blocked of Nrf2, HO-1 and GCS expressions, which might further elevate expression of γH2AX contributing to the neuronal oxidative DNA damages. The neuronal apoptosis was characterized by increased apoptotic rate and elevated expression of cleaved caspase 3. Finally, SFN pre-treatment effectively alleviate the oxidative stress and apoptosis induced by METH via stimulation of Nrf2, suggesting supplementation of SFN may be a potential treatment for METH-induced neurotoxicity.
Figure 9. Proposed molecular mechanism describing the protective effect of SFN in alleviating METH-induced neuronal oxidative damage and apoptosis via Nrf2/HO-1/GCS pathway. In brief, METH-induced neuronal oxidative damage via down-regulation of Nrf2/HO-1/GCS signaling pathway and caused cell apoptosis. However, SFN pre-treatment significantly alleviated METH-induced oxidative damage, as well as decreased mitochondrial dysfunction and cell apoptosis in PC12 cells by activation of Nrf2 expression. In contrast, knock-down of Nrf2 expression further aggravated neuronal damages induced by METH in PC12 cells.
5. Conclusions
METH is a psychostimulant drug that causes a significant public health concern with neurotoxic effects to the users. The present study indicated that SFN exerted neuroprotective effect by alleviating METH-induced oxidative damage and apoptosis in neuronal cells. The potential mechanism involves the activation of the Nrf2-mediated pathway. Consequently, this study has demonstrated the promising application of SFN as an essential and functional supplement to ameliorate neuronal oxidative damage in future METH abuse treatment.
Acknowledgements
The authors gratefully acknowledge the financial support by the China Scholarship Council (No.201908420112) and Hubei Province Department of Education (China) guidance project (B2017273). We also thank Professor Binlian Sun for critical reviews in this manuscript editing.
Disclosure statement
No potential conflict of interest was reported by the author(s).
Additional information
Funding
References
- Ares, A. M., Valverde, S., Bernal, J. L., Nozal, M. J., & Bernal, J. (2015). Development and validation of a LC-MS/MS method to determine sulforaphane in honey. Food Chemistry, 181, 263–269. https://doi.org/10.1016/j.foodchem.2015.02.085
- Bakir, S., Catalkaya, G. F., Ceylan, D., Khan, H., Guldiken, B., Capanoglu, E., & Kamal, M. A. (2020). Role of dietary antioxidants in neurodegenerative diseases: Where are we standing? Current Pharmaceutical Design, 26(7), 714–729. https://doi.org/10.2174/1381612826666200107143619
- Banerjee, S., Aykin-Burns, N., Krager, K. J., Shah, S. K., Melnyk, S. B., Hauer-Jensen, M., & Pawar, S. A. (2016). Loss of C/EBPdelta enhances IR-induced cell death by promoting oxidative stress and mitochondrial dysfunction. Free Radical Biology & Medicine, 99, 296–307. https://doi.org/10.1016/j.freeradbiomed.2016.08.022
- Borgmann, K., & Ghorpade, A. (2018). Methamphetamine augments concurrent astrocyte mitochondrial stress, oxidative burden, and antioxidant capacity: Tipping the balance in HIV-associated neurodegeneration. Neurotoxicity Research, 33(2), 433–447. https://doi.org/10.1007/s12640-017-9812-z
- Brant, L. Y. D., Desta, H., Khoo, T. C., Sharikova, A. V., Mahajan, S. D., & Khmaladze, A. (2019). Methamphetamine-induced apoptosis in glial cells examined under marker-free imaging modalities. Journal of Biomedical Optics, 24, 1–10. https://doi.org/10.1117/1.JBO.24.4.046503
- Chan, T. K., Loh, X. Y., Peh, H. Y., Tan, W. N. F., Tan, W. S. D., Li, N., Tay, I. J. J., Wong, W. S. F., & Engelward, B. P. (2016). House dust mite-induced asthma causes oxidative damage and DNA double-strand breaks in the lungs. The Journal of Allergy and Clinical Immunology, 138(1), 84–96.e1. https://doi.org/10.1016/j.jaci.2016.02.017
- Chen, H., Wu, J., Zhang, J., Fujita, Y., Ishima, T., Iyo, M., & Hashimoto, K. (2012). Protective effects of the antioxidant sulforaphane on behavioral changes and neurotoxicity in mice after the administration of methamphetamine. Psychopharmacology, 222(1), 37–45. https://doi.org/10.1007/s00213-011-2619-3
- Choi, S. J., & Kim, H. S. (2018). Deregulation of Nrf2/ARE signaling pathway causes susceptibility of dystrophin-deficient myotubes to menadione-induced oxidative stress. Experimental Cell Research, 364(2), 224–233. https://doi.org/10.1016/j.yexcr.2018.02.013
- Faghiri, Z., & Bazan, N. G. (2010). PI3K/Akt and mTOR/p70S6K pathways mediate neuroprotectin D1-induced retinal pigment epithelial cell survival during oxidative stress-induced apoptosis. Experimental Eye Research, 90(6), 718–725. https://doi.org/10.1016/j.exer.2010.03.002
- Feng, S., Xu, Z. F., Wang, F., Yang, T., Liu, W., Deng, Y., & Xu, B.(2017). Sulforaphane prevents methylmercury-induced oxidative damage and excitotoxicity through activation of the Nrf2-ARE pathway. Molecular Neurobiology, 54(1), 375–391. https://doi.org/10.1007/s12035-015-9643-y
- Gao, Y., Chu, S. F., Zhang, Z., Ai, Q. D., Xia, C. Y., Huang, H. Y., & Chen, N. H. (2019). Ginsenoside Rg1 prevents Acetaminophen-induced oxidative stress and apoptosis via Nrf2/ARE signaling pathway. Journal of Asian Natural Products Research, 21(8), 782–797. https://doi.org/10.1080/10286020.2018.1504024
- Gu, Y. H., Wang, Y., Bai, Y., Liu, M., & Wang, H. L. (2017). Endoplasmic reticulum stress and apoptosis via PERK-eIF2alpha-CHOP signaling in the methamphetamine-induced chronic pulmonary injury. Environmental Toxicology and Pharmacology, 49, 194–201. https://doi.org/10.1016/j.etap.2017.01.003
- Han, C., Wei, Y. Y., Wang, X., Cui, Y. Q., Bao, Y. Z., & Shi, W. Y. (2019). Salvia miltiorrhiza polysaccharides protect against lipopolysaccharide-induced liver injury by regulating NF-κb and Nrf2 pathway in mice. Food and Agricultural Immunology, 30(1), 979–994. https://doi.org/10.1080/09540105.2019.1652250
- Jang, J., & Cho, I. H. (2016). Sulforaphane ameliorates 3-nitropropionic acid-induced striatal toxicity by activating the Keap1-Nrf2-ARE pathway and inhibiting the MAPKs and NF-κB pathway. Molecular Neurobiology, 53(4), 2619–2635. https://doi.org/10.1007/s12035-015-9230-2
- Jeong, J. Y., Cha, H. J., Choi, E. O., Kim, C. H., Kim, G. Y., Yoo, Y. H., Hwang, H. J., Park, H. T., Yoon, H. M., & Choi, Y. H. (2019). Activation of the Nrf2/HO-1 signaling pathway contributes to the protective effects of baicalein against oxidative stress-induced DNA damage and apoptosis in HEI193 Schwann cells. International Journal of Medical Sciences, 16(1), 145–155. https://doi.org/10.7150/ijms.27005
- Jiao, Z., Chang, J., Li, J., Nie, D., Cui, H., & Guo, D. (2017). Sulforaphane increases Nrf2 expression and protects alveolar epithelial cells against injury caused by cigarette smoke extract. Molecular Medicine Reports, 16(2), 1241–1247. https://doi.org/10.3892/mmr.2017.6700
- Johnson, Z., Venters, J., Guarraci, F. A., & Zewail-Foote, M. (2015). Methamphetamine induces DNA damage in specific regions of the female rat brain. Clinical and Experimental Pharmacology & Physiology, 42(6), 570–575. https://doi.org/10.1111/1440-1681.12404
- Jumnongprakhon, P., Govitrapong, P., Tocharus, C., Pinkaew, D., & Tocharus, J. (2015). Melatonin protects methamphetamine-induced neuroinflammation through NF-κB and Nrf2 pathways in glioma cell line. Neurochemical Research, 40(7), 1448–1456. https://doi.org/10.1007/s11064-015-1613-2
- Kang, Y., Lee, J. H., Seo, Y. H., Jang, J. H., Jeong, C. H., Lee, S. Y., Jeong, G. S., & Park, B. (2019). Epicatechin prevents methamphetamine-induced neuronal cell death via inhibition of ER stress. Biomolecules & Therapeutics, 27(2), 145–151. https://doi.org/10.4062/biomolther.2018.092
- Kim, N. Y., Ahn, S. G., & Kin, S. A. (2017). Cinnamaldehyde protects human dental pulp cells against oxidative stress through the Nrf2/HO-1-dependent antioxidant response. European Journal of Pharmacology, 815, 73–79. https://doi.org/10.1016/j.ejphar.2017.09.004
- Kim, J., & Keum, Y. S. (2016). NRF2, a key regulator of antioxidants with two faces towards cancer. Oxidative Medicine and Cellular Longevity, 2746457. https://doi.org/10.1155/2016/2746457
- Li, B., Chen, R., Chen, L., Qiu, P. M., Ai, X. Y., Huang, E. P., Huang, W. Y., Chen, C. X., Liu, C., Lin, Z. M., Xie, W. B., & Wang, H. J. (2017). Effects of DDIT4 in methamphetamine-induced autophagy and apoptosis in dopaminergic neurons. Molecular Neurobiology, 54(3), 1642–1660. https://doi.org/10.1007/s12035-015-9637-9
- Lord, K. C., Shenouda, S. K., McIlwain, E., Charalampidis, D. P., Lucchesi, A., & Varner, K. J. (2010). Oxidative stress contributes to methamphetamine-induced left ventricular dysfunction. Cardiovascular Research, 87(1), 111–118. https://doi.org/10.1093/cvr/cvq043
- Menegon, S., Columbano, A., & Giordano, S. (2016). The dual roles of NRF2 in cancer. Trends in Molecular Medicine, 22(7), 578–593. https://doi.org/10.1016/j.molmed.2016.05.002
- Meo, S. D., Reed, T. T., Venditti, P., & Victor, V. M. (2016). Role of ROS and RNS sources in physiological and pathological conditions. Oxidative Medicine and Cellular Longevity, 2016, 1245049. https://doi.org/10.1155/2016/1245049
- Murray, J., Barbara, J. A., Dunkley, S. A., Lopez, A. F., Van Ostade, X., Condliffe, A. M., Dransfield, I., Haslett, C., & Chilvers, E. R. (1997). Regulation of neutrophil apoptosis by tumor necrosis factor-alpha: Requirement for TNFR55 and TNFR75 for induction of apoptosis in vitro. Blood, 90(7), 2772–2783. https://doi.org/10.1182/blood.V90.7.2772
- Noh, J. R., Kim, Y. H., Huwang, J. H., Choi, D. H., Kim, K. S., Oh, W. K., & Lee, C. H. (2015). Sulforaphane protects against Acetaminophen-induced hepatotoxicity. Food and Chemical Toxicology, 80, 193–200. https://doi.org/10.1016/j.fct.2015.03.020
- Nordahl, T. E., Salo, R., & Leamon, M. (2003). Neuropsychological effects of chronicmethamphetamine use on neurotransmitters and cognition: A review. The Journal of Neuropsychiatry and Clinical Neurosciences, 15(3), 317–325. https://doi.org/10.1176/jnp.15.3.317
- Okonkwo, A., Mitra, J., Johnson, G. S., Li, L., Dashwood, W. M., Hegde, M. L., Yue, C., Dashwood, R. H., & Rajendran, P. (2018). Heterocyclic analogs of sulforaphane trigger DNA damage and impede DNA repair in colon cancer cells: Interplay of HATs and HDACs. Molecular Nutrition & Food Research, 62(18), e1800228. https://doi.org/10.1002/mnfr.201800228
- Pamies, D., Block, K., Lau, P., Gribaldo, L., Pardo, C. A., Barreras, P., Smirnova, L., Wiersma, D., Zhao, L., Harris, G., Hartung, T., & Hogberg, H. T. (2018). Rotenone exerts developmental neurotoxicity in a human brain spheroid model. Toxicology and Applied Pharmacology, 354, 101–114. https://doi.org/10.1016/j.taap.2018.02.003
- Potula, R., Hawkins, B. J., Cenna, J. M., Fan, S., Dykstra, H. S., Ramirez, H. B., Morsey, B., Brodie, M. R., & Persidsky, Y. (2010). Methamphetamine causes mitrochondrial oxidative damage in human T lymphocytes leading to functional impairment. Journal of Immunology, 185(5), 2867–2876. https://doi.org/10.4049/jimmunol.0903691
- Poulose, S. M., Miller, M. G., Scott, T., & Shukitt-Hale, B. (2017). Nutritional factors affecting adult neurogenesis and cognitive function. Advances in Nutrition: An International Review Journal, 8(6), 804–811. https://doi.org/10.3945/an.117.016261
- Prakash, M. D., Tangalakis, K., Antonipillai, J., Stojanovska, L., Nurgali, K., & Apostolopoulos, V. (2017). Methamphetamine: Effects on the brain, gut and immune system. Pharmacological Research, 120, 60–67. https://doi.org/10.1016/j.phrs.2017.03.009
- Qiao, D., Xu, J., Le, C., Huang, E., Liu, C., Qiu, P., Lin, Z., Xie, W. B., & Wang, H. (2014). Insulin-like growth factor binding protein 5 (IGFBP5) mediates methamphetamine-induced dopaminergic neuron apoptosis. Toxicology Letters, 230(3), 444–453. https://doi.org/10.1016/j.toxlet.2014.08.010
- Qiao, H. H., Zhu, L. N., Wang, Y., Hui, J. L., Xie, W. B., Liu, C., Chen, L., & Qiu, P. M. (2019). Implications of alpha-synuclein nitration at tyrosine 39 in methamphetamine-induced neurotoxicity in vitro and in vivo. Neural Regeneration Research, 14(2), 319–327. https://doi.org/10.4103/1673-5374.244795
- Ramirez, R. L., Perez 3rd., V. J., & Zamanian, R. T. (2018). Methamphetamine and the risk of pulmonary arterial hypertension. Current Opinion in Pulmonary Medicine, 24(5), 416–424. https://doi.org/10.1097/MCP.0000000000000513
- Ramirez, S. H., Potula, R., Fan, S., Eidem, T., Papugani, A., Reichenbach, N., Dykstra, H., Weksler, B. B., Romero, I. A., Couraud, P. O., & Persidsky, Y. (2009). Methamphetamine disrupts blood-brain barrier function by induction of oxidative stress in brain endothelial cells. Journal Of Cerebral Blood Flow and Metabolism: Official Journal of the International Society of Cerebral Blood Flow and Metabolism, 29(12), 1933–1945. https://doi.org/10.1038/jcbfm.2009.112
- Russo, M., Spagnuolo, C., Russo, G. L., Wozniak, K. S., Daglia, M., Sobarzo-Sanchez, E., Nabavi, S. F., & Nabavi, S. M. (2018). Nrf2 targeting by sulforaphane: A potential therapy for cancer treatment. Critical Reviews in Food Science and Nutrition, 58(8), 1391–1405. https://doi.org/10.1080/10408398.2016.1259983
- Sajja, R. K., Prasad, S., Tang, S., Kaisar, M. A., & Cucullo, L. (2017). Blood-brain barrier disruption in diabetic mice is linked to Nrf2 signaling deficits: Role of ABCB10? Neuroscience Letter, 653, 152–158. https://doi.org/10.1016/j.neulet.2017.05.059
- Shaerzadeh, F., Streit, W. J., Heysieattalab, S., & Khoshbouei, H. (2018). Methamphetamine neurotoxicity, microglia, and neuroinflammation. Journal of Neuroinflammation, 15(1), 341. https://doi.org/10.1186/s12974-018-1385-0
- Shah, A., Kumar, S., Simon, S. D., Singh, D. P., & Kumar, A. (2013). HIV gp120- and methamphetamine-mediated oxidative stress induces astrocyte apoptosis via cytochrome P450 2E1. Cell Death & Disease, 4(10), e850. https://doi.org/10.1038/cddis.2013.374
- Solhi, H., Malekirad, A., Kazemifar, A. M., & Sharifi, F. (2014). Oxidative stress and lipid peroxidation in prolonged users of methamphetamine. Drug Metabolism Letters, 7(2), 79–82. https://doi.org/10.2174/187231280702140520191324
- Szeto, Y. T., Tse, R. S. C., Benzie, I. F. F., Kalle, W., & Pak, S. C. (2014). An in vitro study of Sanchi (Panax pseudoginseng) for its DNA protective effect. Food and Agricultural Immunology, 25(3), 332–340. https://doi.org/10.1080/09540105.2013.794202
- Tarozzi, A., Angeloni, C., Malaguti, M., Morroni, F., Hrelia, S., & Hrelia, P. (2013). Sulforaphane as a potential protective phytochemical against neurodegenerative diseases. Oxidative Medicine and Cellular Longevity, 2013. Article id 415078. https://doi.org/10.1155/2013/415078
- Thrash-Williams, B., Ahuja, M., Karuppagounder, S. S., Uthayathas, S., Suppiramaniam, V., & Dhanasekaran, M. (2013). Assessment of therapeutic potential of amantadine in methamphetamine induced neurotoxicity. Neurochemical Research, 38(10), 2084–2094. https://doi.org/10.1007/s11064-013-1117-x
- Tian, X., Ru, Q., Xiong, Q., Yue, K., Chen, L., Ma, B., Gan, W., Si, Y., Xiao, H., & Li, C. (2017). Neurotoxicity induced by methamphetamine-heroin combination in PC12 cells. Neuroscience Letters, 647, 1–7. https://doi.org/10.1016/j.neulet.2017.03.005
- Vahidirad, M., Arab-Nozari, M., Mohammadi, H., Zamani, E., & Shaki, F. (2018). Protective effect of captopril against diazinon induced nephrotoxicity and neurotoxicity via inhibition of ROS-NO pathway. Drug and Chemical Toxicology, 41(3), 287–293. https://doi.org/10.1080/01480545.2017.1391830
- Wang, Y., Gu, Y. H., Liu, M., Bai, Y., Liang, L. Y., & Wang, H. L. (2017). TBHQ alleviated endoplasmic reticulum stress-apoptosis and oxidative stress by PERK-Nrf2 crosstalk in methamphetamine-induced chronic pulmonary toxicity. Oxidative Medicine and Cellular Longevity, 2017, 4310475. https://doi.org/10.1155/2017/4310475
- Wang, L., Howell, M. E. A., Wallace, A. S., Hawkins, C., Nickic, C. A., Kohne, C., Hall, K. H., Moorman, J. P., Yao, Z. Q., Ning, S. B., & Lieberman, P. M. (2019). P62-mediated selective autophage endows virus-transformed cells with insusceptibility to DNA damage under oxidative stress. PloS Pathogens, 15(4), e1007541. https://doi.org/10.1371/journal.ppat.1007541
- Wang, A. S., Xu, Y., Zhang, Z. W., Lu, B. B., Yin, X. A., Yao, J., Han, L. Y. Z., Zou, Q., Li, Z., & Zhang, X. H. (2017). Sulforaphane protects MLE-12 lung epithelial cells against oxidative damage caused by ambient air particulate matter. Food & Function, 8(12), 4555–4562. https://doi.org/10.1039/C7FO00969K
- Wells, P. G., Bhatia, S., Drake, D. M., & Miller-Pinsler, L. (2016). Fetal oxidative stress mechanisms of neurodevelopmental deficits and exacerbation by ethanol and methamphetamine. Birth Defects Research, Part C, Embryo Today: Reviews, 108(2), 108–130. https://doi.org/10.1002/bdrc.21134
- Wongprayoon, P., & Govitrapong, P. (2016). Melatonin attenuates methamphetamine-induced neurotoxicity. Current Pharmceutical Design, 22(8), 1022–1032. https://doi.org/10.2174/1381612822666151214125657
- Wongprayoon, P., & Govitrapong, P. (2017). Melatonin protects SH-SY5Y neuronal cells against methamphetamine-induced endoplasmic reticulum stress and apoptotic cell death. Neurotoxic Research, 31(1), 1–10. https://doi.org/10.1007/s12640-016-9647-z
- Xiong, Q., Ru, Q., Tian, X., Zhou, M., Chen, L., Li, Y., & Li, C. (2018). Krill oil protects PC12 cells against methamphetamine-induced neurotoxicity by inhibiting apoptotic response and oxidative stress. Nutrition Research, 58, 84–94. https://doi.org/10.1016/j.nutres.2018.07.006
- Xu, W. P., Yang, M. J., Gao, J. F., Zhang, Y., & Tao, L. M. (2018). Oxidative stress and DNA damage induced by spinosad exposure in Spodotera frugiperda Sf9 cells. Food and Agricultural Immunology, 29(1), 171–181. https://doi.org/10.1080/09540105.2017.1364708
- Yang, S. H., He, J. B., Yu, L. H., Li, L., Long, M., Liu, M. D., & Li, P. (2019). Protective role of curcumin in cadmium-induced testicular injury in mice by attenuating oxidative stress via Nrf2/ARE pathway. Environmental Science and Pollution Research, 26(33), 34575–34583. https://doi.org/10.1007/s11356-019-06587-9
- Yang, S. H., Yu, L. H., Li, L., Guo, Y., Zhang, Y., Long, M., Li, P., & He, J. B. (2018). Protective mechanism of sulforaphane on cadmium-induced sertoli cell injury in mice testis via Nrf2/ARE signaling pathway. Molecules, 23(7), 1774. https://doi.org/10.3390/molecules23071774
- Yu, S., Zhu, L., Shen, Q., Bai, X., & Di, X. (2015). Recent advances in methamphetamine neurotoxicity mechanisms and its molecular pathophysiology. Behavioural Neurology, 2015, 103969. https://doi.org/10.1155/2015/103969
- Zhang, Y., Guo, W., Chen, H., Gao, J. F., Tao, L. M., Li, Z., & Xu, W. P. (2019). The cytotoxic effects of spinetoram on human HepG2 cells by inducing DNA damage and mitochondria-associated apoptosis. Food and Agricultural Immunology, 30(1), 1020–1032. https://doi.org/10.1080/09540105.2019.1650900