
ABSTRACT
Citreoviridin (CTV) is a toxic secondary metabolite that can be found in mouldy cereals. In this study, a sensitive and ethanol-tolerant anti-CTV monoclonal antibody (6B2) was produced with a 50% inhibition concentration of 4.1 ng/mL and then labelled using gold nanoparticle (GNP). Based on competitive inhibition of the binding of CTV-COOH-BSA conjugate sprayed onto a membrane to limited GNP-labelled antibody by free CTV in the samples, an easy-to-operate immunochromatographic strip (ICS) was developed for the fast screening of CTV in rice. The results are seen as a colour change within 5-10 min. We used relatively safe ethanol instead of highly toxic methanol or chloroform as the extraction solution and found a visible detection limit of 100 μg/kg and cut-off value of 1000 μg/kg. The developed ICS assay worked well and represented a reliable, safe, fast and a highthroughput method for the detection of CTV residues in rice samples.
Introduction
Citreoviridin (CTV) is a toxic secondary metabolite mainly produced by Penicillium citreonigrum, but also found in Aspergillus terreus and Eupenicillium ochrosalmoneum (Sakabe et al., Citation1964). CTV is found widely in mouldy cereals, such as rice and corn, and shows cardiovascular toxicity, neurotoxicity and genotoxicity (Kota et al., Citation2018; Nishie et al., Citation1988). The consumption of CTV contaminated rice was responsible for acute cardiac beriberi (causing neurological symptoms and heart failure) outbreak in Japan (Sakabe et al., Citation1964) and Brazil (Rosa et al., Citation2010). This is mainly because CTV competes with nerve and muscle tissue for thiamin (vitamin B1), resulting in vitamin B1 deficiency (Almeida et al., Citation2012; da Rocha et al., Citation2015). Chronic exposure to CTV has been reported to be a possible factor initiating Keshan disease, an endemic cardiomyopathy affecting mainly children and young women in China, through oxidative stress mechanisms (Sun, Citation2010). In addition, CTV is considered to be associated with the development of atherosclerosis in some areas of China (Feng et al., Citation2017; Hou et al., Citation2015), because it induces triglyceride accumulation (Feng et al., Citation2017), increases the total serum cholesterol/high-density lipoprotein cholesterol ratio (Feng et al., Citation2017), reduces serum levels of nitric oxide (Hou et al., Citation2015) and accelerates the expression of endothelin-1 in the aorta (Hou et al., Citation2015).
Studies exploring the kinetics of CTV have been performed in vivo in swine and in vitro experiments using hepatic S9 fractions from swine and humans. Results have shown that CTV is easily absorbed in both humans and swine, but its elimination is faster in humans (Uchiyama et al., Citation2019). Toxicity studies of CTV have shown that the 50% lethal dose (LD50) in mice was 7.5 mg/kg when delivered intraperitoneally and 3.6–11.8 mg/kg when added subcutaneously (Nishie et al., Citation1988). Despite the serious hazard CTV poses to humans and animals, there is currently no safe maximum residue limit. Given the harmful effects of CTV therefore, development of a sensitive, reliable, rapid and high-throughput analytical method for monitoring CTV levels is important to protect consumers and reduce economic losses.
Many analytical methods have been developed for CTV detection; thin layer chromatography was the mainstream method used before 1988 (Lai et al., Citation1990). However, soon afterwards, normal-phase liquid chromatography methods with fluorescence detection (LC-FLD) were developed to detect CTV in corn and rice (Nishie et al., Citation1988). Since then, several methods have been used including normal-phase LC-FLD (Rosa et al., Citation2010), reverse-phase LC with photodiode array detection (LC-PDA) (da Rocha et al., Citation2015), high-performance liquid chromatography (HPLC) (Almeida et al., Citation2012; DeAn et al., Citation2004), LC-PDA-mass spectrometry (LC-PDA-MS) (Maragos et al., Citation2019) and reverse-phase LC-MS/MS (da Rocha et al., Citation2015). These methods have high sensitivity and specificity, but require extensive sample processing, highly skilled personnel, and expensive equipment, and are therefore not suitable for large-scale detection and fail to achieve real-time results. In addition to instrument methods, biological methods () have also been reported for CTV detection. Wu et al. (Citation2018) reported a luminescent bacterial assay for the rapid detection of CTV in drinking water, with a linear range of 0.5–10 mg/L (Wu et al., Citation2018). This assay was based on the relative luminescence intensity of Vibrio qinghaiensis sp.-Q67 and the signal decreased linearly with an increase in CTV concentration.
Table 1. Conclusion of previously reported biological methods for detection of CTV.
Efforts have been made to produce antibodies against CTV for rapid use in immunoassays. Polyclonal antibody with a 50% inhibition concentration (IC50) of 560 ng/mL (Zhuang et al., Citation2013), monoclonal antibodies (mAbs) with IC50s of 161.66 (Jin et al., Citation2014) and 11 ng/mL (Maragos et al., Citation2019), and single chain variable fragment antibody with an IC50 of 120 ng/mL (Wang et al., Citation2016) have all been reported and applied to develop indirect competitive enzyme-linked immunosorbent assays (ic-ELISA) for the detection of CTV. However, ic-ELISA involves multi-step incubation and washing processes and take about 2 h to complete. Immunochromatographic strip (ICS) represents a paper-based immunosensor, allowing for the sensitive, rapid and high-throughput colorimetric on-site screening for analytes within 5–10 min (Jiang et al., Citation2017; Li et al., Citation2019; Peng et al., Citation2017). To our knowledge, no antibody-based ICS assay has been reported for the determination of CTV. Therefore, in this study, we focused on the preparation of a safe, reliable, fast and portable ICS method for the determination of CTV residues in rice samples.
Materials and methods
Chemicals and instruments
Chemicals (purity ≥98%): CTV, aflatoxin B1 (AFB1), aflatoxin B2 (AFB2), aflatoxin G1 (AFG1), aflatoxin G2 (AFG2), zearalenone (ZEN) and deoxynivalenol (DON) were purchased from J&K Scientific Ltd. (Beijing, China). Succinic anhydride, 4-dimethylamiopyridine (DMAP), 1-ethyl-carbodiimide hydrochloride (EDC·HCl), N-hydroxysuccinimide (NHS), keyhole limpet hemocyanin (KLH) and bovine serum albumin (BSA) were obtained from Sigma-Aldrich (St. Louis, MO, USA). Goat anti-mouse immunoglobulin (IgG) and horseradish peroxidase (HRP)-labelled goat anti-mouse IgG were acquired from Jackson ImmunoResearch Laboratories, Inc. (Pennsylvania, USA). All other reagents used were analytical grade from the National Pharmaceutical Group Chemical Reagent Co., Ltd. (Shanghai, China).
UV–visible spectrophotometer was purchased from Bokin Instruments Co., Ltd. (Tsushima, Japan). Polyvinyl chloride (PVC) backing card, sample pad (glass-fibre membrane, CB-SB08), absorbent pad (SX18) and nitrocellulose high-flow plus membrane (NC membrane) were supplied by Goldbio Tech Co., Ltd. (Shanghai, China). A Biojet Quanti 3000TM dispenser was purchased from XinqidianGene Technology Co., Ltd. (Beijing, China). CM 4000 guillotine cutting module was obtained from Kinbio Tech Co., Ltd. (Shanghai, China).
Preparation of complete antigens
Previous attempts were performed to produce a CTV complete antigen using the N, N-carbonyldiimidazole method, or sodium periodate method, or succinic anhydride and carbodiimide method (Jin et al., Citation2014 Maragos et al., Citation2019;; Zhuang et al., Citation2013). In this study, the succinic anhydride and carbodiimide method was used to introduce a four-carbon linker with a carboxyl group and then link this to proteins. CTV was firstly derived to CTV-COOH using the succinic anhydride method as follows: 1 mg of CTV (2.48 μmol), 3.3 mg DMAP (27 μmol) and 7.4 mg succinic anhydride (74 μmol) were dissolved in 300 μL of anhydrous pyridine. After incubation for 6–8 h at 65°C in the dark, the reactants were dried under nitrogen and extracted with trichloromethane/water. The trichloromethane phase was combined and then concentrated under nitrogen. The derivative CTV-COOH was produced and was then dissolved in methanol and its composition was confirmed using LC-TOF-MS.
After this, the immunogen CTV-COOH-KLH and coating antigen CTV-COOH-BSA were prepared using the carbodiimide method (Hao et al., Citation2017). CTV-COOH solution (1 mg in 300 μL N,N-dimethylformamide) was supplemented with EDC (1.5 mg, 7.85 μmol) and NHS (0.9 mg, 7.82 μmol) followed by activation for 8 h at room temperature in the dark. Next, KLH (6.6 mg) or BSA (1.85 mg) was added dropwise into the activated solution to couple overnight at room temperature, again in the dark. The resultant conjugated product was dialysed against six changes of 0.01 M PBS (pH 7.4) for 3 days at 4°C. After determination of the concentration, the complete antigen was aliquoted and stored at −20°C until use.
Generation of mAb
Animal studies were conducted according to institutional ethical guidelines and approved by the Committee on Animal Welfare of Jiangnan University. Twenty female BALB/C mice were immunized by injecting with CTV-COOH-KLH using the same procedure as described previously (Cao et al., Citation2019). Antisera was screened using an ic-ELISA with CTV-COOH-BSA immobilizing on plates. The mouse that produced antisera exhibiting the highest titre and highest sensitivity against CTV was sacrificed and spleen cells were harvested. The splenocyte fusion and hybridoma screening was performed as previously described (Chen et al., Citation2016; Guo et al., Citation2019). The monoclonal cell line secreting antibody with highest titre and highest sensitivity was expanded and cultured in the abdominal cavity of mice to prepare ascites. The ascites was purified using the caprylic acid-ammonium sulphate method to obtain mAb which was dialysed against 0.01 M PBS and then stored at −20°C.
Characterization of the mAb
Sensitivity evaluation: CTV standard dilutions with concentrations ranging from 0 to 200 ng/mL were prepared in 0.01 M PBS and measured using ic-ELISA. A calibration curve was obtained by plotting log CTV concentration as the abscissa and its corresponding absorbance as the ordinate. Curve fitting was used to calculate the IC50 and IC20 values which represented the sensitivity of the mAb.
Specificity assessment: Six compounds naturally occurring alongside CTV in grain were examined for cross reactivity (CR), including AFB1, AFB2, AFG1, AFG2, ZEN and DON. The CR was calculated as follows: CR% = (IC50 of CTV)/(IC50 of a different toxin) × 100.
Tolerance to ethanol: The tolerance of the mAb to ethanol was determined by incorporating 0%–40% (v/v) ethanol in the PBS used to produce the standards. Standard solutions with concentrations ranging from 0 to 200 ng/mL were tested using an ic-ELISA. Each CTV concentration was tested using three to six replicates. The absorbance value of the negative solution representing the antibody titre (ODmax) and IC50 were used as indicators of ethanol tolerance in the assay.
Synthesis of GNP-labelled mAb
GNPs possesses useful optical properties and can serve as a visible detection probes (Lin et al., Citation2019). GNPs with a diameter of about 15 nm appear red wine in colour and were supplied by our laboratory. Synthesis of the GNP-labelled mAb was carried out using electrostatic and hydrophobic interactions (Wang et al., Citation2018). In brief, a GNP solution (1 mL) was adjusted to pH 8.0 by addition of 4 µL 0.1 M K2CO3 followed by slow addition of the anti-CTV mAb (10 μg) and then left for 45 min at room temperature. To block the unoccupied sites on the GNPs and avoid non-specific adsorption, 10% (v/v) BSA in ultrapure water was added at a final concentration of 1% as blocker, for 2 h at room temperature. After the blocking step, the conjugated solution was centrifuged at 8000 × g for 45 min at 4°C. The pallet consisting of GNP-labelled mAb was then resuspended in 0.1 mL of 0.02 M Tris–HCl (pH 8.2) containing 0.1% Tween, 0.1% PEG, 5% trehalose, 5% sucrose, 5% Brij and 0.2% BSA and stored at 4°C.
Construction of the ICS
The ICS was assembled as shown in (A). The NC membrane, sample pad and absorbent pad were pasted onto a PVC backing card in layers (Meng et al., Citation2019). The NC membrane acted as the reaction area for the antigen–antibody and where the detection reagent (CTV-COOH-BSA) and control reagent (goat anti-mouse IgG) were applied by spraying 0.9 μL/cm, using a dispenser to form a test line (T line) and control line (T line), respectively. The treated NC membrane was immediately dried at 37°C for 2 h. The sample and absorbent pads were used without treatment. The completed plate was cut into 2.9 mm-wide strips using guillotine cutting module and stored in a dryer.
Figure 1. Assemblage (A) and principle (B) of the immunochromatographic strip assay.
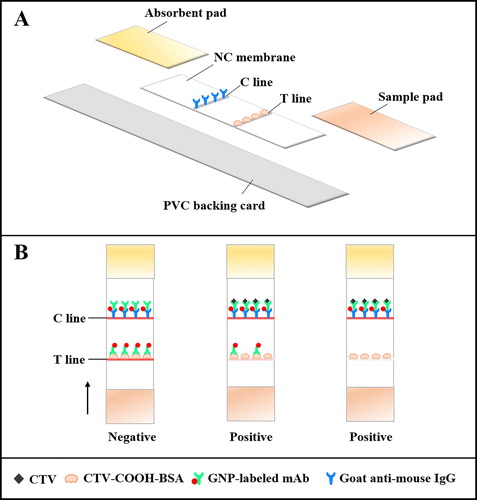
Principle of the ICS
The sample was analysed using the ICS as follows: sample solution (150 μL), GNP-labelled mAb (43 μL) and suspension buffer (0.02 M Tris–HCl containing 5% sucrose, 0.1% PEG, 0.1% Tween-20, 5% trehalose, 0.2% BSA and surfactant, 7 μL) were mixed in a micro-well. After incubation for 5 min at room temperature, the strip was inserted and due to capillary action, the mixture moved to the absorbent pad within 5 min. During this time, the T and C lines became differentially coloured to indicate a negative or positive sample (B). If the sample was CTV-negative, there were two red line present, because the GNP-labelled mAb was captured by CTV-COOH-BSA (T line) and goat-anti mouse IgG (C line). If the sample was CTV-positive, there was a weak or colourless T line and a red C line, because the limited amount of GNP-labelled mAb would first bind to the free CTV in the sample, resulting in low or no binding of the GNP-labelled mAb captured by the CTV-COOH-BSA. However, the GNP-labelled mAb-CTV would still be captured by the goat-anti mouse IgG. For construction of the standard curve, the color intensity of the T line was measured with a hand-held strip scan reader.
Sample analysis
CTV-negative rice samples purchased from local markets were ground into powder and sieved through a 40-mesh screen. Then CTV-fortified rice samples were prepared and extracted as follows: 5 g of sample was collected from five different points. After mixing uniformly, the sample was spiked with CTV at concentrations ranging from 0 to 2500 μg/kg. The volume of the spiked solution was kept below 200 µL and each concentration was prepared six times. The spiked samples were shaken for 2 h at room temperature to ensure adequate mixing of the CTV and sample matrices. Then the samples were extracted with 20 mL of ethanol/water (4/6 v/v) by shaking for 20 min. After centrifugation at 5000 × g for 15 min, the supernatant was diluted 1 + 3 (v/v) with 0.01 M PBS (pH 7.4) and then added to the ICS strips.
Results and discussion
Verification of the antigens
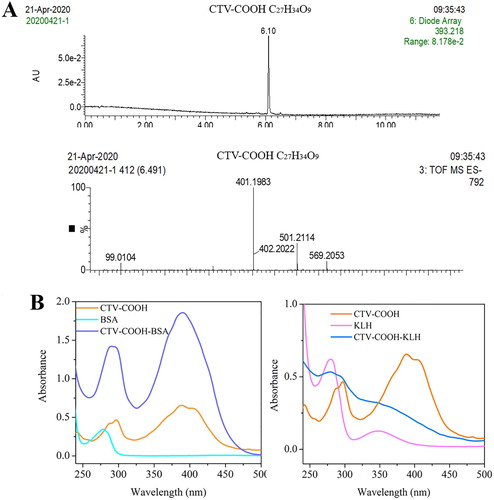
CTV-COOH (C27H34O9) has a molecular weight of 502.2 g/mol. In the negative ion mode [M–H]−, an m/z of 501.2 was observed (A), suggesting success in preparing the CTV-COOH. Additionally, an m/z of 401.2 was also found (A), demonstrating that there were some substrate (CTV, 402.1 g/mol) that did not react with succinic anhydride. Because the original substrate (CTV) has no carboxyl or amino groups and therefore does not affect the activation of the carboxyl group on CTV-COOH or the coupling of CTV-COOH and the protein, no further purification was carried out. Moreover, the CTV and CTV-COOH that did not participate in the reaction would be removed during dialysis. After conjugation with the carrier proteins, the completed antigens were characterized using UV/Vis spectral analysis (B). The derivative CTV-COOH showed two broad characteristic peaks in the range of 285–300 nm and 385–410 nm, respectively. Whereas BSA had a characteristic peak at 280 nm and KLH separately had characteristic peaks at 280 and 340 nm. After conjugation, the antigens showed both CTV peaks and protein peaks, indicating the success of coupling.
Figure 2. Verification of CTV-COOH derivative by LC-TOF-MS (A) and complete antigens by UV/Vis spectra (B).
Characterization of anti-CTV mAb
Sensitivity evaluation
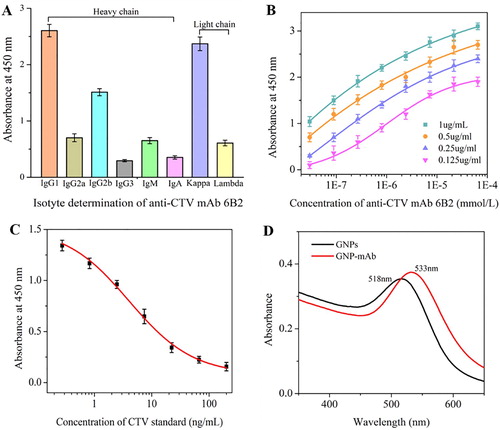
Through mice immunity and cell fusion, anti-CTV mAb 6B2 was generated. Its heavy chain belonged to IgG1 subclass and light chain was designed Kappa (A). Affinity determination results in (B) showed that 6B2 exhibited a high affinity to CTV with the affinity constant reaching to 2.3 × 10⁸ mol/L. Sensitivity evaluation was performed by measuring CTV standard solutions with concentrations ranging from 0 to 200 ng/mL diluted in 0.01 M PBS. An S-shaped calibration curve for mAb 6B2 was obtained as shown in (C). The equation of the line was Y = 0.08 ± 0.04 + [(1.52 ± 0.04 – 0.08 ± 0.04)/(1 + (X/4.0 ± 0.54)0.78 ± 0.07], with a linear regression correlation coefficient of 0.997. The IC20 and IC50 values calculated from the equation were 0.68 and 4.1 ng/mL, respectively. The lower IC20 and IC50 values suggested the higher sensitivity of anti-CTV mAb.
Figure 3. Characterization of anti-CTV mAb 6B2, including isotype (A), affinity (B), and sensitivity (C). And characterization of GNPs-labelled mAb by UV/Vis spectra (D).
Specificity assessment
Because AFB1, AFB2, AFG1, AFG2, ZEN, DON and CTV may coexisted in rice, maize and other crops (Almeida et al., Citation2012), in order to avoid false positives, the specificity of the anti-CTV mAb 6B2 was assessed further by testing cross-reaction (CR). As indicated in , the six compounds were not recognized by 6B2, even at concentrations as high as 1 μg/mL, indicating CRs less than 1%. Therefore, our anti-CTV mAb 6B2 possessed high specificity to CTV.
Table 2. Cross-reaction results of the anti-CTV mAb 6B2.
Tolerance to ethanol
Due to its hydrophobic nature, CTV is extracted from samples using a variety of organic solvents, including methanol, acetonitrile, chloroform, dichloromethane and ethanol (Maragos et al., Citation2019). Except for ethanol, the other solvents are harmful to human health and the environment. This study, therefore, focused on developing a safe sample pretreatment procedure, and therefore, ethanol was used to extract CTV. For this reason, the tolerance of mAb 6B2 to ethanol was determined. Results () showed that at high ethanol content (exceeding 20% v/v), the antibody titre (ODmax) dropped significantly. Excellent results were seen with ethanol at 10% (v/v), which gave the lowest IC50 of 3.51 ng/mL. As a result of this finding, ethanol concentrations should be kept at 10% (v/v) for optimum sample detection.
Table 3. Effects of ethanol concentration on anti-CTV mAb.
Characterization of GNP-labelled mAb
The main interaction involved in the coupling of antibody to the GNPs is noncovalent bonding, such as electrostatic adsorption and hydrophobic interactions, where the contribution from the gold–sulphur bond is weak. Therefore, GNP-labelled mAb exhibit poor stability. In this study, 1% BSA was used to stabilize the GNP-labelled mAb during the preparation process and different surfactants (Tween, PEG, trehalose, sucrose and BSA) were added to the Tris–HCl buffer to stabilize the GNP-labelled mAb during the storage process. GNPs (15 nm) have a characteristic absorption at 518 nm, but after reacting with antibody, the absorption peak is red-shifted to 533 nm (D), demonstrating that the GNP-mAb conjugates were successfully prepared.
Optimization of the ICS
Surfactants are essential for the efficient running of test strips due to incompatibility issues between the NC membrane and detection solution (Kong et al., Citation2019; Liu et al., Citation2017; Song et al., Citation2019). In this study, GNP-labelled mAb and sample solution were mixed with a basic buffer (0.02 M Tris–HCl supplemented with 5% sucrose, 0.1% PEG, 0.1% Tween-20, 5% trehalose and 0.2% BSA) containing different surfactants, including polyvinylpyrrolidone (PVP), PEG and BSA. After evaluation by testing 0 and 250 ng/mL of CTV in 0.01 M PBS (with detection antigen at 0.6 mg/mL and antibody labelling at 10 μg/mL), the most stable and strong red colour on the T0 line and complete absence of colour on T250 line were seen by using PVP (A). In addition, the mAb 6B2 provided a greater color signal than 6C9, therefore, 6B2 was selected for further experiments (A).
Figure 4. (A) Optimization antibodies (6B2 and 6C9) and surfactants. #4, 1, 2, 4, and 13 represent basic buffer and basic buffer respectively containing PVP, PEG, BSA, and Triton X-100. (B) Optimization the amount of antibody (6B2) labelling and the concentration of antigen spraying. (C) The strip test images of CTV in rice samples. a = 0 μg/kg, b = 50 μg/kg, c = 100 μg/kg, d = 250 μg/kg, e = 500 μg/kg, f = 1000 μg/kg, g = 2500 μg/kg (n = 5).
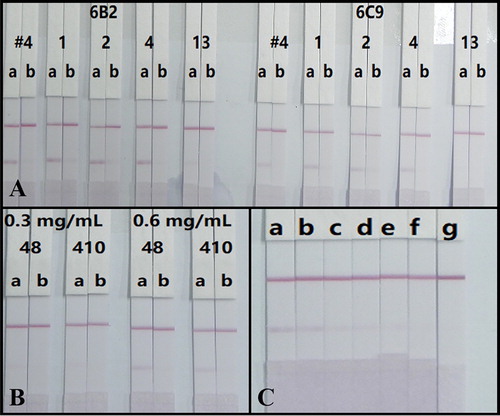
The ICS is based on the competitive inhibition of the binding of detection reagent CTV-COOH-BSA on the T line and the limited amount of GNP-labelled mAb by the free CTV in the samples. Therefore, the concentrations of CTV-COOH-BSA and GNPs-labelled mAb are especially important and would affect the sensitivity of the assay (Song et al., Citation2019). Concentrations of CTV-COOH-BSA (0.3 and 0.6 mg/mL) for spraying and mAb 6B2 (8 and 10 μg/mL) for labelling were assessed based on the color intensity of the T line when testing 0 (T0) and at 250 (T250) ng/mL of CTV standard solution (prepared in 0.01 M PBS). The results in (B) indicated that the combination of 0.6 mg/mL of antigen spraying and 8 μg/mL of antibody labelling yielded the highest color intensity on the T0 line.
Sample analysis
To validate the practicability of the developed analytical method, the rice samples verified as CTV negative by LC-MS/MS (data not shown) were spiked with CTV standards at concentrations of 0–2500 μg/kg and detected by our test strips under optimal conditions. The spiked samples were prepared on different days and each concentration was analysed five times with the same batch of strips. The results presented in (C) showed that the colour intensity of the T line weakened when the concentration of CTV increased. Significantly weaker T lines compared to the negative sample were observed at 100 μg/kg, which was regarded as the visible detection limit. Furthermore, 1000 μg/kg of CTV caused a colourless T line which represented the cut-off limits for the rice samples. Therefore, the ICS can be applied for the semi-quantitative detection of CTV in rice samples.
Conclusion
This is the first study to produce a high sensitivity, high specificity, and ethanol-tolerant anti-CTV mAb. After labelling with GNPs by electrostatic adsorption, the anti-CTV antibody was applied to establish a membrane-based ICS assay. With 40% (v/v) ethanol/water extraction, the assay allowed the rapid and safe determination of CTV residues in rice samples within 5–10 min. The serious risk of CTV on human health has led to an urgent need for a reliable, fast, safe, portable and high-throughput screening method that can assist in government surveillance and safeguarding of consumer rights.
Disclosure statement
No potential conflict of interest was reported by the author(s).
Additional information
Funding
References
- Almeida, M. I., Almeida, N. G., Carvalho, K. L., Goncalves, G. A., Silva, C. N., Santos, E. A., Garcia, J. C., & Vargas, E. A. (2012). Co-occurrence of aflatoxins B(1), B(2), G(1) and G(2), ochratoxin A, zearalenone, deoxynivalenol, and citreoviridin in rice in Brazil. Food Additives & Contaminants. Part A, Chemistry, Analysis, Control, Exposure & Risk Assessment, 29(4), 694–703. https://doi.org/10.1080/19440049.2011.651750
- Cao, Y., Shi, H., Le, T., Tang, R., & Xie, Y. (2019). Development a monoclonal antibody-based enzyme-linked immunosorbent assay for screening pyrimethanil in fruits and vegetables. Food and Agricultural Immunology, 30(1), 548–563. https://doi.org/10.1080/09540105.2019.1608160
- Chen, Y., Kong, D., Liu, L., Song, S., Kuang, H., & Xu, C. (2016). Development of an ELISA and immunochromatographic assay for tetracycline, oxytetracycline, and chlortetracycline residues in milk and honey based on the class-specific monoclonal antibody. Food Analytical Methods, 9(4), 905–914. https://doi.org/10.1007/s12161-015-0262-z
- da Rocha, M. W., Resck, I. S., & Caldas, E. D. (2015). Purification and full characterisation of citreoviridin produced by Penicillium citreonigrum in yeast extract sucrose (YES) medium. Food Additives & Contaminants. Part A, Chemistry, Analysis, Control, Exposure & Risk Assessment, 32(4), 584–595. https://doi.org/10.1080/19440049.2014.961177
- DeAn, L., Shuqiu, S., Xiaodan, L., & Xuemei, Q. (2004). Determination of citreoviridin in crops by high performance liquid chromatography. Doc. Chinese Journal of Endemiology, 23, 160–162.
- Feng, C., Li, D., Jiang, L., Liu, X., Li, Q., Geng, C., Sun, X., Yang, G., Yao, X., & Chen, M. (2017). Citreoviridin induces triglyceride accumulation in hepatocytes through inhibiting PPAR-alpha in vivo and in vitro. Chemico-Biological Interactions, 273, 212–218. https://doi.org/10.1016/j.cbi.2017.06.021
- Guo, L., Liu, L., Cui, G., Ma, S., Wu, X., & Kuang, H. (2019). Gold immunochromatographic assay for kitasamycin and josamycin residues screening in milk and egg samples. Food and Agricultral Immunology, 30(1), 1189–1201. https://doi.org/10.1080/09540105.2019.1677567
- Hao, K., Suryoprabowo, S., Song, S., Liu, L., & Kuang, H. (2017). Rapid detection of zearalenone and its metabolite in corn flour with the immunochromatographic test strip. Food and Agricultral Immunology, 29(1), 498–510. https://doi.org/10.1080/09540105.2017.1406461
- Hou, H.-F., Yuan, N., Guo, Q., Sun, T., Li, C., Liu, J.-B., Li, Q.-W., & Jiang, B.-F. (2015). Citreoviridin enhances atherogenesis in hypercholesterolemic ApoE-deficient mice via upregulating inflammation and endothelial dysfunction. PLOS ONE, 10(5), e0125956. doi: 10.1371/journal.pone.0125956
- Jiang, W., Zeng, L., Liu, L., Song, S., & Kuang, H. (2017). Immunochromatographic strip for rapid detection of phenylethanolamine A. Food and Agricultral Immunology, 29(1), 182–192. https://doi.org/10.1080/09540105.2017.1364709
- Jin, N., Ling, S., Yang, C., & Wang, S. (2014). Preparation and identification of monoclonal antibody against citreoviridin and development of detection by Ic-ELISA. Toxicon, 90, 226–236. https://doi.org/10.1016/j.toxicon.2014.08.057
- Kong, D., Wu, X., Li, Y., Liu, L., Song, S., Zheng, Q., Kuang, H., & Xu, C. (2019). Ultrasensitive and eco-friendly immunoassays based monoclonal antibody for detection of deoxynivalenol in cereal and feed samples. Food Chemistry, 270(1), 130–137. https://doi.org/10.1016/j.foodchem.2018.07.075
- Kota, N., Yasunori, M., Yuko, I., Mari, I., Masahiko, T., Yukie, S., Toshinori, Y., Yoshiko, S.-K., & Makoto, S. (2018). Developmental exposure of citreoviridin transiently affects hippocampal neurogenesis targeting multiple regulatory functions in mice. Food and Chemical Toxicology, 120, 590–602. https://doi.org/10.1016/j.fct.2018.07.051
- Lai, S., Matsunaga, K., Shizuri, Y., & Yamamura, S. (1990). Biomimetic synthesis of citreoviridin-type compounds and isolation of epicitreoviridinol, a new metabolite of penicillium pedemontanum IFO 9583. Tetrahedron Letters, 31(38), 5503–5506. https://doi.org/10.1016/S0040-4039(00)97883-3
- Li, H., Sun, B., & Chen, T. (2019). Detection of clothianidin residues in cucumber and apple juice using lateral-flow immunochromatographic assay. Food and Agricultral Immunology, 30(1), 1112–1122. https://doi.org/10.1080/09540105.2019.1667309
- Lin, L., Wu, X., Luo, P., Song, S., Zheng, Q., & Kuang, H. (2019). IC-ELISA and immunochromatographic strip assay based monoclonal antibody for the rapid detection of bisphenol S. Food and Agricultral Immunology, 30(1), 633–646. https://doi.org/10.1080/09540105.2019.1612330
- Liu, L., Xu, L., Suryoprabowo, S., Song, S., & Kuang, H. (2017). Rapid detection of tulathromycin in pure milk and honey with an immunochromatographic test strip. Food and Agricultral Immunology, 29(1), 358–368. https://doi.org/10.1080/09540105.2017.1376040
- Maragos, C. M., Uchiyama, Y., Kobayashi, N., Kominato, F., & Sugita-Konishi, Y. (2019). Development and characterization of monoclonal antibodies for the mycotoxin citreoviridin. Toxins, 11(11), 630–642. https://doi.org/10.3390/toxins11110630
- Meng, X., Ji, D., Zhang, W., Fu, L., Wang, H., & Wu, P. (2019). Determination of 3.5-dinitro-N’-(5-nitrofurfurylidene) salicylic acid hydrazide in fish using immunochromatographic strip tests. Food and Agricultral Immunology, 30(1), 475–486. https://doi.org/10.1080/09540105.2019.1600473
- Nishie, K., Cole, R. J., & Dorner, J. W. (1988). Toxicity of citreoviridin. Research Communications in Chemical Pathology and Pharmacology, 59(1), 31–52. https://doi.org/10.1007/BF00212857
- Peng, J., Liu, L., Xu, L., Song, S., Kuang, H., Cui, G., & Xu, C. (2017). Gold nanoparticle-based paper sensor for ultrasensitive and multiple detection of 32 (fluoro)quinolones by one monoclonal antibody. Nano Research, 10(1), 108–120. https://doi.org/10.1007/s12274-016-1270-z
- Rosa, C. A., Keller, K. M., Oliveira, A. A., Almeida, T. X., Keller, L. A., Marassi, A. C., Kruger, C. D., Deveza, M. V., Monteiro, B. S., Nunes, L. M., Astoreca, A., Cavaglieri, L. R., Direito, G. M., Eifert, E. C., Lima, T. A., Modernell, K. G., Nunes, F. I., Garcia, A. M., Luz, M. S., & Oliveira, D. C. (2010). Production of citreoviridin by Penicillium citreonigrum strains associated with rice consumption and beriberi cases in the Maranhao State, Brazil. Food Additives & Contaminants. Part A, Chemistry, Analysis, Control, Exposure & Risk Assessment, 27(2), 241–248. https://doi.org/10.1080/19440040903289712
- Sakabe, N., Goto, T., & Hirata, Y. (1964). The structure of citreoviridin, a toxic compound produced by P. Citreoviride molded on rice. Tetrahedron Letters, 5(27), 1825–1830. https://doi.org/10.1016/S0040-4039(01)89494-6
- Song, S., Suryoprabowo, S., Liu, L., Kuang, H., Xu, L., Ma, W., & Wu, X. (2019). Development of monoclonal antibody-based colloidal gold immunochromatographic assay for analysis of halofuginone in milk. Food and Agricultral Immunology, 30(1), 112–122. https://doi.org/10.1080/09540105.2018.1550058
- Song, S., Suryoprabowo, S., Liu, L., Zheng, Q., Wu, X., & Kuang, H. (2019). Development of an immunochromatographic strip test for rapid detection of sodium nifurstyrenate in fish. Food and Agricultral Immunology, 30(1), 236–247. https://doi.org/10.1080/09540105.2019.1571566
- Sun, S. (2010). Chronic exposure to cereal mycotoxin likely citreoviridin may be a trigger for Keshan disease mainly through oxidative stress mechanism. Medical Hypotheses, 74(5), 841–842. https://doi.org/10.1016/j.mehy.2009.11.043
- Uchiyama, Y., Takino, M., Noguchi, M., Shiratori, N., Kobayashi, N., & Sugita-Konishi, Y. (2019). The In vivo and In vitro toxicokinetics of citreoviridin extracted from Penicillium citreonigrum. Toxins (Basel, 11(6). https://doi.org/10.3390/toxins11060360
- Wang, R., Gu, X., Zhuang, Z., Zhong, Y., Yang, H., & Wang, S. (2016). Screening and molecular evolution of a single chain variable fragment antibody (scFv) against citreoviridin toxin. Journal of Agricultural and Food Chemistry, 64(40), 7640–7648. https://doi.org/10.1021/acs.jafc.6b02637
- Wang, Z., Guo, L., Liu, L., Kuang, H., & Xu, C. (2018). Colloidal gold-based immunochromatographic strip assay for the rapid detection of three natural estrogens in milk. Food Chemistry, 259, 122–129. https://doi.org/10.1016/j.foodchem.2018.03.087
- Wu, S., Zhang, X., Yang, P., Li, L., & Tang, S. (2018). Rapid detection and toxicity assessment of citreoviridin using luminescent Vibrio qinghaiensis sp.-Q67 in drinking water. Internatioanl Journal of Food Science & Technology, 53(9), 2141–2149. https://doi.org/10.1111/ijfs.13801
- Zhuang, Z. H., Que, S. J., Gao, Y. M., Yuan, J., Ye, Z., Du, M., Lin, G. M., Liu, L. C., & Wang, S. H. (2013). Artificial antigen synthesis and the development of polyclonal antibody-based immunoassay for citreoviridin determination. World Journal of Microbiology and Biotechnology, 30(1), 343–349. https://doi.org/10.1007/s11274-013-1431-0