
ABSTRACT
This study used surface imprinting polymerization to synthesize molecularly imprinted polymer on the surface of PAF-45 material (PAF-45@MIP). SEM, FT-IR, static and kinetic adsorption experiments were adopted to investigate the morphology and properties of the MIP. The results showed that the PAF-45@MIP could rapidly absorb histamine with a high adsorption capacity. Using PAF-45@MIP as a biomimetic antibody and Pt nanozyme as a marker, a novel direct competitive biomimetic immunoassay (BIA) method for rapidly detecting histamine in foods was developed. Under optimal conditions, the limit of detection and sensitivity of the BIA method were 0.128 and 8.306 mg/L, respectively. Vinegar spiked with histamine was determined using the BIA method with recoveries ranging from 81.50% to 90.38%. The BIA method was also applied to determine histamine in dried shrimp and soy sauce samples, the results correlating well with those obtained using high-performance liquid chromatography.
1. Introduction
Histamine (HA) is a biogenic amine present in foods and organisms, particularly in fermented foods. HA is produced through bacterial decarboxylation, and its accumulation leads to a decline in food quality (Kounis & Zavras, Citation1991; Nóra et al., Citation2012; Yadav et al., Citation2019). It is not only an important mediator of inflammatory response and immune damage, but also plays an important role in regulating the inflammatory response (Gagic et al., Citation2019). The hypersensitivity effect of HA causes local or systemic capillary dilatation and bronchoconstriction. An allergy induced by HA is characterized by headaches, nausea, hypotension, vomiting, itching, gastric acid release and a red rash. Therefore, monitoring the level of HA in foods is very important for human health (Gao et al., Citation2015; Kovacova-Hanuskova et al., Citation2015).
During recent years, HA has been determined in foods by several techniques: spectrofluorimetry (Tong et al., Citation2002), capillary electrophoresis (Vitali et al., Citation2013), electrochemical methods (Saghatforoush et al., Citation2014), high performance liquid chromatography (HPLC) (Altieri et al., Citation2016; Yoshitake et al., Citation2010), thin layer chromatography (Tao et al., Citation2011) and enzyme-linked immunosorbent assay (ELISA) (Hungerford & Wu, Citation2012). Of these, ELISA has attracted wide attention because of its high sensitivity and specificity (Singha et al., Citation2011). However, the biology antibody used in this assay is greatly limited by its low stability during detection. To solve this problem, molecularly imprinted polymers (MIPs) with their excellent properties of mechanical/chemical stability have been selected as biomimetic antibodies (Lv et al., Citation2013; Wang et al., Citation2019). However, the high crosslinking properties of bulk polymerization lead to the incomplete removal of the template and a weak binding capacity. To overcome these problems, surface imprinting technology has been reported to synthesize the polymers, which can control the binding sites on the surface of the carrier (Gao et al., Citation2007). PAF-45 material, covalently bonded through aromatic rings, can be used as a carrier because it exhibits both a high surface area and high thermal and chemical stability (Li et al., Citation2015). Its rigid structural network and inherent porosity also lead to its excellent desired properties: low density, high chemical and thermal stability and a large specific surface area (Wang, Jia, et al., Citation2018).
Although significant advances have been achieved in the field of traditional ELISA, some challenges still remain to be solved before practical application. One important challenge is that natural enzymes have complex structures, leading to a low recognition rate of the molecular imprint after natural enzymes have linked to the target. Several intrinsic drawbacks, such as denaturation, high production costs, and difficulties in long-term storage and recycling, can also dramatically hinder the practical applications of natural enzymes (He et al., Citation2020; Jin et al., Citation2019). Currently, nanozymes, nanomaterials with enzyme-like properties for application in biosensing and immunoassay, are being developed which act as unique artificial enzymes (Attar et al., Citation2019; Wang, Wei, et al., Citation2018). As these nanozymes possess the advantages of high stability with a simple and large-scale methods of preparation, they have emerged as alternatives to natural enzymes (Zhou et al., Citation2017). The application of nanozymes has received much attention in the fields of medicine, chemical industry, food, agriculture and the environment. Regarding nanoparticles, Pt nanoparticles (Pt NPs) have excellent catalytic properties and biocompatibility with biomolecules (Gao et al., Citation2013).
Therefore, the present study aims to combine surface molecular imprinting technology with a Pt nanozyme to establish a competitive biomimetic immunoassay (BIA) method for the rapid detection of HA in foods. The PAF-45@MIP will be used as a biomimetic antibody and the polymers will be characterized using scanning electron microscopy (SEM). A Pt nanozyme with peroxidase-like properties will be used as a marker. The accuracy and selectivity of the BIA method will be evaluated then its practicability investigated for detecting HA in real food samples.
2. Materials and methods
2.1. Food samples
The vinegar and soy sauce samples were purchased from a local supermarket (Taian, China), and dried shrimp was purchased randomly from a market in Taian (Shandong, China).
2.2. Reagents and chemicals
HA, tyramine, and tryptamine were obtained from Yuanye Bio-Technology Co., Ltd. (Shanghai, China), polyvinyl pyrrolidone (PVP) from BASF (Ludwigshafen, Germany), 3-aminopropyl triethoxysilane (APTES) and tetraethyl orthosilicate (TEOS) from Macklin Biochemical Co., Ltd. (Shanghai, China), 3,3′,5,5′-tetramethylbenzidine (TMB) and ethylene glycol dimethacrylate (EGDMA) from Sigma-Aldrich (St Louis, MO, USA), chloroplatinic acid hexahydrate, histamine dihydrochloride and aluminum chloride from Aladdin Industrial Corporation (Shanghai, China), biphenyl from Xiya Chemical Industry Co., Ltd. (Linyi, Shandong, China) and methacrylic acid (MAA), 2,2′-azobis(2-methylpropionitrile) (AIBN), dimethyl sulfoxide (DMSO) and ammonia solution from Kaitong Chemical Reagent Co., Ltd. (Tianjin, China).
2.3. Apparatus
The FT-IR spectra of the samples enclosed in a KBr pellet were obtained using a NICOLET iS10 spectrometer (Thermo Fisher Scientific, Waltham, MA, USA). The biomimetic immunoassay absorbance was read using a Multimode Plate Reader (Molecular Devices, Sunnyvale, CA, USA). The morphology of the PAF-45 and PAF-45@MIP were characterized by scanning electron microscopy (SEM; JEOL model JSM-6700F, Tokyo, Japan). HPLC (Shimadzu Corp., Kyoto, Japan) was used to detect the HA content in the samples of dried shrimp, vinegar and soy sauce on a C18 column (250 × 4.6 mm, 5 μm) (Nouryon Separation Products, Bohus, Sweden) with a mobile phase of 1% acetic acid 30% (A) and acetonitrile 70% (B). The injection volume of the sample was 20 μL, and the flow rate was 0.8 mL/min. The column temperature was 35 °C, and a UV wavelength of 254 nm was used for the analysis.
2.4. Synthesis of Pt NPs
The Pt NPs were synthesized as described by Sri Ramkumar et al. (Citation2017). Briefly, 19 mL of aqueous H2PtCl6·6H2O solution (3.15 mM), 6.66 mg PVP and 81 mL of ethanol were added to a round-bottomed flask, mixed then incubated at 100 °C for 3 h. After cooling, the obtained products were stored in the dark at 4°C before further use.
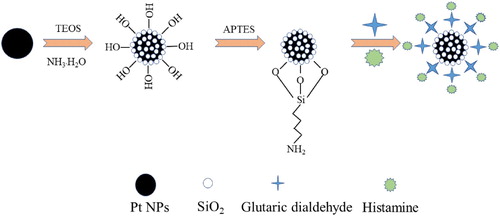
2.5. Synthesis of Pt@SiO2@HA nanocomposite
The nanocomposite was prepared by the following steps: 20 mL of Pt NPs were dispersed in a 50-mL round-bottomed flask. After 100 μL of ammonia solution were added, 200 μL of TEOS were added dropwise to the dispersion with continuous stirring (Hori et al., Citation2006). The reactant solution was then incubated at room temperature for 2 h. The Pt@SiO2 nanoparticles were isolated by centrifugation then washed with ethanol several times to remove excess TEOS and ammonia solution (Oh & Kim, Citation2013). The Pt@SiO2 nanoparticles were dispersed in 10 mL of ethanol then 200 μL of APTES were added dropwise to the dispersion with continuous stirring for 4 h. The Pt@SiO2-NH2 was collected by centrifugation (6912 × g) then thoroughly washed with ethanol. Subsequently, 1 mL of glutaric dialdehyde (30%) was added dropwise with continuous stirring for 1 h then 10 mL of HA solution (0.45 M) were added followed by incubation for 4 h. The Pt@SiO2@HA nanocomposite was centrifuged (6912 × g) for 10 min, washed twice with ethanol then dispersed in 50 mL of ethanol before further use. The preparation of Pt@SiO2@HA was shown in Scheme 1.
Scheme 1. Schematic illustration of the preparation of Pt@SiO2@HA.
2.6. Synthesis of PAF-45 material
The PAF-45 material was synthesized as described by Zhang et al. (Citation2017). In detail, aluminum chloride (AlCl3, 6 g) and CHCl3 (100 mL) were mixed, vigorously stirred in a 250-mL round-bottomed flask for 6 h, then the solution was heated for 30 mins at 80°C. Biphenyl (800 mg) in 40 mL CHCl3 was then added. After 40 min, the temperature of the solution was reduced to 70°C then stirred for 40 min. After cooling, a purple-black crude product was obtained by filtration. This product was then washed with 50% alcohol and 50% HCl (1 M) to remove the excess biphenyl and AlCl3. Finally, the product was washed several times with water, then dried in a vacuum oven for 12 h at 60°C.
2.7. Synthesis of PAF-45@MIP
The MIP was synthesized using surface imprinting polymerization method (Ye et al., Citation2018; Zhang et al., Citation2018). Histamine dihydrochloride (1 mmol) was dissolved in DMSO (4 mL), then 3 mmol MAA was added. After stirring for 30 min, the PAF-45 (80 mg) was added, followed by stirring for 60 min before the initiator (AIBN, 20 mg) and the crosslinker (EGDMA, 3 mmol) were added. After 30 min, the polymers were ultrasonically dispersed for 5 min then degassed for 10 min with nitrogen to remove the oxygen. The flask was then sealed and heated at 60°C in a water bath for 18 h. The PAF-45@MIP was dried under vacuum at 60°C for 12 h, suspended and refluxed with a solution of methanol/acetic acid (9:1) for 18 h, then eluted with methanol for 6 h. Finally, the PAF-45@MIP was dried in a vacuum oven at 60°C for 12 h then passed through a 200-mesh sieve.
The non-imprinted polymer (NIP) was prepared using the same procedure without adding the template molecule of histamine dihydrochloride.
2.8. Static and dynamic adsorption test
The procedure for evaluating the binding capacity of the PAF-45@MIP was as follows: 10 mg of the PAF-45@MIP or PAF-45@NIP were added to 10 mL of HA standard solution (10–50 mg/L) in a methanol solution. The mixture was then shaken for 4 h and centrifuged (6912 × g) for 10 min. Finally, the absorbance of the supernatant solution was determined, and the adsorption capacity was calculated.
2.9. BIA procedure
The BIA procedure was as follows: First, 5 mg of PAF-45@MIP, 5 mL of Pt@SiO2@HA nanocomposite and 5 mL of a standard solution of HA (0.1–300 mg/L) or 5 mL of the sample extract solution were added to a volumetric flask. Then, the mixture was then shaken for 40 min and centrifuged (3456 × g) for 10 min, after which 100 μL of the supernatant were transferred to each well of a 96-well plate. Finally, 50 μL of TMB solution and 50 μL of H2O2 solution were added to the microplate then incubated for 30 min at room temperature. The reaction was terminated by adding 30 μL of H2SO4 (1.25 mol/L). The absorbances at 450 nm were then measured and the inhibition rates calculated.
2.10. Sample preparation
First, 5.0 g of crushed dried shrimp was weighed and transferred into a 50-mL centrifuge tube. After adding 10 mL of trichloroacetic acid (5%wt), the mixture was vortexed for 30 min then centrifuged at 5000 rpm for 10 min. The extraction solution was transferred to a 50-mL volumetric flask then the remaining residue was extracted again and the extracted solution was diluted with trichloroacetic acid (5%wt) to volume. Ten millilitre of the extract solution was then transferred to a 25-mL stoppered test tube, and 0.5 g of NaCl and 10 mL of n-hexane were added successively. The mixture was vortexed for 5 min and the organic phase was removed. Five milliliter of a mixture of trichloroacetic acid and butanol-chloroform (v:v, 1:1) were added to the above solution, vortexed then centrifuged at 4320 × g for 10 min. The organic phase was collected and evaporated to dryness under a nitrogen atmosphere at 40°C. The residue was dissolved in 5 mL of ethyl alcohol for analysis. The liquid product was analyzed by the BIA method after filtering with a 0.22-μm membrane.
The soy sauce and vinegar samples were prepared as described above, without adding trichloroacetic acid.
2.11. HPLC analysis
After the above treatment, the liquid sample was transferred to a tube, 100 μL of sodium carbonate solution, 1 mL of sodium bicarbonate solution and 1 mL of dansyl chloride solution were added. The tube was vortexed then incubated for 15 min at 60°C in a water bath. Subsequently, 100 μL of sodium glutamate were added for 15 min at 60°C in a water bath. The tube was cooled to room temperature then 1 mL of H2O was added. The tube was vortexed and dried under nitrogen at 40°C in a water bath. Finally, 0.5 g of NaCl and 5 mL of diethyl ether were added. The tube was vortexed and the organic layer extracted. The extraction step was repeated twice. The extraction solution was dried under nitrogen at 40°C. The residue was dissolved in 1 mL of acetonitrile for analysis. Before HPLC analysis, the solution was filtered through a 0.22-μm membrane.
2.12. Data analysis
The ANOVA test was used to evaluate the differences between the results obtained from BIA and HPLC method using SAS software (SAS Institute, Cary, NC, USA).
3. Results and discussions
3.1. Optimization of conditions for PAF-45@MIP preparation
To study the effect of the amount of PAF-45 added on the adsorption behavior and structure of the polymers, five types of PAF-45@MIP were prepared using different PAF-45 levels (20, 40, 60, 80 and 100 mg) (Figure S1). As the amount of PAF-45 added increased, the amount of HA adsorbed by the material tended to increase at first and then to decrease. Adding too much material resulted in a lower adsorption ability and selectivity. Overall, the optimal amount of added PAF-45 was 80 mg.
The ratio of polymerization is a crucial factor which can affect the morphology, structure, adsorption capacity, and selectivity performance of MIPs. A high concentration of EGDMA would cause the polymer to become too rigid and impede the removal of the templates. Table S1 shows that the highest adsorption capacity was obtained when the ratio of template molecule, functional monomer and cross-linker was 1:3:3.
3.2. FT-IR spectroscopy analysis
The FT-IR spectra of the Pt@SiO2 and Pt@SiO2@HA are compared in (A). The peaks at 1046 and 800 cm−1 were ascribed to the characteristic absorption of the Si-O-Si symmetric and asymmetric stretching vibrations, respectively. The band at 431 cm−1 was related to the bending vibration of the Si-O-Si group (Abdel-Galil et al., Citation2020). The peaks appearing at 3312 cm−1 indicated the OH stretching vibration on the surface of the silicon layer. These results indicated that the SiO2 nanoparticles had been adsorbed onto the surface of the Pt NPs. The surface of the Pt NPs was coated with a silica shell to facilitate the subsequent amination modification. For Pt@SiO2@HA, the peaks at approximately 1650 cm−1 were ascribed to the stretching vibration of the C=O group from glutaric dialdehyde (Hashemi et al., Citation2017). An obvious peak at 970 cm−1 was the characteristic absorption peak from C-N stretching vibration absorption. These results verified that Pt@SiO2 had successfully labeled the HA.
Figure 1. (A) FT-IR spectra of (a) Pt@SiO2 and (b) Pt@SiO2@HA. (B) FT-IR spectra of diphenyl and PAF-45. (C) FT-IR spectra of (a) Histamine dihydrochloride, (b) PAF-45@NIP, (c) PAF-45@MIP before extraction, and (d) PAF-45@MIP after extraction.
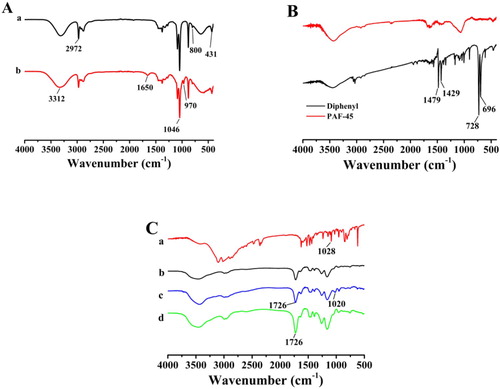
The chemical structure of biphenyl and PAF-45 were characterized by the FT-IR spectra shown in (B). The absorption peaks located at 696 and 728 cm−1 indicated the C-H vibrations of the benzene ring. In contrast to biphenyl (shown in black), the spectrum of PAF-45 (red) showed that the C-H band had obviously weakened. The absorption peaks located at 1429 and 1479 cm−1 indicated the C-C vibrations of the benzene ring. In contrast to biphenyl (black), the spectrum of PAF-45 (red) showed that the vibration intensity of the C-C bond had obviously changed, which could be attributed to the formation of polymeric networks during the reaction caused by the restriction of the stretching and deformation vibration of molecules (Zhao et al., Citation2019). These results suggested that the PAF-45 has been synthesized.
The FT-IR spectra of histamine dihydrochloride (a), PAF-45@NIP (b), PAF-45@MIP before extraction (c), and PAF-45@MIP after extraction (d) are shown in (C). The absorption peak at 1726 cm−1 corresponded to the C=O stretching vibration of the MAA structure. For the FT-IR spectra of histamine dihydrochloride and PAF-45@MIP before extraction, the peaks at 1020 and 1028 cm−1 were related to the C-N group stretching vibration peaks from histamine dihydrochloride (Wang et al., Citation2017). The stretch shift in the C-N stretching peak was caused by the amino group of histamine dihydrochloride reacting with the carboxyl group of MAA through hydrogen-bond interactions. In contrast, the spectra of the PAF-45@MIP after extraction had no vibration bands for the C-N group, indicating that the template molecule had been completely removed after extraction. These results suggested that the MIP had been successfully synthesized.
3.3. Electron microscope analysis
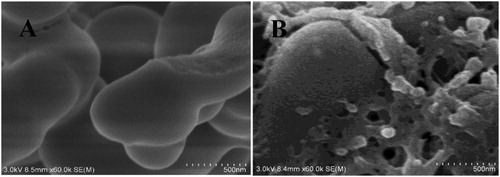
In the present study, the morphology of PAF-45 and PAF-45@MIP were characterized using scanning electron microscopy (SEM). (A) shows that the morphology of PAF-45 appeared typically amorphous. After the PAF-45 had been modified with MIP, its surface became rougher (B), indicating that the imprinted polymer had been wrapped onto the surface of the PAF-45 and that the PAF-45@MIP had been synthesized successfully.
Figure 2. SEM images of (A) PAF-45 and (B) PAF-45@MIP.
3.4. Adsorption capacity and adsorption kinetics tests
The adsorption capacity of the PAF-45@MIP for HA was evaluated by static equilibrium experiments at room temperature with HA concentration from 10 to 50 mg/L (A). The adsorption capacities of PAF-45@MIP and PAF-45@NIP increased with increasing HA concentration. The PAF-45@MIP absorbed 37% more HA at a concentration of 50 mg/L than PAF-45@NIP. This result indicated that the PAF-45@MIP had specifically adsorbed HA.
Figure 3. Adsorption isotherm (A) and the uptake kinetic (B) plots of the PAF-45@MIP and PAF-45@NIP.
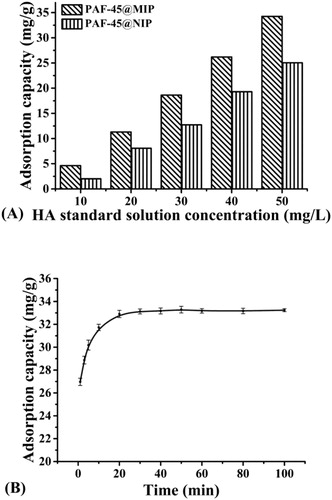
The adsorption kinetics of PAF-45@MIP toward HA at 50 mg/L are shown in (B). The binding capacity of PAF-45@MIP had a high adsorption rate within the first 10 min then almost achieved equilibrium within 30 min. This phenomenon was caused mainly by the polymerization method, which had improved the adsorption rate and reduced the mass transfer resistance. The rapid adsorption speed of PAF-45@MIP provides an obvious advantage for its application in the BIA method.
3.5. Optimization of BIA conditions
To improve the sensitivity of the BIA method, the assay conditions including the buffer system and competitive time were optimized in detail.
The buffer solution had an obvious effect on the sensitivity of the BIA method: Figure S2A shows that the inhibition ratio and sensitivity were highest in the ethanol buffer system. Therefore, the ethanol buffer system was selected for the following experiments. The influence of competitive time between 10 and 60 min on the inhibition rate was also investigated. Figure S2B shows that the inhibition rate increased with the competitive time increasing from 10 to 40 min, and then the reaction had almost completed. Therefore, 40 min was selected as the optimal competitive time.
3.6. Development of BIA standard curves
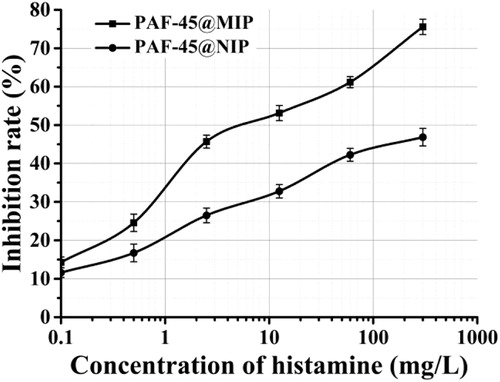
Using PAF-45@MIP as the biomimetic antibody and Pt@SiO2@HA as the label, a competitive biomimetic immunoassay was developed for HA standard solutions at concentrations between 0.1 and 300 mg/L (). The sensitivity (IC50) of the method for HA was 8.306 mg/L and its limit of detection (LOD, IC15) was 0.128 mg/L. According to EU standards, the maximum residual amount of HA permitted in beverages is between 2 and 20 mg/L, and in fermented foods, between 50 and 100 mg/kg (Feng et al., Citation2018). The sensitivity of the BIA method therefore complied with the detection requirements of this standard.
Figure 4. The BIA standard curves of HA using the PAF-45@MIP and PAF-45@NIP as the biomimetic antibody at HA concentrations from 0.1 to 300 mg/L in ethanol buffer solution.
3.7. Selectivity of the BIA assay
To evaluate the selective recognition ability of the proposed method, the PAF-45@MIP or PAF-45@NIP were used as a biomimetic antibody, and a standard curve for BIA was established under the optimized conditions. For the same concentration of HA (60 mg/L), the PAF@MIP exhibited a higher inhibition rate (61.15%) than that for the PAF-45@NIP (42.24%).
Cross-reactivity (CR) experiments were also used to evaluate the specific recognition ability of the BIA method. The competitive assays using the structural analogues of tyramine and tryptamine are shown in and . The cross-reactivity of the PAF-45@MIP with tyramine and tryptamine was 24.70% and 15.64%, respectively. These results indicated that the PAF-45@MIP had a better recognition ability for HA. These results confirmed that the molecular structure of HA played an important role in the recognition and competitive biomimetic immunoassay.
Figure 5. The BIA standard curves of different biogenic amine using the PAF-45@MIP as biomimetic antibody at HA concentrations from 0.1 to 300 mg/L in ethanol buffer solution.
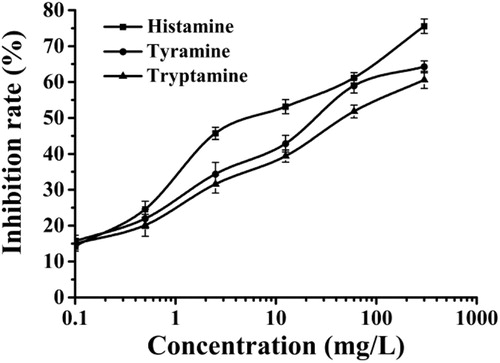
Table 1. The cross-reactivity ratio of three types of biogenic amine.
3.8. Evaluating the accuracy of the BIA method
The accuracy of the BIA method was evaluated by measuring the vinegar samples spiked with HA standards at three concentrations (2, 4 and 8 mg/L). The HA content in vinegar samples before spiking was detected by BIA method. At each concentration, measurements were made in triplicate and the recoveries calculated. Table S2 shows that the recoveries of HA were in the range of 81.50%–90.38% with relative standard deviations (RSD) ranging from 2.07% to 5.50%. These results demonstrated the effectiveness and accuracy of the BIA method for HA analysis in real food samples.
To evaluate the applicability of the method, dried shrimp and soy sauce samples were analyzed by both HPLC and BIA methods (Table S3). There were no significant differences between the two method (P > 0.05). These results indicated that the BIA method exhibited good accuracy and applicability for the determination of HA.
3.9. Advantages and disadvantages of the developed method
Compared with previously reported methods (Table S4), this method has many advantages. First, the biomimetic antibody of PAF-45@MIP provided better stability than the biological antibody, and more importantly, it can be reused ten times with no loss in sensitivity. Therefore, the cost per analysis of this method was reduced. Second, the Pt nanozyme was used as a marker, thus improving the recognition ability of MIP towards Pt@SiO2@HA. Finally, compared with HPLC (Kim et al., Citation2011), this method is simple with no complex equipment and derivatization process being required. However, the process of modifying the silicon coating influenced the catalytic activity of the Pt nanozyme: the catalytic efficiency of Pt@SiO2 was inferior to that of the natural enzyme, therefore further modification would be required to increase the catalytic efficiency of the nanozyme. Meanwhile, temperature can influence the catalytic efficiency of the nanozyme. In the following experiment, developing more stable nanozyme is urgent. The recognition ability of the MIP was also lower than that of the biological antibody, and the sensitivity of the BIA method was lower than that reported for electrochemical (Veseli et al., Citation2016) and immunochromatographic assay method (Luo et al., Citation2015). Therefore, more endeavour should be devoted to the development of biomimetic immunoassay methodology based on MIP and nanozyme in the future.
4. Conclusions
In the present study, a novel BIA method for the rapid detection of HA has been successfully developed. The BIA method provided a high sensitivity and selectivity towards HA, and could be used for accurately determining HA in foods. This study has also provided an ideal strategy for combining MIPs with a nanozyme for detecting targets in other fields.
Conflict of interest
Xiaofeng Wang declares that he/she has no conflict of interest. Xiaoqing Song declares that he/she has no conflict of interest. Lin Si declares that he/she has no conflict of interest. Longhua Xu declares that he/she has no conflict of interest. Zhixiang Xu declares that he/she has no conflict of interest.
Ethical approval
This article does not contain any studies with animals performed by any of the authors.
Informed consent
Informed consent was obtained from all individual participants included in the study.
Supplemental Material
Download MS Word (1.2 MB)Acknowledgments
This work was financially supported by the National Natural Science Foundation of China (No. 31972149).
Disclosure statement
No potential conflict of interest was reported by the authors.
Additional information
Funding
References
- Abdel-Galil, E. A., Tourky, A. S., & Kasem, A. E. (2020). Sorption of some radionuclides from nuclear waste effluents by polyaniline/sio2 composite: Characterization, thermal stability, and gamma irradiation studies. Applied Radiation and Isotopes, 156, 109009. https://doi.org/10.1016/j.apradiso.2019.109009
- Altieri, I., Semeraro, A., Scalise, F., Calderari, I., & Stacchini, P. (2016). European official control of food: Determination of histamine in fish products by a HPLC-UV-DAD method. Food Chemistry, 211, 694–699. https://doi.org/10.1016/j.foodchem.2016.05.111
- Attar, F., Shahpar, M. G., Rasti, B., Sharifi, M., Saboury, A. A., Rezayat, S. M., & Falahati, M. (2019). Nanozymes with intrinsic peroxidase-like activities. Journal of Molecular Liquids, 278, 130–144. https://doi.org/10.1016/j.molliq.2018.12.011
- Dong, X. X., Yang, J. Y., Luo, L., Zhang, Y. F., Mao, C., Sun, Y. M., Lei, H. T., Shen, Y. D., Beier, R. C., & Xu, Z. L. (2017). Portable amperometric immunosensor for histamine detection using Prussian blue-chitosan-gold nanoparticle nanocomposite films. Biosensors and Bioelectronics, 98, 305–309. https://doi.org/10.1016/j.bios.2017.07.014
- Feng, X. T., Ashley, J., Zhou, T. C., Halder, A., & Sun, Y. (2018). A facile molecularly imprinted polymer-based fluorometric assay for detection of histamine. RSC Advances, 8(5), 2365–2372. https://doi.org/10.1039/C7RA11507E
- Gagic, M., Jamroz, E., Krizkova, S., Milosavljevic, V., Kopel, P., & Adam, V. (2019). Current trends in detection of histamine in food and beverages. Journal of Agricultural and Food Chemistry, 67(3), 773–783. https://doi.org/10.1021/acs.jafc.8b05515
- Gagic, M., Nejdl, L., Xhaxhiu, K., Cernei, N., Zitka, O., Jamroz, E., Svec, P., Richtera, L., Kopel, P., Milosavljevic, V., & Adam, V. (2020). Fully automated process for histamine detection based on magnetic separation and fluorescence detection. Talanta, 212, 120789. https://doi.org/10.1016/j.talanta.2020.120789
- Gao, D. M., Zhang, Z. P., Wu, M. H., Xie, C. G., Guan, G. J., & Wang, D. P. (2007). A surface functional monomer-directing strategy for highly dense imprinting of tnt at surface of silica nanoparticles. Journal of the American Chemical Society, 129(25), 7859–7866. https://doi.org/10.1021/ja070975k
- Gao, F., Grant, E., & Lu, X. N. (2015). Determination of histamine in canned tuna by molecularly imprinted polymers-surface enhanced Raman spectroscopy. Analytica Chimica Acta, 901, 68–75. https://doi.org/10.1016/j.aca.2015.10.025
- Gao, Z, Xu, M, Hou, L, Chen, G, & Tang, D. (2013). Irregular-shaped platinum nanoparticles as peroxidase mimics for highly efficient colorimetric immunoassay. Analytica Chimica Acta, 776, 79–86. doi: 10.1016/j.aca.2013.03.034
- Hashemi, M., Nazari, Z., & Noshirvani, N. (2017). Synthesis of chitosan based magnetic molecularly imprinted polymers for selective separation and spectrophotometric determination of histamine in tuna fish. Carbohydrate Polymers, 177, 306–314. https://doi.org/10.1016/j.carbpol.2017.08.056
- He, J. B., Liu, G. Y., Jiang, M. D., Xu, L. H., Kong, F. F., & Xu, Z. Y. (2020). Development of novel biomimetic enzyme-linked immunosorbent assay method based on au@sio2 nanozyme labelling for the detection of sulfadiazine. Food and Agricultural Immunology, 31(1), 341–351. https://doi.org/10.1080/09540105.2020.1728234
- Hori, K., Matsune, H., Takenaka, S., & Kishida, M. (2006). Preparation of silica-coated pt metal nanoparticles using microemulsion and their catalytic performance. Science and Technology of Advanced Materials, 7(7), 678–684. https://doi.org/10.1016/j.stam.2006.09.013
- Hungerford, J., & Wu, W. H. (2012). Comparison study of three rapid test kits for histamine in fish: Biooscientific maxsignal enzymatic assay, neogen veratox elisa, and the neogen reveal histamine screening test. Food Control, 25(2), 448–457. https://doi.org/10.1016/j.foodcont.2011.11.007
- Jin, S. R., Wu, C., Ye, Z. Z., & Ying, Y. B. (2019). Designed inorganic nanomaterials for intrinsic peroxidase mimics: A review. Sensors and Actuators B: Chemical, 283, 18–34. https://doi.org/10.1016/j.snb.2018.10.040
- Kim, J. H., Shin, I. S., Lee, Y. K., Oh, H. J., & Ban, S. J. (2011). Improved hplc method using 2,3-naphthalenedicarboxaldehyde as fluorescent labeling agent for quantification of histamine in human immunoglobulin preparations. Osong Public Health and Research Perspectives, 2(2), 127–134. https://doi.org/10.1016/j.phrp.2011.07.003
- Kounis, N. G., & Zavras, G. M. (1991). Histamine-induced coronary artery spasm: The concept of allergic angina. The British Journal of Clinical Practice, 45(2), 121–128.
- Kovacova-Hanuskova, E., Buday, T., Gavliakova, S., & Plevkova, J. (2015). Histamine, histamine intoxication and intolerance. Allergologia et Immunopathologia, 43(5), 498–506. https://doi.org/10.1016/j.aller.2015.05.001
- Li, L. N., Cai, K., Wang, P. Y., Ren, H., & Zhu, G. S. (2015). Construction of sole benzene ring porous aromatic frameworks and their high adsorption properties. ACS Applied Materials & Interfaces, 7(1), 201–208. https://doi.org/10.1021/am505697f
- Luo, L., Xu, Z. L., Yang, J. Y., Xiao, Z. L., Li, Y. J., Beier, R. C., Sun, Y. M., Lei, H. T., Wang, H., & Shen, Y. D. (2014). Synthesis of novel haptens and development of an enzyme-linked immunosorbent assay for quantification of histamine in foods. Journal of Agricultural and Food Chemistry, 62(51), 12299–12308. https://doi.org/10.1021/jf504689x
- Luo, L., Yang, J. Y., Xiao, Z. L., Zeng, D. P., Li, Y. J., Shen, Y. D., Sun, Y. M., Lei, H. T., Wang, H., & Xu, Z. L. (2015). A sensitivity-enhanced heterologous immunochromatographic assay based on monoclonal antibody for the rapid detection of histamine in saury samples. RSC Advances, 5(96), 78833–78840. https://doi.org/10.1039/C5RA15925C
- Lv, Y. Q., Tan, T. W., & Svec, F. (2013). Molecular imprinting of proteins in polymers attached to the surface of nanomaterials for selective recognition of biomacromolecules. Biotechnology Advances, 31(8), 1172–1186. https://doi.org/10.1016/j.biotechadv.2013.02.005
- Nóra, A., Székács, I., Szendrő, I., & Székács, A. (2012). Determination of histamine content in vegetable juices by using direct and competitive immunosensors. Food and Agricultural Immunology, 25(1), 20–33.
- Oh, J. G., & Kim, H. S. (2013). Synthesis of core–shell nanoparticles with a pt nanoparticle core and a silica shell. Current Applied Physics, 13(1), 130–136. https://doi.org/10.1016/j.cap.2012.06.025
- Ramkumar, V. S., Pugazhendhi, A., Prakash, S., Ahila, N. K., Vinoj, G., Selvam, S., Kumar, G., Kannapiran, E., & Babu Rajendran, R. (2017). Synthesis of platinum nanoparticles using seaweed padina gymnospora and their catalytic activity as pvp/pt nps nanocomposite towards biological applications. Biomedicine & Pharmacotherapy, 92, 479–490. https://doi.org/10.1016/j.biopha.2017.05.076
- Rauch, P., Rychetsky, P., Hochel, I., Bilek, R., & Guesdon, J. L. (1992). Enzyme immunoassay of histamine in foods. Food & Agricultural Immunology, 4(2), 67–72. https://doi.org/10.1080/09540109209354754
- Saghatforoush, L., Hasanzadeh, M., & Shadjou, N. (2014). Polystyrene-graphene oxide modified glassy carbon electrode as a new class of polymeric nanosensors for electrochemical determination of histamine. Chinese Chemical Letters, 25(4), 655–658. https://doi.org/10.1016/j.cclet.2014.01.014
- Singha, M., Lakherab, P. C., Bhutania, S., & Kumara, A. (2011). Determination of teliospore concentration as surface contaminants in karnal bunt-infected seed samples of wheat using indirect elisa. Food and Agricultural Immunology, 22(1), 77–91. https://doi.org/10.1080/09540105.2010.530248
- Tao, Z. H., Sato, M., Han, Y. L., Tan, Z. J., Yamaguchi, T., & Nakano, T. (2011). A simple and rapid method for histamine analysis in fish and fishery products by tlc determination. Food Control, 22(8), 1154–1157. https://doi.org/10.1016/j.foodcont.2010.12.014
- Tong, A. J., Dong, H., & Li, L. D. (2002). Molecular imprinting-based fluorescent chemosensor for histamine using zinc(II)–protoporphyrin as a functional monomer. Analytica Chimica Acta, 466(1), 31–37. https://doi.org/10.1016/S0003-2670(02)00471-3
- Veseli, A., Vasjari, M., Arbneshi, T., Hajrizi, A., Svorc, L., Samphao, A., & Kalcher, K. (2016). Electrochemical determination of histamine in fish sauce using heterogeneous carbon electrodes modified with rhenium(IV) oxide. Sensors and Actuators B: Chemical, 228, 774–781. https://doi.org/10.1016/j.snb.2016.01.085
- Vitali, L., Valese, A. C., Azevedo, M. S., Gonzaga, L. V., Costa, A. C. O., Piovezan, M., Vistuba, J. P., & Micke, G. A. (2013). Development of a fast and selective separation method to determine histamine in tuna fish samples using capillary zone electrophoresis. Talanta, 106, 181–185. https://doi.org/10.1016/j.talanta.2012.12.020
- Wang, L., Jia, J. T., Faheem, M., Tian, Y. Y., & Zhu, G. S. (2018). Fabrication of triazine-based porous aromatic framework (paf) membrane with structural flexibility for gas mixtures separation. Journal of Industrial and Engineering Chemistry, 67, 373–379. https://doi.org/10.1016/j.jiec.2018.07.011
- Wang, Q. H., Fang, G. Z., Liu, Y. Y., Zhang, D. D., Liu, J. M., & Wang, S. (2017). Fluorescent sensing probe for the sensitive detection of histamine based on molecular imprinting ionic liquid-modified quantum dots. Food Analytical Methods, 10(7), 2585–2592. https://doi.org/10.1007/s12161-017-0795-4
- Wang, Q. Q., Wei, H., Zhang, Z. Q., Wang, E. K., & Dong, S. J. (2018). Nanozyme: An emerging alternative to natural enzyme for biosensing and immunoassay. TrAC Trends in Analytical Chemistry, 105, 218–224. https://doi.org/10.1016/j.trac.2018.05.012
- Wang, X. M., Chen, C., Xu, L. H., Zhang, H. Y., & Xu, Z. X. (2019). Development of molecularly imprinted biomimetic immunoassay method based on quantum dot marker for detection of phthalates. Food and Agricultural Immunology, 30(1), 1007–1019. https://doi.org/10.1080/09540105.2019.1649371
- Yadav, S., Nair, S. S., Sai, V. V. R., & Satija, J. (2019). Nanomaterials based optical and electrochemical sensing of histamine: Progress and perspectives. Food Research International, 119, 99–109. https://doi.org/10.1016/j.foodres.2019.01.045
- Yang, M. H., Zhang, J. L., & Chen, X. (2015). Competitive electrochemical immunosensor for the detection of histamine based on horseradish peroxidase initiated deposition of insulating film. Journal of Electroanalytical Chemistry, 736, 88–92. https://doi.org/10.1016/j.jelechem.2014.11.002
- Ye, T., Yin, W. X., Zhu, N. X., Yuan, M., Cao, H., Yu, J. S., Gou, Z. Q., Wang, X., Zhu, H. S., Reyihanguli, A., & Xu, F. (2018). Colorimetric detection of pyrethroid metabolite by using surface molecularly imprinted polymer. Sensors and Actuators B: Chemical, 254, 417–423. https://doi.org/10.1016/j.snb.2017.07.132
- Yoshitake, T., Ichinose, F., Yoshida, H., Todoroki, K., Kehr, J., Inoue, O., Nohta, H., & Yamaguchi, M. (2010). A sensitive and selective determination method of histamine by HPLC with intramolecular excimer-forming derivatization and fluorescence detection. Biomedical Chromatography BMC, 17(8), 509–516. https://doi.org/10.1002/bmc.264
- Zhang, S. X., Sun, F. X., & Zhu, G. S. (2017). Porous aromatic framework as an efficient adsorbent in removing phenol from water. Inorganic Chemistry Communications, 85, 110–112. https://doi.org/10.1016/j.inoche.2017.08.009
- Zhang, Z. L., Niu, D. C., Li, Y. S., & Shi, J. L. (2018). Magnetic, core-shell structured and surface molecularly imprinted polymers for the rapid and selective recognition of salicylic acid from aqueous solutions. Applied Surface Science, 435, 178–186. https://doi.org/10.1016/j.apsusc.2017.11.033
- Zhao, R., Ma, T. T., Li, S. Y., Tian, Y. Y., & Zhu, G. S. (2019). Porous aromatic framework modified electrospun fiber membrane as a highly efficient and reusable adsorbent for pharmaceuticals and personal care products removal. ACS Applied Materials & Interfaces, 11(18), 16662–16673. https://doi.org/10.1021/acsami.9b04326
- Zhou, T., Fan, M., You, R. Y., Lu, Y. D., Huang, L. Q., Xu, Y. C., Feng, S. Y., Wu, Y., Shen, H. Y., & Zhu, L. J. (2020). Fabrication of fe3o4/au@atp@ag nanorod sandwich structure for sensitive sers quantitative detection of histamine. Analytica Chimica Acta, 1104, 199–206. https://doi.org/10.1016/j.aca.2020.01.017
- Zhou, Y. B., Liu, B. W., Yang, R. H., & Liu, J. W. (2017). Filling in the gaps between nanozymes and enzymes: Challenges and opportunities. Bioconjugate Chemistry, 28(12), 2903–2909. https://doi.org/10.1021/acs.bioconjchem.7b00673