
 ?Mathematical formulae have been encoded as MathML and are displayed in this HTML version using MathJax in order to improve their display. Uncheck the box to turn MathJax off. This feature requires Javascript. Click on a formula to zoom.
ABSTRACT
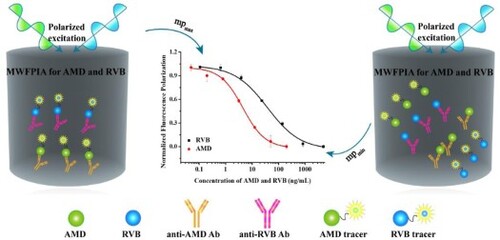
In this study, a homologous multi-wavelength fluorescence polarization immunoassays (MWFPIA) for rapid determination of amantadine (AMD) and ribavirin (RVB) simultaneously was established. The MWFPIA could quantify AMD and RVB concentration simultaneously in 1 min. After optimisation, long-wavelength tracers AEDA-AF647 with monoclonal antibody (Mab) 1A12 and RVB-CP-EDF with polyclonal antibody (Pab) G412 were chosen for the development of MWFPIA. The limit of detections (LODs) of AMD and RVB were 1.7 and 1.0 μg/kg in chickens, and 17.6 and 10.4 μg/L in human serum, respectively. Recoveries of AMD and RVB in chickens were 61.2–94.9% and 87.3–90.2%, respectively with coefficient of variations (CVs) lower than 16.7%. For human serum, recoveries were 60.2–84.3% and 63.5–74.2% for AMD and RVB, respectively, and CVs was lower than 15.3%. The results indicated that the MWFPIA could be used for the monitoring of antiviral drugs with short analysis time, great accuracy and high throughput.
GRAPHICAL ABSTRACT
Introduction
Amantadine (AMD) and AMD derivatives such as rimantadine (RMD) are widely used against influenza A virus infections due to the low cost and good stability (Belshe et al., Citation1988). While ribavirin (RVB) has been recommended as a broad-spectrum antiviral drug for the treatment of many kinds of DNA and RNA viral infection (Beaucourt & Vignuzzi, Citation2014; Sidwell et al., Citation1979; Tam et al., Citation2001). These antiviral drugs and their derivatives are widely used against for the viral infections. Meanwhile, their combinations have been used in the clinic sometimes to improve treatment (Nguyen et al., Citation2010). Moreover, these antiviral drugs may enter the human body via the food chain. What’s more, their abuse and illegal usages may increase incidences of the drug-resistant variants which constitute a potential hazard to human health and the entire ecosystem (Vitomir et al., Citation2011; Ye et al., Citation2020). Therefore, AMD and RVB are prohibited for poultry in many countries to minimise the risk. In China, AMD and RVB have been banned according to Announcement No.560 of the Ministry of Agriculture of the People’s Republic since 2005. In 2006, the Food and Drug Administration (FDA) of United States also issued an Order of Prohibition on the extra-label use of adamantanes and other antivirals in poultry (Regulation No. Citation560, Citation2005; U.S. Food and Drug Administration, Citation2006). However, many reports have indicated the illegal use of AMD and RVB still exist in the poultry industry (Shan et al., Citation2016; Wu et al., Citation2014, Citation2017). Hence, there is great demand for the development of high throughput and reliable assay methods to monitor AMD and RVB simultaneously.
There are many instrument-based methods and immunoassays for the detection of AMD or RVB, such as liquid chromatography-tandem mass spectrometry (LC–MS/MS) (Tsuruoka et al., Citation2017; Wu et al., Citation2016), high-performance liquid chromatography–tandem mass spectrometry method (HPLC-MS/MS) (You et al., Citation2017), and enzyme-linked immunosorbent assay (ELISA) (Wang et al., Citation2017, Citation2018). Up to now, all of the simultaneous detection assays of AMD and RVB are instrumental analysis methods (Table S3). Although instrument-based methods have advantages of accuracy and sensitivity, they also require expensive equipment, complex sample treatment process, and professional operators. Therefore, it is necessary to develop an efficient, high throughput and simple immunoassay. To date, heterogeneous immunoassays have been widely used for food chemical contaminants detection (Wang et al., Citation2017, Citation2018). In contrast, fluorescence polarization immunoassay (FPIA) is a kind of homogeneous immunoassays based on the changes of fluorescence polarization (FP) values, in which fluorescent labeled hapten and analyte will compete for binding with the specific antibody. In addition, FPIA has the superiority of no-wash step and time saving, which makes it an extensive method in various field (Ding et al., Citation2019; Dong et al., Citation2019). As for the multi-analyte FPIA for simultaneous detection of multiple targets has been reported (Li et al., Citation2016; Lynch et al., Citation1999; Zhang et al., Citation2018). However, no multi-analyte FPIA has been developed for simultaneous detection of AMD and RVB.
Hence, the purpose of this work was to develop a multi-analyte FPIA to realise rapid, homogeneous and simultaneous immunoassays of AMD and RVB. After optimisation studies, the established MWFPIA canbe used for high-throughput screening of large numbers of samples, which increase the detection efficiency than FPIA . After comparison with FPIAs for AMD and RVB developed separately, the sensitivity of MWFPIA is equivalent to that of the single-analyte FPIA. Consequently, the MWFPIA presented here is an efficient, easy, and sensitivite method for the simultaneous detection of AMD and RVB, and it could be used forreal sample analysis.
Material and methods
Reagents and materials
N-hydroxysuccinimide (NHS), ethidene diamine, N, N′-dicyclohexylcarbodiimide (DCC), and 4′-aminomethyl fluorescein (AMF) were obtained from Sigma-Aldrich (St. Louis, MO, USA). The analytical standards of AMD, RVB, RMD, N-(1-adamantyl) ethylenediamine (AEDA), somantadine (SMD), 2-adamantanamine, 1-adamantanemethylamine, (ADMA) were purchased from Tokyo Chemical Industry Co., Ltd. (Tokyo, Japan). Alexa Fluor® 647 cadaverine and Alexa Fluor® 647 carboxylic acid were acquired from Thermo Fisher Scientific Inc. (Waltham, MA, USA). N, N-dimethylformamide (DMF), acetonitrile, dichloromethane (CH2Cl2), ethyl acetate, and ammonium hydroxide solution were supplied from Sinopharm Chemical Reagent Co., Ltd. (Shanghai, China). The solvents and reagents used in this study were analytical grade unless otherwise specified.
The derivant of FITC, fluoresceinthiocarbamyl ethanediamine (EDF), fluoresceinthiocarbamyl butanediamine (BDF), and fluoresceinthiocarbamyl hexamethylenediamine (HDF), anti-AMD Mabs 1A12, 7G4, 3F2 and 7E2, anti-RVB Pab G412, haptens AMD-HS, RVB-HS, and RVB-CP were previously prepared by our group (Ding et al., Citation2019; Dong et al., Citation2019). Pre-coated thin layer chromatography (TLC) silica gel 60 aluminium sheetswere obtained from Qingdao Haiyang Corp (Shandong, China). Black opaque 96-well microplates with a non-binding surface were obtained from Corning Life Science (New York, NY, USA). Deionised water used for preparing all solutions was produced by Milli-Q® Integral from Millipore (Billerica, MA, USA). Spectra Max M5 was used to read the 96-well microplate obtained from Molecular Devices (Downingtown, PA, USA). Fluorescence spectrum Viewer were purchased from Thermo Fisher Scientific Inc. (Waltham, MA, USA).
Synthesis of fluorescent conjugates (Tracers)
AEDA-AF647, AMD-HS-AF647, and RVB-HS-AF647 were synthesised as the long-wavelength tracer of AMD and RVB detection. Additionally, the following tracers were generated as well: RVB-HS-AMF, RVB-HS-EDF, RVB-HS-BDF, RVB-HS-HDF, RVB-CP-AMF, RVB-CP-EDF, RVB-CP-BDF, and RVB-CP-HDF. The process of chemical synthesis is as follows.
RVB-CP was conjugated to amino-fluorescein EDF using the active ester method as follows: RVB-CP (3.0 mg) was dissolved in 200 μL of DMF. Then, 4.1 mg DDC and 2.3 mg NHS were added, and stirred in the dark at room temperature (RT) for 4 h. Later, EDF (4.0 mg) was added into the mixture and reacted overnight. Finally, 50 μL of reaction mixture were separated by TLC, using CH2Cl2/methanol/ammonium hydroxide (4:1:0.1, v/v/v) as the mobile phase. As shown in Figure S2f, the main yellow band at Rf = 0.2 was scraped from the plate and extracted with 200 μLof methanol. RVB-HS-AMF (Figure S2a), RVB-HS-EDF (Figure S2b), RVB-HS-BDF (Figure S2c), RVB-HS-HDF (Figure S2d), RVB-CP-AMF (Figure S2e), RVB-CP-BDF (Figure S2g) and RVB-CP-HDF (Figure S2h) were prepared using a similar procedure (Figure S2). AMD-HS-AF647 (Figure S2j) and RVB-HS-AF647 (Figure S2k) were prepared in the same way except the DCC was changed to EDC. All of the purified tracers were kept in the dark for next use.
AEDA-AF647: AEDA (2.0 mg) was dissolved in DMF (200 μL) and conjugated to Alexa Fluor® 647 carboxylic acid (2.0 mg). Next, 15 μL triethylamine was added. Then, the mixture was reacted overnight to avoid light at RT. Finally, part of the mixture (50 μL) was purified with TCL, with the development solution ethyl acetate/methanol/ammonium hydroxide solution (5:10:0.2, v/v/v), as the mobile phase. The component was gathered and dissolved in 200 μL of methanol at Rf’s of approximately 0.6 (Figure S2i) and stored in the dark.
Antibody dilution curve
Briefly, four anti-AMD Mab and one anti-RVB Pab were serial twofold dilution using borate buffer, respectively. Additionally, all tracers were diluted with borate buffer to obtain a working solution, and the fluorescence intensity (FI) of tracers was 10 times higher than the background of borate buffer. Then, antibody dilution curves were constructed by adding 70 μL of diluted antibody solution, 70 μL of borate buffer, and 70 μL of tracers working solutions to 96-well microplates. Subsequently, the reaction mixtures were incubated for 1 min, and the FP values were measured. The optimal concentration of each Mab was calculated as the point at which 50% tracer binding occurred.
MWFPIA procedure
FP values of EDF/BDF/HDF/AMF were measured at excitation/emission/Cutoff mode was 485/530/515 nm. All the long-wavelength tracer AF647 values were measured at excitation/emission/Cutoff mode was 640/675/665 nm . MWFPIA calibration curves were obtained as follows: 70 μL of standards cocktail solution, 70 μL of tracer cocktail solution at working concentrations, and 70 μL of the working solution of optimally diluted antibodies cocktail solutions were added. After 1 min of mixing, the fluorescence of the reaction mixture was measured using the Spectra Max M5.
The sigmoidal curves were generated by plotting the FP value against the concentration of the antiviral drugs. Furthermore, the data were analysed by Origin 8.5 (OriginLab Corp., Northampton, MA, USA) using four-parameter logistic equation.
(1)
(1)
Where, A is the asymptotic maximum of OD450 values, and B is the slope. C is IC50 which is defined as the concentration of AMD or RVB that inhibited 50% of tracer binding to its specific antibody. D is the asymptotic minimum of OD450 values and X is the AMD/RVB concentration. In addition, IC20-IC80 was considered as the detectable range of the MWFPIA. Changing the analyses into their analogous and compare with the IC50, the cross-reactivity (CR) was investigated, according to the following equation:
(2)
(2)
Further, the optimal pair of the antibody and tracer were chosen from different pairs of combinations to obtain the best performance of the MWFPIA. Then, concentrations of the antibodies and tracers were selected by checkerboard titration. Other conditions, like pH, were optimized and determined by IC50 and Z′ factor (Zhang et al., Citation1999).
(3)
(3)
SDmax and SDmin represent the standard deviation of maximum and minimum values. mPmax is the maximum FP signal (tracer bound to a saturating amount of antibody), whereas mPmin represent the minimum FP signal (free tracer). Hence, mPmax − mPmin shows the detection window (δmP) in the standard curve. In this study, Z′ > 0.8 was considered the first condition to ensure the credibility of the MWFPIA, IC50 and δmP were also considered.
Sample preparation
All chicken muscle samples and human serum were provided by the Veterinary Drug Safety Inspection and Testing Center of the Ministry of Agriculture (Beijing, China). For simultaneous detection of AMD and RVB, 2.00 ± 0.01 g of chicken samples were extracted with 4 mL methanol and 36 mL 1% acetic acid (v/v) for 5 min at RT. After shaking, the mixture was centrifuged at 8000 g for 15 min. Finally, the methanol supernatant was removed and analyzed by the MWFPIA. For human serum, the sample was diluted 10 or 20 times in borate buffer prior to MWFPIA analysis, without specific pretreatment. To establish the FPIA for RVB detection, 1.00 ± 0.01 g of homogenised chicken samples was extracted with 2 mL methanol: 1% acetic acid (1:1, v/v). After swirling for 5 min and centrifugation for 15 min at 8000 g, the supernatant was removed for FPIA detection.
Results and discussion
Characterisation of tracers
It is reported that the antibody and tracer pair is a crucial factor in the MWFPIA performance (Chen et al., Citation2019; Chun et al., Citation2009; Mi et al., Citation2013). In this work, to establish a MWFPIA, three new tracers of AMD-HS-AF647, AEDA-AF647 and RVB-HS-AF467 were first synthesised using a long wavelength fluorescein AF647 ((a)). After purification by TLC, primary bands at Rf = 0.9 of AMD-HS-AF647, Rf = 0.9 of AEDA-AF647, and Rf = 0.9 of RVB-HS-AF467 were collected (Figure S2i, j, k). Binding assays between each tracer and antibody were performed, and the three tracers all induced significant increases in FP signals (δmp ranged from 155 to 310 mp) before and after saturating amounts of antibodies were added ((a)). This indicated that these tracers were synthesised successfully. Subsequently, the anti-AMD Mabs and anti-RVB Pab were diluted and mixed with a fixed concentration of tracer. The results of antibody dilution for the three tracers are presented in Table S1. The δmp (182–298 mp) of the AEDA-AF647 and AMD-HS-AF647 was sufficient for use in FPIA development, whereas δmp (75 mp) of RVB-HS-AF647 was too low for FPIA development. Thus, the two new tracers, AEDA-AF647 and AMD-HS-AF647 were further evaluated for MWFPIA development. In addition, Table S1 showed obvious higher antibody titers for AEDA-AF647 than that for AMD-HS-AF647, which indicates that hapten AEDA have higher affinities for the four Mabs.
Figure 1. Chemical structures of the tracers synthesised in this study. (a) Long-wavelength tracers of MWFPIA detection for AMD and RVB. (b) Tracers of FPIA for RVB detection. The haptens appear in blue, and fluorescein is denoted in red.
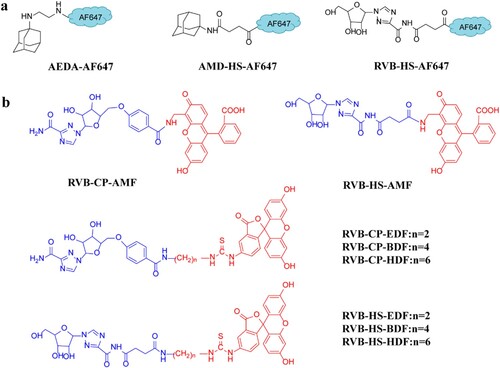
Figure 2. Characterisation of the tracers. (a) The FP values of all free long-wavelength tracers and antibody-tracers, tracers bound with 400-fold diluted antibodies. (b) The FP values of eight free RVB and antibody-tracers, tracers bound with 400-fold diluted antibody.
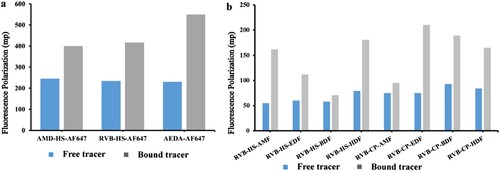
Eight RVB tracers synthesised from two hapten RVB-HS and RVB-CP with four fluorescein (AMF, EDF, BDF, and HDF) were prepared in this work ((b)). All of the tracers were purified by preparative TLC (Figure S2). As shown in (b), six tracers except RVB-HS-BDF and RVB-CP-AMF, showed sufficient binding with anti-RVB Pab G412 (δmP = 52−135 m7p), which indicated that they were successfully synthesised. In case of RVB detection, the affinity of anti-RVB Pab G412 in descending order is: RVB-CP-EDF, RVB-HS-AMF, RVB-HS-HDF, RVB-CP-BDF, RVB-CP-HDF and RVB-HS-EDF (Table S1). The results showed that the affinity of fluorescein-labeled RVB-CP tracers was slightly higher than fluorescein-labeled RVB-HS tracers when bound with Pab G412. It could be that RVB-CP was the hapten of the immunogen of the Pab (Wang et al., Citation2018), which resulted in the strongest binding ability to Pab G412 for recognised the triazole-carboxamide structure of RVB.
Optimisation of antibody-tracer pairs
Antibody and tracer pairs have significant influence on the sensitivity and specificity of FPIA (Li et al., Citation2015). To select optimal pairs of tracers and Mabs to establish the MWFPIA for AMD, the two tracers AEDA-AF647 and AMD-HS-AF647 vs Mab 1A12, 7G4, 3F2 and 7E2 were first used to establish FPIA standard curves against AMD. From Table S2, it can be concluded that the pairs AEDA-AF647 and Mab 1A12 had the lowest IC50 values (IC50 = 2.3 ng/mL), IC50/δmP ratio (0.0238), acceptable detection window (δmP = 98 mp), higher antibody dilution (1/6000) and creditable Z′ factor (Z′ = 0.85). It can be indicated that the tracer synthesised by AEDA has the highter sensitivity than AMD-HS.
For RVB detection, the RVB-HS-EDF was sifted out, for the δmP was quite low (δmP = 61) (Table S1). Thus, the other five tracers and Pab G412 were used to select the best tracer and antibody pair. Finally, according to the Table S2, the combination of RVB-CP-EDF and G412 was chosen to develop the FPIA for RVB detection, with the lowest IC50 value (23.5 ng/mL), a large detection window (δmP = 99 mp), and a Z′ factor of 0.86, which meets the requirement of Z′ > 0.8. For RVB detection, as shown in Table S2, the IC50 values obtained from the five tracers synthesised by AMF, EDF, BDF and HDF which makes difference length of linker arm indicated that a suitable length between hapten and fluorescein could increase the sensitivity of the assay. To sum up, the results clearly suggest that the sensitivity of the FPIA could be improved by careful selection of tracer and antibody pair, and both the structural features of the hapten and the length of the bridge of tracers markedly influenced the sensitivity of FPIA.
In this case, AEDA-AF647-Mab 1A12 and RVB-CP-EDF-Pab G412 were selected as the optimal antibody-tracer pairs to established the MWFPIA for AMD and RVB detection. The chemical structure of the tracer selected were confirmed by 1H NMR spectrometry (Figure S3).
Development and optimisation of the MWFPIA
In this study, standard curves were established to find out the working concentration of antibodies and tracers. The Z′ value, IC50 and δmP were used as the primary criteria to evaluate the immunoassay performance. For RVB detection, as shown in (a), when the FI value of RVB-CP-EDF varied (30, 40 and 50), there were no obvious changes in the IC50 and δmP values. However, when the FI value of RVB-CP-EDF was 60, δmP values dramatically decreased (δmP = 50 mp), which did not provide a good assay window for measurement. Therefore, the FI value of 40 was selected for the working solution for RVB-CP-EDF, because it has the lowest IC50/δmP (0.2399). Besides, the 1/200, 1/300, 1/400 and 1/500 antibody dilutions were selected to optimised and established a standard curve. (b) indicats that 1:400 dilution of G412 was the optimal antibody dilution based on the lowest IC50/δmP value (0.1843).
Figure 3. The effect of physicochemical factors on the analytical characteristics of the FPIA and MWFPIA. FPIA for detection of RVB. (a) Optimising of the concentration of tracer. (b) Optimising of the antibody titer. (c) Optimising of the pH values. (d) Effect of methanol. (e) Effect of acetonitrile on FPIA method. (f) Optimising of the Mab 1A12 titer in MWFPIA.
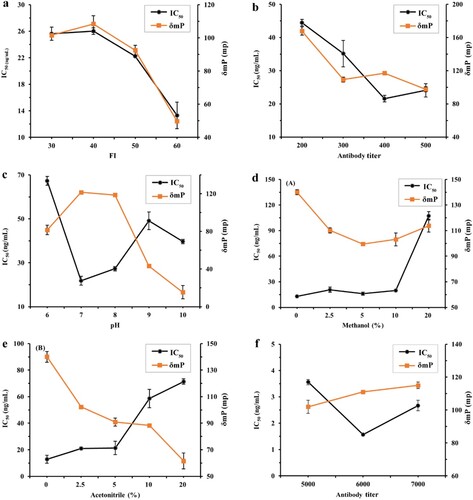
To evaluate the influence of pH on the FPIA, borate buffers with pH values of 6.0, 7.0, 8.0, 9.0, and 10.0 were prepared. In the case of RVB, as shown in (c), the assay performed optimally at pH 7.0, with the lowest IC50 values (21.8 ng/mL) and highest δmP (122 mp). The results from the pH experiment demonstrate that slight differences in buffer pH would severely affect the FPIA performance. We thought that both selection of optimal antibody and tracers as well as optimisation of pH contributed to the high sensitivity and potential accuracy of a FPIA for the detection of RVB. Several different concentrations of organic solvent were diluted to figure out the effects of methanol and acetonitrile on FPIA detection. For single-analyte FPIA of RVB, 10% methanol could be tolerated whereas 10% acetonitrile caused a considerable decrease in δmP and sensitivity ((d) and (e)).
In addition, at a fixed amount of AEDA-AF647, Mab 1A12 dilutions that yielded 50%, 60%, and 70% binding with the tracer according to the antibody dilution curve, were 1/5000, 1/6000 and 1/7000, respectively. As shown in (f), the lowest IC50 value (1.6 ng/mL) and IC50/δmP ratio (0.0141) was obtained forantibody dilutions of 1/6000.
When an MWFPIA incorporates two distinct fluorescence signals, it is important that thesignals derived from the fluorescence dyes do not significantly interfere with each other (Blommel et al., Citation2004). The FI values of borate buffer, AEDA-AF647, RVB-CP-EDF, and the tracer cocktail were measured under two excitation/emission/cutoff modes (485/530/515 and 640/675/665 nm). As shown in (a), when the excitation/emission/Cutoff mode was 485/530/515 nm, the FI of the four solutions was 4.5, 4.5, 35, and 35, respectively. When excitation/emission/cutoff mode of 640/675/665 nm, the FI of the four solutions was 3.2, 30, 3.7, and 32, respectively. The results reveal that the fluorescence of the mixture at one excitation/emission/cutoff mode was primarily produced by the corresponding tracer and the interfere between the two tracers with different excitation/emission wavelengths was negligible. As shown in (b), the interference between EDF and AF647 was negligible as the excitation and emission peaks of two fluorescent dyes is not coincide as shown by Fluorescence Spectra Viewer.
Figure 4. The study of the fluorescence interference. (a) FI of borate buffer and tracers under different excitation and emission wavelengths. (b) Comparison of the excitation and emission spectra of two fluorescent dyes (green-EDF, red-AF647). Standard curves of AMD and RVB in single format and multiple format assays. (c) Standard curves for AMD, RVB and mixed analytes in multiple formats under 485/530/515 nm. (d) Standard curves for AMD, RVB and mixed analytes in multiple formats under 640/675/665 nm.
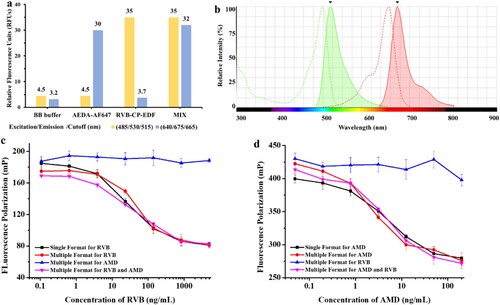
Nonspecific binding between the tracers and the antibodies in the cocktail solution may exist. Therefore, appropriate binding checking should be investigated by comparing the FP signal for different models between different tracers and antibodies. According to the comparsion of the δmP changes in the single-analyses and double analysis system, the results () show that increases in FP were mainly produced by the binding of each tracer to its corresponding antibody. Accordingly, the antibody mixture did not exhibit nonspecific binding with the tracer cocktail mixture in this double-format system. In a word, the nonspecific binding of tracers and antibodies cocktail mixture in the MWFPIA for AMD and RVB detection is negligible.
Table 1. Signal of FP for different assay formats between different tracers and antibodies (mP).
Inhibition testing should be carried out to confirm the decrease in FP values under the two excitation/emission/cutoff modes mainly caused by one intended target. Thus, standard curves for AMD, RVB and mixed analytes in multiple formats under different measurement wavelengths were established. The results shown in (c), at 485/530/515 nm, reveal that the AMD standard cannot compete with its RVB tracer in the cocktail at 485/530/515 nm. In addition, the sigmoidal curves of RVB in single-analyte FPIA are the same as the sigmoidal curves of the multiple format assay for RVB and the multiple format assay for RVB and AMD mixture, which were almost superimposable. Similarly, at 640/675/665 nm, similar results were observed ((d)). These results demonstrated that the mixture of two tracers and two antibodies did not interfere with each other. Therefore, tracer and antibody cocktails could be used in the MWFPIA for the simultaneous screening of AMD and RVB in a single well.
Using the optimised conditions, standard curves of AMD and RVB were established for the MWFPIA at two different measurement wavelengths ((a)). The IC50 of AMD in MWFPIA is four times higher than FPIA (unpublished date) (IC50 increasing from 1.0 to 4.4 ng/mL), whereas the IC50 of RVB is two times higher than FPIA (IC50 increasing 16.7 to 37.7 ng/mL). Although the sensitivity of the MWFPIA was affected slightly, the MWFPIA can still meet the current demand for the detection of the two analytes. The specificity of MWFPIA was evaluated under the optimised conditions and the obtained IC50 values were used to calculate the CRs. In the MWFPIA, as the results are shown in , five AMD structural analogues RMD, AEDA, SMD, ADMA and 2-adamantanamine hydrochloride shown high CRs (72%–127%) with AMD in the established MWFPIA.
Figure 5. Standard curves of AMD and RVB by MWFPIA. (a) Normalised FP standard curves for AMD and RVB in multiple format FPIA. (b) Standard curves of AMD in borate buffer and serum with different dilution. (c) Standard curves of RVB in borate buffer and serum with different dilution. (d) Normalised standard curve of RVB in borate buffer and 20-fold diluted serum.
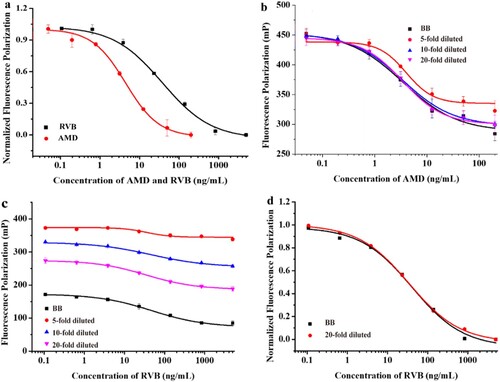
Table 2. IC50 and structure of AMD derivatives for the MWFPIA method.
MWFPIA for AMD and RVB detection in human serum and chicken
To study the possible matrix effect, the newly-developed MWFPIA was applied for simultaneous detection of AMD and RVB in two different samples, chicken muscle and human serum. In the case of human serum, the matrix effects were eliminated by 10-fold dilutions with borate buffer for AMD analysis ((b)). Additionally , RVB analysis was significantly affected by the matrix effects in human serum, and the matrix effects could not be completely eliminated even by 20-fold dilution ((c)). However, standard curves for RVB produced in human serum with 20-fold dilution and in borate buffer presented on trends in consistency. The data were normalised according to a previous publication, (Maragos et al., Citation2001) the matrix effect was successfully reduced, and two normalised calibration curves in borate buffer and human serum with 20-fold dilution were superimposed ((d)). The calculated LODs were 17.6 μg/L for AMD and 10.4 μg/L for RVB in human serum matrix, and the detection ranges were 23.0–343.2 and 104.2–5470.6 μg/L for AMD and RVB, respectively. The recoveries were 60.2%–84.3% and 63.5%–74.2%, respectively, with CVs lower than 15.3% for AMD and RVB ().
Table 3. Recoveries and CVs of spiked blank samples (n = 3).
Further, the methanol and 1% acetic acid solution was successfully used for protein precipitation to determine AMD and RVB in chicken by single-analyte FPIA. In MWFPIA, the LODs of AMD and RVB in chicken samples were 1.7 and 1.0 μg/kg, and the detection ranges were 2.3–34.3 and 10.4–547.1 μg/kg, respectively. The recoveries were 61.2–94.9% and 87.3–90.2%, respectively, and the CVs was less than16.7% (). We summarised the LODs recently reported for instrumental methods of simultaneous detection AMD and RVB in the literature, as shown in Table S3.Although the detection capability of the MWFPIA in real samples was inferior to those instrumental analysis methods, as a homogeneous immunoassay, the MWFPIA has the advantages of simple operation , time-saving and high throughput screening of a large number of samples. Therefore, the MWFPIA could be applied to control AMD and RVB in chicken muscle and human serum.
Table 4. Comparison of the FPIA and MWFPIA for AMD and RVB detection in chicken.
Conclusion
In summary, a simple, rapid, and high-throughput MWFPIA for AMD and RVB detection in real samples was developed for the first time. The MWFPIA provids high throughput, high efficiency, and short analysis time from the design of multi-wavelength fluorescence signals. The results indicate that the MWFPIA could be used to monitor antiviral drugs rapidly and with high accuracy. The multiplexing strategy described in this article can be easily expanded to detect other contaminants by replacing the targets of interest.
Credit authorship contribution statement
Liuchuan Guo: Methodology, Validation, Writing – original draft, Data curation. Meixuan Liu: Methodology, Data curation. Suxia Zhang, Zhanhui Wang: Writing – review & editing. Xuezhi Yu: Writing – review & editing, Methodology, Supervision
Disclosure statement
No potential conflict of interest was reported by the author(s).
Correction Statement
This article has been republished with minor changes. These changes do not impact the academic content of the article
Additional information
Funding
References
- Beaucourt, S., & Vignuzzi, M. (2014). Ribavirin: A drug active against many viruses with multiple effects on virus replication and propagation. Molecular basis of ribavirin resistance. Current Opinion in Virology, 8, 10–15. https://doi.org/10.1016/j.coviro.2014.04.011
- Belshe, R. B., Smith, M. H., Hall, C. B., Betts, R., & Hay, A. J. (1988). Genetic basis of resistance to rimantadine emerging during treatment of influenza virus infection. Journal of Virology, 62(5), 1508–1512. https://doi.org/10.1128/JVI.62.5.1508-1512.1988
- Blommel, P., George, T. H., & Kurt, W. V. (2004). Multiplexing fluorescence polarization assays to increase information content per screen: Applications for screening steroid hormone receptors. Journal of Biomolecular Screening, 9(4), 294–302. https://doi.org/10.1177/1087057104264420
- Chen, Y., He, Q., Shen, D., Jiang, Z., Eremin, S. A., & Zhao, S. (2019). Fluorescence polarization immunoassay based on a new monoclonal antibody for the detection of the diisobutyl phthalate in yoghurt. Food Control, 105, 38–44. https://doi.org/10.1021/jf025801v
- Chun, H. S., Choi, E. H., Chang, H. J., Choi, S. W., & Eremin, S. A. (2009). A fluorescence polarization immunoassay for the detection of zearalenone in corn. Analytica Chimica Acta, 639(1–2), 83–89. https://doi.org/10.1016/j.aca.2009.02.048
- Ding, Y., Chen, H., Yang, Q., Feng, L., Hua, X., & Wang, M. (2019). A fluorescence polarization immunoassay for detection of thiacloprid in environmental and agricultural samples. RSC Advances, 9(63), 36825–36830. https://doi.org/10.1039/c9ra04776j
- Dong, B., Zhao, S., Li, H., Wen, K., Ke, Y., Shen, J., Zhang, S., Shi, W., & Wang, Z. (2019). Design, synthesis and characterization of tracers and development of a fluorescence polarization immunoassay for the rapid detection of ractopamine in pork. Food Chemistry, 271, 9–17. https://doi.org/10.1016/j.foodchem.2018.07.147
- Li, C., Mi, T., Conti, G. O., Yu, Q., Wen, K., Shen, J., Ferrante, M., & Wang, Z. (2015). Development of a screening fluorescence polarization immunoassay for the simultaneous detection of fumonisins b1 and b2 in maize. Journal of Agricultural & Food Chemistry, 63(20), 4940–4946. https://doi.org/10.1021/acs.jafc.5b01845
- Li, C., Wen, K., Mi, T., Zhang, X., Zhang, H., Zhang, S., Shen, J., Wang, Z. (2016). A universal multi-wavelength fluorescence polarization immunoassay for multiplexed detection of mycotoxins in maize. Biosensors and Bioelectronics, 79, 258–265. https://doi.org/10.1016/j.bios.2015.12.033
- Lynch, B. A., Minor, C., Loiacono, K. A., Schravendijk, M., Ram, M. K., Sundaramoorthi, R., Adams, S. E., Phillips, T., Holt, D., Rickles, R. J., & MacNeil, I. A. (1999). Simultaneous assay of src sh3 and sh2 domain binding using different wavelength fluorescence polarization probes. Analytical Biochemistry, 275(1), 62–73. https://doi.org/10.1006/abio.1999.4305
- Maragos, C. M., Jolley, M. E., Plattner, R. D., & Nasir, M. S. (2001). Fluorescence polarization as a means for determination of fumonisins in maize. Journal of Agricultural and Food Chemistry, 49(2), 596–602. http://europepmc.org/article/MED/11261998. https://doi.org/10.1021/jf0010782
- Mi, T., Wang, Z., Eremin, S. A., Shen, J., & Zhang, S. (2013). Simultaneous determination of multiple (fluoro)quinolone antibiotics in food samples by a one-step fluorescence polarization immunoassay. Journal of Agricultural & Food Chemistry, 61(39), 9347–9355. https://doi.org/10.1021/jf403972r
- Nguyen, J. T., Hoopes, J. D., Le, M. H., Smee, D. F., Patick, A. K., Faix, D. J., Blair, P. J., de Jong, M. D., Prichard, M. N., Went, G. T., & Klein, R. (2010). Triple combination of amantadine, ribavirin, and oseltamivir is highly active and synergistic against drug resistant influenza virus strains in vitro. PLoS ONE, 5(2), e9332, 1–11. https://doi.org/10.1371/journal.pone.0009332
- Regulation No. 560. (2005). Ministry of Agriculture and Rural affairs of the People’s Republic of China. http://jiuban.moa.gov.cn/zwllm/tzgg/gg/200511/t20051117_496523.htm.
- Shan, W. F., Gong, A., Mei, G. S., WenJia, X., & DengYong, L. (2016). Progress on metabolic regularity and detection technique of ribavirin in livestock and poultry. Journal of Food Safety & Quality, 7, 3966–3972. http://en.cnki.com.cn/Article_en/CJFDTOTAL-SPAJ201610020.htm.
- Sidwell, R. W., Robins, R. K., & Hillyard, I. W. (1979). Ribavirin: An antiviral agent. Pharmacology & Therapeutics, 6(1), 123–146. https://doi.org/10.1016/0163-7258(79)90058-5
- Tam, R. C., Lau, J., & Hong, Z. (2001). Mechanisms of action of ribavirin in antiviral therapies. Antiviral Chemistry and Chemotherapy, 12(5), 261–272. https://doi.org/10.1177/095632020101200501
- Tsuruoka, Y., Nakajima, T., Kanda, M., Hayashi, H., Matsushima, Y., Yoshikawa, S., Nagata, M., Koike, H., Nagano, C., Sekimura, K., Hashimoto, T., Takano, I., & Shindo, T. (2017). Simultaneous determination of amantadine, rimantadine, and memantine in processed products, chicken tissues, and eggs by liquid chromatography with tandem mass spectrometry. Journal of Chromatography B, 1044–1045, 142–148. https://doi.org/10.1016/j.jchromb.2017.01.014
- U.S. Food and Drug Administration. (2006). FDA prohibits use of antiviral drugs in poultry to help keep drugs effective for humans. http://www.fda.gov/NewsEvents/Newsroom/PressAnnouncements/ 2006/ucm108620.htm.
- Vitomir, C., Silva, D., Biljana, A., & Sanja, C. (2011). The significance of rational use of drugs in veterinary medicine for food safety. Meat Technology, 52(1), 74–79. https://agris.fao.org/agris-search/search.do?recordID=RS2011002905.
- Wang, Z., Wen, K., Zhang, X., Li, X., Wang, Z., Shen, J., & Ding, S. (2017). New hapten synthesis, antibody production, and indirect competitive enzyme-linked immnunosorbent assay for amantadine in chicken muscle. Food Analytical Methods, 11(1), 302–308. https://doi.org/10.1007/s12161-017-1000-5
- Wang, Z., Yu, X., Ma, L., Liu, H., Ding, S., Wang, Z., Zhang, X., Shen, J., & Wen, K. (2018). Preparation of high affinity antibody for ribavirin with new haptens and residue analysis in chicken muscle, eggs and duck muscle. Food Additives & Contaminants, Part A. Chemistry, Analysis, Control, Exposure & Risk Assessment, 35(7), 1247–1256. https://doi.org/10.1080/19440049.2018.1447693
- Wu, Y. L., Chen, R. X., Xue, Y., Yang, T., Zhao, J., & Zhu, Y. (2014). Simultaneous determination of amantadine, rimantadine and memantine in chicken muscle using multi-walled carbon nanotubes as a reversed-dispersive solid phase extraction sorbent. Journal of Chromatography B, 965, 197–205. https://doi.org/10.1016/j.jchromb.2014.06.038
- Wu, Y. L., Chen, R. X., Zhu, L., Lv, Y., Zhu, Y., & Zhao, J. (2016). Determination of ribavirin in chicken muscle by quick, easy, cheap, effective, rugged and safe method and liquid chromatography-tandem mass spectrometry. Journal of Chromatography B, 1012-1013, 55–60. https://doi.org/10.1016/j.jchromb.2016.01.016
- Wu, S., Zhu, F., Hu, L., Xi, J., Xu, G., Liu, D., Guo, Q., Luo, K., & Lai, W. (2017). Development of a competitive immunochromatographic assay for the sensitive detection of amantadine in chicken muscle. Food Chemistry, 232, 770–776. https://doi.org/10.1016/j.foodchem.2017.04.058
- Ye, D., Bao, Z., Yu, Y., Han, Z., Yu, Y., Xu, Z., Ma, W., Yuan, Y., Zhang, L., Xu, Y., Ma, T., Liu, S., Gao, X., Yan, G., Huang, Q., Wang, X., Hua, B., Yang, F., Li, Y., … Cai, B. (2020). Inhibition of cardiomyocyte differentiation of human induced pluripotent stem cells by ribavirin: Implication for its cardiac developmental toxicity. Toxicology, 435(152422), 1–11. https://doi.org/10.1016/j.tox.2020.152422.
- You, X., Yang, S., Zhao, J., Zhang, Y., Zhao L., Cheng Y., Hou C., & Xu, Z. (2017). Study on the abuse of amantadine in tissues of broiler chickens by HPLC-MS/MS. Journal of Veterinary Pharmacology & Therapeutics, 40(5), 539–544. https://doi.org/10.1111/jvp.12388
- Zhang, J. H., Chung, T., & Oldenburg, K. R. (1999). A simple statistical parameter for use in evaluation and validation of high throughput screening assays. Journal of Biomolecular Screening, 4(2), 67–73. http://europepmc.org/article/MED/10838414. https://doi.org/10.1177/108705719900400206
- Zhang, X., Tang, Q., Mi, T., Zhao, S., Wen, K., Guo, L., Mi, J., Zhang, S., Shi, W., Shen, J., Ke, Y., & Wang, Z. (2018). Dual-wavelength fluorescence polarization immunoassay to increase information content per screen: Applications for simultaneous detection of total aflatoxins and family zearalenones in maize. Food Control, 87, 100–108. https://doi.org/10.1016/j.foodcont.2017.12.002