
 ?Mathematical formulae have been encoded as MathML and are displayed in this HTML version using MathJax in order to improve their display. Uncheck the box to turn MathJax off. This feature requires Javascript. Click on a formula to zoom.
ABSTRACT
Amantadine (AMD) is harmful to human health and has been forbidden as an antiviral drug in the livestock and poultry breeding. Thus, a rapid and sensitive detection method for AMD should be established. In this research, we have designed three kinds of haptens and then prepared three kinds of immunogens and coating antigens. A highly sensitive colloidal gold immunochromatographic assay (CG-ICA) for AMD detection by using heterologous coating antigen and mAb prepared with immunogen adding five carbons linker has been established. Under optimal conditions, the cut-off value of the CG-ICA was 2.5 ng/mL by naked eyes. The CG-ICA presented a good signal response to AMD in the concentration range of 0.1–2.5 ng/mL with low LOD at 0.077 ng/mL. These results indicated that the immunogen with carbon linker may obtain high-affinity antibody while the heterologous coating antigen may improve the sensitivity of ICA.
1. Introduction
Amantadine (AMD) is a stable tricyclic amine compound that can be used to treat influenza in animals and humans (Chew et al., Citation2008; Dong et al., Citation2019). However, the abuse of AMD causes severe consequences to human health, such as dizziness, palpitation, and drug resistance (He et al., Citation2008). Considering these concerns, AMD has been forbidden as an antiviral drug in the livestock and poultry breeding in China and USA since 2005 and 2006, respectively (Peng et al., Citation2017a). Therefore, a simple, rapid, specific, inexpensive, and sensitive method should be developed to detect AMD (Wu et al., Citation2017a) for improving food safety (Wu et al., Citation2017b).
To date, a series of analytical strategies based on chromatography-mass spectrometry (Farajzadeh et al., Citation2013; Yan et al., Citation2013) and immunoassay (Xie et al., Citation2018) have been developed to detect AMD in various animal food products (Hao et al., Citation2016). The chromatography-mass spectrometry is the most widely used method for AMD detection (Shuangjin et al., Citation2007). However, the detection method needs expensive analytical instruments and requires cumbersome pretreatment processes to remove the macromolecule interference in complex food samples (Zhu et al., Citation2018). Besides, the method does not allow a rapid on-site detection. Immunoassays, including enzyme-linked immunosorbent assay (ELISA) and colloidal gold immunochromatographic assay (CG-ICA) are sensitive, rapid, convenient, specific, and suitable for on-site detection (Wang et al., Citation2017b; Wu et al., Citation2017a). Xu et al. (Xu et al., Citation2016) have reported a hapten that exposed the amino group of AMD to animals’ immune systems and produced monoclonal antibody (mAb). The half maximal inhibitory concentration (IC50) for AMD was 1.92 ng/mL by using indirect competitive ELISA (ic-ELISA). Peng et al. (Peng et al., Citation2017a) have reported a hapten by coupling the amine group with succinic anhydride and obtained mAb with IC50 at 15.4 ng/mL for AMD. Because AMD had been forbidden in the livestock and poultry breeding, rapid and more sensitive method was urgently needed.
In this study, we have designed three haptens and prepared three hapten conjugations. By immunizing mice with hapten conjugation we obtained high-affinity antibody. With the heterologous coating antigen, high inhibition ratio of assays was achieved in ic-ELISA. On the basis of the high-affinity mAb and heterologous coating antigen, we have developed rapid and sensitive CG-ICA, which can be used to detect AMD in edible chicken tissue.
2. Materials and methods
2.1. Reagents and apparatus
AMD, bovine serum albumin (BSA), Freund’s complete and incomplete adjuvants, ovalbumin (OVA), polyethylene glycol, HAuCl4·3H2O, rimantadine, 1-adamantane carboxylic acid, ribavirin, paracetamol, danofloxacin, olaquindox, and 1-trisodium citrate were purchased from Sigma Chemical Company (Sigma, St. Louis, MO, USA). N, N-Dimethylformamide (DMF), carbodiimide (EDC), N-hydroxysuccinimide (NHS), Tween-20, 3, 3′, 5, 5′-tetramethylbenzidine (TMB), and ethyl 6-bromohexanoate were obtained from J&K (Shanghai, China). The HRP-goat anti-mouse IgG was obtained from ZSGB-BIO (Beijing, China). The goat anti-mouse IgG was purchased from Wuxi Zodoboer Biotech Co. Ltd. (Wuxi, China). The HAT medium was purchased from thermo fisher (NY, USA). The sample pad, conjugate pad, nitrocellulose (NC) membrane, and absorbent pad were purchased from Millipore Inc. (Bedford, MA). The HG-8 strip reader was purchased from Skannex Biotech Co. Ltd. (Oslo, Norway). The BioDot XYZ Platform with motion control was purchased from BioDot (Irvine, CA, USA).
The buffer solutions used in this study were assay buffer (0.01 M phosphate-buffered saline (PBS), pH 7.4), washing buffer (PBS containing 0.05% [v/v] Tween-20), coating buffer (50 mM carbonate solution (CBS), pH 9.6), blocking buffer (CBS with 0.2% gelatin), solution A (9.33 g citric acid, 36.8 g Na2HPO4, and 180 μL H2O2 (30%) in 1 L water), solution B (0.06% [v/v] TMB in glycol), and stop solution (2 M H2SO4).
2.2. Preparation of immunogens and coating antigens
The International Union of Pure and Applied Chemistry name of AMD was tricyclo [3.3.1.13,7] decan-1-aminehydrochloride (Figure S1). Haptens with a reactive carboxylic acid group were conjugated to proteins by using the sulfo-NHS method. The hapten 1 was prepared by introducing n-hexylic acid into the amino of AMD. The haptens 2 and 3 were prepared by introducing propionic and n-hexylic acids into the C-5 of AMD, respectively. The three haptens were conjugated to BSA to prepare immunogens (H1-BSA, H2-BSA, and H3-BSA). The three haptens were conjugated to OVA as coating antigens (H1-OVA, H2-OVA, and H3-OVA). The conjugation protocols were detailed in the Figure S2.
2.3. Immunization and production of mAb
Figure S3(A) was the principle of preparing the monoclonal antibody. Fifteen female BALB/c mice (six weeks of age) were subcutaneously immunized at multiple sites on the back with 100 µg immunogens (H1-BSA, H2-BSA, and H3-BSA) mixed with complete Freund’s adjuvant (Wang et al., Citation2017a). Subsequently, mice were immunized every month with 50 μg immunogens mixed with incomplete Freund’s adjuvant. Seven days after the fifth immunization, the tail blood was collected and analyzed using the ic-ELISA to assess the antibody titre and inhibition ratio. Finally, the splenocytes (Cao et al., Citation2014) from the mouse with high titre and inhibition ratio tail blood were fused with SP 2/0 myeloma cells and cultured in the HAT medium. The culture supernatants were detected using the ic-ELISA (Qian et al., Citation2009). The hybridomas that produced antibody-recognizing AMD were subcloned four times by using the limiting dilution method. Finally, the subcloned hybridomas were collected and used for production of ascites. Ascites were purified using the n-caprylic acid method (Chen et al., Citation2014), and antibodies were evaluated using the ic-ELISA.
2.4. ic-ELISA
The ELISA for AMD detection was carried out as described previously (Yuan et al., Citation2020). Figure S3(B) was the principle of ic-ELISA. The 96-well microplates were first coated with 100 μL of coating antigen diluted in the coating buffer and subsequently incubated at 37°C for 2 h. After washing thrice with the washing buffer, each well was blocked with 260 μL of blocking buffer for 2 h at 37°C. Following another washing step, 50 μL of a serially diluted AMD standard solution and 50 μL of anti-AMD mAb were added to each well. Microplates were incubated at 37°C for 30 min. The microplates were washed four times, and each well was added with 100 μL of HRP-labeled goat anti-mouse IgG and incubated for 30 min at 37°C. The microplates were washed four times and added with 100 μL of TMB substrate to react for 15 min at 37°C. Subsequently, the enzymatic reaction was stopped with 2 M H2SO4 (50 μL) per well. Finally, results were obtained at 450 nm with a microplate reader (OD450). Each test was replicated thrice.
2.5. Specificity of the mAb
The specificity of the mAb was evaluated by using other drugs as competitors. Rimantadine, 1-adamantane carboxylic acid, ribavirin, paracetamol, danofloxacin, and olaquindox were detected at concentrations of 0–100 ng/mL. The obtained IC50 values were used to calculate the cross-reactivity (CR) as follows (Wang et al., Citation2013b):
2.6. CG-ICA
2.6.1. Preparation of colloidal gold
Colloidal gold nanoparticles (AuNPs) with an average diameter of 40 nm were prepared as previously described (Chen et al., Citation2015). In brief, 1 mL of HAuCl4 stock solution (1% [w/v]) was added to 99 mL ultrapure water and heated until boiling. With continuous stirring, 1.35 mL of trisodium citrate (1% [w/v]) was added. The solution turned red in 2 min. The red solution was boiled for another 15 min and cooled to room temperature (RT) for further use.
2.6.2. Preparation of CG conjugation mAb
In this procedure, the pH of the 10 mL colloidal gold solution was adjusted to 7.0 by using 0.2 M K2CO3. The solution with 1 mL of anti-AMD mAb solution was added dropwise, incubated at RT for 1 h with gentle shaking, added with 1% (w/v) PEG 20000 solution (1 mL), stirred for 30 min, added with 10% (w/v) BSA (1 mL), and stirred for 30 min to block the unoccupied surfaces on the AuNPs. The mixture was centrifuged at 4°C for 30 min (8000 rpm), and the pellet was resuspended in 1 mL of PBS containing 5% sucrose, 2% trehalose, 1% PEG 20 000, 1% BSA, and 0.25% Tween-20.
2.6.3. Development of the CG-ICA
The CG-ICA was developed to detect AMD. The test strip consisted of sample pad, NC membrane, and absorbent pad (Huang & Kim, Citation2011; Luo et al., Citation2017). The sample pad was pretreated with 50 mM borate buffer (pH 7.4) containing 1% BSA, 0.5% Tween-20, and 0.05% sodium azide and dried at 60°C for 2 h. The H2-OVA and the goat anti-mouse antibody (0.5 mg/mL) were sprayed onto the NC membrane by using Biodot at 0.74 mL/cm to form the test line (T line) and the control line (C line), respectively, and dried at 37°C for 6 h. The sample pad, NC membrane, and absorbent pad were assembled on the PVC pad as the test strip.
2.6.4. Principle of the CG-ICA
The principle of the test strip was shown in Figure S3(C). The PBS (100 μL) and AuNPs-mAb (3 μL) were mixed in the microplate well and incubated for 3 min, and then added into sample pad. The AuNPs-mAb could be captured by H2-OVA on the T line and the goat anti-mouse IgG on the C line, appearing in two red bands. For positive samples, the limited binding site on the AuNPs-mAb were occupied by target analytes in the samples (over cut-off value). Therefore, the AuNPs-mAb could not be captured by H2-OVA on the T line, resulting in no colour on the T line. The CG-ICA strip was scanned using the strip reader and to record the absorbance values of the T (AT) and the C (AC) lines.
2.7. Optimization of key parameters
Different pH (5.5, 6.0, 6.5, 7.0, 7.5, and 8.0) of colloidal gold solutions were adjusted by adding 0.2 M K2CO3 before labelling with anti-AMD mAb. The AuNPs-mAb probe was prepared with different concentrations of anti-AMD mAb solutions (0.25, 0.5, 1.0, 1.5, 2.0, and 3.0 μg/mL). Different H2-OVA concentrations (0.1, 0.2, 0.3, 0.4, 0.5, and 0.6 mg/mL) were studied. The determination of optimal pH, anti-AMD mAb concentration, and the H2-OVA concentration on the T line were based on the signal intensity on the T line of the negative sample (PBS) and the competitive inhibition ratio of the positive sample (AMD, 1 ng/mL). The competitive inhibition ratio was obtained using the following equation:
B0 and B are the AT/AC of the negative and the positive samples, respectively.
2.8. Immunological kinetic analysis of the CG-ICA
In this procedure, 100 μL of PBS and 3 μL of AuNPs-mAb were mixed in the microplate well and incubated for 3 min, and then added into sample pad. After 2 min, the signal intensities of the T line and the C line were recorded with colloidal gold portable test strip readers every 2 min for 50 min. Kinetic curves were constructed by plotting the signal intensities of the T line and AT/AC against time.
2.9. Sample preparation
Negative chicken samples were obtained from Jiangxi Veterinary Medicine and Feed Supervision Institute (Nanchang, Jiangxi). Homogenized chicken samples (5.0 g ± 0.02 g) were weighed in a 50 mL centrifuge tube, spiked with AMD standards (0.5, 1.0, and 2.5 µg/kg), and vortexed for 30 s. The solutions were added with 3 g Na2SO4, mixed with 10 mL of acetonitrile acetate (1%), vortexed for 3 min, and centrifuged for 5 min at 8000 rpm. The upper phase (5 mL) was collected, dried with nitrogen at 50°C, and added with 1 mL of hexane and 0.5 mL of PBS. The aqueous phase was used for CG-ICA (Chen et al., Citation2011). The inter-day coefficient of variation (CV) was determined on seven replicates, and the intra-day CV was determined on four consecutive days.
2.10. Establishment of standard curves
A series of AMD solutions was prepared by spiking the AMD standard solutions at 0, 0.01, 0.05, 0.1, 0.25, 0.5, 1, 2.5, 5, 10, 25, 50, and 100 ng/mL. The standard solution (100 μL) and 3 μL of AuNPs-mAb were mixed in the microplate well and incubated for 3 min. The mixture was added into the immunochromatographic test strip and then scanned with the strip reader. The ratio of AT and AC was used in the quantitative calculation of the AMD concentration. Standard curves were established by plotting the logarithm of B/B0 against the logarithm of the AMD concentration. The limit of detection (LOD) was calculated as the mean value of the negative samples plus the threefold standard deviation(Peng et al., Citation2017b). Each concentration was analyzed in three replicates.
3. Results and discussion
3.1. Synthesis of the AMD hapten and the conjugated antigen
The design of a desirable hapten is the key step for antibody production (Wang et al., Citation2013a). The AMD is a small molecule that does not elicit an immune response by itself. Thus, the AMD was conjugated to a carrier protein in a particular orientation to expose the key functional groups of the target molecule effectively. It is better for producing antibodies with immunogens that add linker arm of carbon atoms between small molecule and carrier protein (Lee et al., Citation1998). The linker arm of 2–5 carbon atoms (Vasylieva et al., Citation2015) was generally accepted as the most efficient distance of the hapten from the carrier protein. In this study, three haptens were designed with different structures for conjugating with the carrier protein ((A)). The hapten 1 was prepared by introducing n-hexylic acid into the amino of AMD. The hapten 2 and hapten 3 were prepared by introducing propionic and n-hexylic acids into the C-5 of AMD and characterized with H1-NMR (Figure S(4)).
Figure 1. The OD value and inhibition ratio of ic-ELISA with three coating antigens and three antibodies from three immunogens. (A) The synthesis of haptens, hapten-conjugations and the process of immunizing mice. (B) The OD value and inhibition ratio were evaluated using the ic-ELISA.
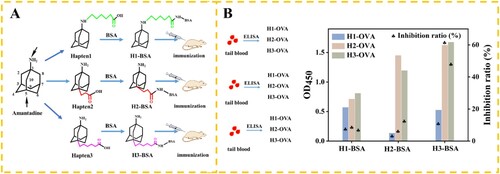
3.2. Systematical study of ic-ELISA with three antibodies and coating antigens
The AMD-BSAs (H1-BSA, H2-BSA, and H3-BSA) were used to immunize the mice for mAb production, whereas the AMD-OVAs (H1-OVA, H2-OVA, and H3-OVA) were used as the coating antigen ((B)). The seventh day after the third immunization, the OD450 and inhibition ratio were evaluated using the ic-ELISA (Liu et al., Citation2012) (). The competitive inhibition ratio was obtained by 1-B/B0 (B was the OD450 of negative sample (1×PBS), B0 was the OD450 of positive sample (100 ng/mL)). When H1-BSA was used as immunogen, the OD450 of negative samples was low (0.572, 0.714, and 0.812) no matter which coating antigen was used. With the immunogen by introducing n-hexylic acid into the amino of AMD, a low affinitive antibody was prepared. We thought that the amino group was an important group for preparing amantadine antibody. When H2-BSA and H3-BSA were used as immunogen, the OD450 improved obviously. It is interesting that the OD450 with H3-BSA (0.527, 1.628, and 1.677) was higher than that with H2-BSA (0.137, 1.453, and 1.197). We believed that the longer spacer arms (five carbons) produced a better immune response. When the antibody based on H3-BSA as the immunogen was tested using the ic-ELISA, the inhibition ratios were 63.6% (H2-OVA) and 48.5% (H3-OVA), respectively. As expected, the inhibition ratio for heterologous assays is generally higher than those for homologous assays. Thus, the H2-OVA was selected as best coating antigen and used on the T line.
Table 1. Competitive ELISA results with different coating antigens and antibodies
3.3. Preparation of mAb
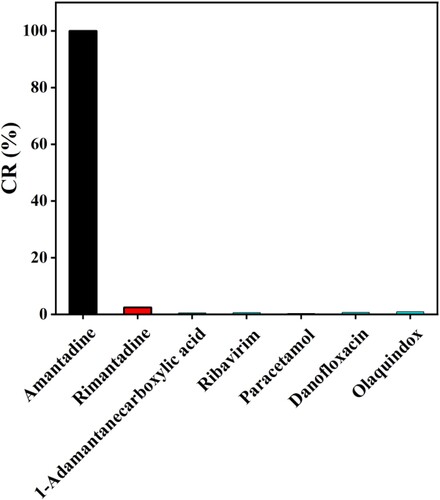
After the antiserum screening by using the ic-ELISA, the mouse with the best titre and greatest inhibition of AMD was sacrificed for cell fusion. After the subcloned, five monoclonal antibodies of 1C6, 2B3, 2C3, 4E11, and 5E2 were obtained. shows the standard inhibition curves for the ic-ELISA of AMD with the five monoclonal antibodies and different standard AMD concentrations (0, 0.1, 0.4, 1.2, 3.7, 11.1, 33.3, and 100 ng/mL). The 2B3 had obtained the highest sensitivity (IC50 = 0.20 ng/mL) while IC50 of 1C6, 2C3, 4E11, 5E2 were 1.28, 2.5, 0.32, and 0.61 ng/mL, respectively. The CR of rimantadine for 2B3 was 2.5%. Ribavirin, 1-adamantane carboxylic acid, paracetamol, danofloxacin, and olaquindox had no cross reaction with 2B3 (). Results showed that the 2B3 has good specificity for AMD.
Figure 2. The standard curves of the ic-ELISA for detection of AMD with the five monoclonal antibodies. Each point of inhibition curve represents three replicates.
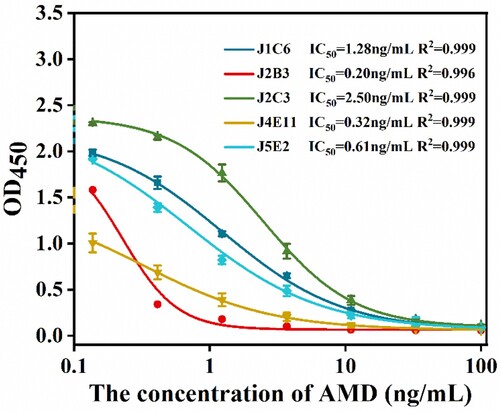
Figure 3. Specificity analysis of the ic-ELISA. The concentrations of amantadine, rimantadine, 1-adamantane carboxylic acid, ribavirin, paracetamol, danofloxacin, and olaquindox in PBS were 100 ng/mL.
3.4. Development of CG-ICA
3.4.1. Characterization of AuNPs and AuNPs-mAb probe
The transmission electron microscopy (TEM) image of AuNPs (Figure S5(A)) indicated that the AuNPs had a relatively uniform size distribution with an average diameter of 40 nm. The ultraviolet–visible (UV–vis) spectra of the AuNPs and the AuNPs-mAb conjugate were detected using a UV spectrophotometer at a wavelength of 450–700 nm (Figure S5(B)). AuNPs had a maximum UV absorption wavelength of 529 nm. When the AuNPs were combined with anti-AMD mAb, the UV absorption wavelength had red shifted to 536 nm. These results indicated that AuNPs were well prepared, and the anti-AMD mAb was successfully coupled on the surface of the AuNPs.
3.4.2. Optimization of the coupling pH
Figure S6 shows that the signal intensity of the T line and the inhibition ratio changed as the pH increased. At pH 7.0, the signal intensity of the T line and the competitive inhibition ratio were 1649 (a.u.) and 62.2%, respectively. Although the competitive inhibition ratios at pH 7.0 and at pH 8.0 were almost the same, labelling condition at pH 7.0 was milder than that at pH 8.0. Therefore, labelling with pH 7.0 was regarded as the optimal pH for coupling with AuNPs.
3.4.3. Optimization of the anti-AMD mAb concentration
The anti-AMD mAb concentration was also an important factor for coupling with AuNPs. In Figure S7, when the antibody concentration was 0.5 μg/mL, the signal intensity of the T line was 1155 (a.u.) and reached the highest, and the maximum competitive inhibition ratio was highest of 73.2%. Therefore, 0.5 μg/mL anti-AMD mAb was regarded as the optimal concentration for coupling with AuNPs.
3.4.4. Optimization of the concentration of H2-OVA on the T line
In Figure S8, when the concentration of H2-OVA was 0.3 mg/mL, the signal intensity of the T line was 1102 (a.u.), and the competitive inhibition ratio reached the highest (81.7%). Therefore, 0.3 mg/mL was regarded as the optimal concentration on the T line.
3.5. Immunological kinetic analysis of CG-ICA
Immunological kinetic curves were established by plotting AT and AT/AC against the immunoreaction time. Figure S9 shows the intensities of the T line and the AT/AC within 50 min. The AT/AC became constant at 16 min, which was the optimum immunoreaction time for CG-ICA.
3.6. Standard curve of CG-ICA
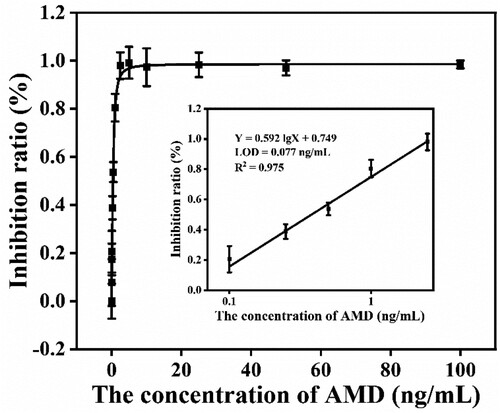
The standard curve of the method was constructed by plotting the inhibition ratio (1 – B/B0) against the logarithm of various AMD concentrations. A series of AMD solutions was prepared by spiking the AMD at 0, 0.01, 0.05, 0.1, 0.25, 0.5, 1, 2.5, 5, 10, 25, 50, and 100 ng/mL. In , the regression equation of the standard curve was Y = 0.592 lg X + 0.749, exhibiting a good linear range at 0.1–2.5 ng/mL with a reliable correlation coefficient (R2 = 0.975). The LOD was calculated as 0.077 ng/mL. The cut-off value was 2.5 ng/mL (Figure S10). The LOD of the method was compared with other methods in Table S1. We thought that the method was more sensitive by using heterologous coating antigen and mAb prepared with immunogen adding five carbons linker.
Figure 4. Standard curve of CG-ICA for detection of AMD obtained by plotting the logarithm of B/B0 against the various AMD concentrations. Error bars represent the standard deviation (n = 3).
3.7. Recovery of different AMD concentrations
The recoveries of the method were analyzed using three AMD concentrations (0.5, 1.0, and 2.5 μg/kg) in chicken. The recovery was 96.4–123.0%, while the CVs of intra-day and inter-day were 2.4–5.8% and 5.9–9.2%, respectively ().
Table 2. Recovery and CV of CG-ICA in chicken samples.
4. Conclusions
In summary, a highly sensitive CG-ICA for AMD detection by using heterologous coating antigen and mAb prepared with immunogen adding five carbons linker had been established. The developed anti-AMD monoclonal antibody showed good specificity. The cut-off value was 2.5 ng/mL by naked eyes. The CG-ICA presented a good signal response to AMD in the concentration range of 0.1–2.5 ng/mL with high sensitivity (LOD = 0.077 ng/mL). The recoveries of AMD in chicken samples ranged from 96.4% to 123.0%, and the inter-day and the intra-day CVs were 2.4–5.8% and 5.9–9.2%, respectively. These results indicated that the developed CG-ICA offered an accurate, sensitive, specific, and fast detection of AMD in chicken samples.
Disclosure statement
No potential conflict of interest was reported by the author(s).
Data availability
The data used to support the findings of this study are included in the article.
Additional information
Funding
References
- Cao, Z., Zhao, H. W., Cui, Y. L., Zhang, L., Tan, G. Y., Wang, B. M., & Li, Q. X. (2014). Development of a sensitive monoclonal antibody-based enzyme-linked immunosorbent assay for the analysis of paclobutrazol residue in wheat kernel. Journal of Agricultural and Food Chemistry, 62(8), 1826–1831. https://doi.org/10.1021/jf404905w
- Chen, G. Y., Huang, X. H., Li, S. P., Kong, X. K., & Huai, B. B. (2014). Synthesis of a newly designed artificial antigen and preparation of a polyclonal antibody against salbutamol. Food and Agricultural Immunology, 25(3), 322–331. https://doi.org/10.1080/09540105.2013.791970
- Chen, M. H., Yu, Z. B., Liu, D. F., Peng, T., Liu, K., Wang, S. Y., Xiong, Y. H., Wei, H., Xu, H. Y., & Lai, W. H. (2015). Dual gold nanoparticle lateflow immunoassay for sensitive detection of Escherichia coli O157:H7. Analytica Chimica Acta, 876, 71–76. https://doi.org/10.1016/j.aca.2015.03.023
- Chen, X. L., Xu, H. Y., Lai, W. H., Chen, Y., Yang, X. H., & Xiong, Y. H. (2011). A sensitive chromatographic strip test for the rapid detection of enrofloxacin in chicken muscle. Food Additives and Contaminants Part a-Chemistry Analysis Control Exposure & Risk Assessment, 29(3), 1–9. https://doi.org/10.1080/19440049.2011.641509
- Chew, C. F., Guy, A., & Biggin, P. C. (2008). Distribution and dynamics of adamantanes in a lipid bilayer. Biophysical Journal, 95(12), 5627–5636. https://doi.org/10.1529/biophysj.108.139477
- Dong, B. L., Li, H. F., Mujtaba Mari, G., Yu, X. Z., Yu, W. B., Wen, K., Ke, Y. B., Shen, J. Z., & Wang, Z. H. (2019). Fluorescence immunoassay based on the inner-filter effect of carbon dots for highly sensitive amantadine detection in foodstuffs. Food Chemistry, 294, 347–354. https://doi.org/10.1016/j.foodchem.2019.05.082
- Farajzadeh, M. A., Nouri, N., & Alizadeh Nabil, A. A. (2013). Determination of amantadine in biological fluids using simultaneous derivatization and dispersive liquid-liquid microextraction followed by gas chromatography-flame ionization detection. Journal of Chromatography B-Analytical Technologies in the Biomedical and Life Sciences, 940, 142–149. https://doi.org/10.1016/j.jchromb.2013.09.035
- Hao, X., Li, N., Xu, Z., Li, N. B., & Luo, H. Q. (2016). An electrochemical sensing strategy for amantadine detection based on competitive host-guest interaction of methylene blue/beta-cyclodextrin/poly(N-acetylaniline) modified electrode. Electroanalysis, 28(7), 1489–1494. https://doi.org/10.1002/elan.201501149
- He, G. M., Qiao, H., Dong, C. G., He, C., Zhao, L. H., & Tian, Y. (2008). Amantadine-resistance among H5N1 avian influenza viruses isolated in northern China. Antiviral Research, 77(1), 72–76. https://doi.org/10.1016/j.antiviral.2007.08.007
- Huang, Y. J., & Kim, D. H. (2011). Synthesis and self-assembly of highly monodispersed quasispherical gold nanoparticles. Langmuir, 27(22), 13861–13867. https://doi.org/10.1021/la203143k
- Lee, N., McAdam, D. P., & Skerritt, J. H. (1998). Development of immunoassays for type II synthetic pyrethroids. 1. Hapten design and application to heterologous and homologous assays. Journal of Agricultural and Food Chemistry, 46(2), 520–534. https://doi.org/10.1021/jf970438r
- Liu, Y. H., Xie, R., Guo, Y. R., Zhu, G. N., & Tang, F. B. (2012). Comparison of homologous and heterologous formats in nanocolloidal gold-based immunoassays for parathion residue determination. Journal of Environmental Science and Health Part B-Pesticides Food Contaminants and Agricultural Wastes, 47(5), 475–483. https://doi.org/10.1080/03601234.2012.663613
- Luo, K., Hu, L. M., Guo, Q., Wu, C. H., Wu, S. S., Liu, D. F., Xiong, Y. H., & Lai, W. H. (2017). Comparison of 4 label-based immunochromatographic assays for the detection of Escherichia coli O157:H7 in milk. Journal of Dairy Science, 100(7), 5176–5187. https://doi.org/10.3168/jds.2017-12554
- Peng, D. P., Wei, W., Pan, Y. H., Wang, Y. L., Chen, D. M., Liu, Z. L., Wang, X., Dai, M. H., & Yuan, Z. H. (2017a). Preparation of a monoclonal antibody against amantadine and rimantadine and development of an indirect competitive enzyme-linked immunosorbent assay for detecting the same in chicken muscle and liver. Journal of Pharmaceutical and Biomedical Analysis, 133, 56–63. https://doi.org/10.1016/j.jpba.2016.11.009
- Peng, J., Liu, L. Q., Kuang, H., Cui, G., & Xu, C. L. (2017b). Development of an icELISA and immunochromatographic strip for detection of norfloxacin and its analogs in milk. Food and Agricultural Immunology, 28(2), 288–298. https://doi.org/10.1080/09540105.2016.1263987
- Qian, G. L., Wang, L. M., Wu, Y. R., Zhang, Q., Sun, Q., Liu, Y., & Liu, F. Q. (2009). A monoclonal antibody-based sensitive enzyme-linked immunosorbent assay (ELISA) for the analysis of the organophosphorous pesticides chlorpyrifos-methyl in real samples. Food Chemistry, 117(2), 364–370. https://doi.org/10.1016/j.foodchem.2009.03.097
- Shuangjin Cui, Fang Feng, Han Liu, & Ming Ma (2007). New method for high-performance liquid chromatographic determination of amantadine and its analogues in rat plasma. Journal of Pharmaceutical and Biomedical Analysis, 44(5), 1100–1105. https://doi.org/10.1016/j.jpba.2007.04.021
- Vasylieva, N., Ahn, K. C., Barnych, B., Gee, S. J., & Hammock, B. D. (2015). Development of an immunoassay for the detection of the phenylpyrazole insecticide fipronil. Environmental Science & Technology, 49(16), 10038–10047. https://doi.org/10.1021/acs.est.5b01005
- Wang, R. Z., Zeng, L. M., Yang, H., Zhong, Y. F., Wang, J. C., Ling, S. M., Saeed, A. F., Yuan, J., & Wang, S. H. (2017a). Detection of okadaic acid (OA) using ELISA and colloidal gold immunoassay based on monoclonal antibody. Journal of Hazardous Materials, 339, 154–160. https://doi.org/10.1016/j.jhazmat.2017.06.030
- Wang, Z. H., Beier, R. C., & Shen, J. Z. (2017b). Immunoassays for the detection of macrocyclic lactones in food matrices: A review. TrAC Trends in Analytical Chemistry, 92, 42–61. https://doi.org/10.1016/j.trac.2017.04.008
- Wang, Z. H., Beier, R. C., Sheng, Y. J., Zhang, S. X., Jiang, W. X., Wang, Z. P., Wang, J., & Shen, J. Z. (2013a). Monoclonal antibodies with group specificity toward sulfonamides: Selection of hapten and antibody selectivity. Analytical and Bioanalytical Chemistry, 405(12), 4027–4037. https://doi.org/10.1007/s00216-013-6785-5
- Wang, Z. H., Li, N., Zhang, S. X., Zhang, H. Y., Sheng, Y. J., & Shen, J. Z. (2013b). Production of antibodies and development of enzyme-linked immunosorbent assay for valnemulin in porcine liver. Food Additives and Contaminants Part a-Chemistry Analysis Control Exposure & Risk Assessment, 30(2), 244–252. https://doi.org/10.1080/19440049.2012.738370
- Wu, S. S., Zhu, F. F., Hu, L. M., Xia, J., Xu, G. M., Liu, D. F., Guo, Q., Luo, K., & Lai, W. H. (2017a). Development of a competitive immunochromatographic assay for the sensitive detection of amantadine in chicken muscle. Food Chemistry, 232, 770–776. https://doi.org/10.1016/j.foodchem.2017.04.058
- Wu, X. L., Song, Y., Yan, X., Zhu, C. Z., Ma, Y. Q., Du, D., & Lin, Y. H. (2017b). Carbon quantum dots as fluorescence resonance energy transfer sensors for organophosphate pesticides determination. Biosensors and Bioelectronics, 94, 292–297. https://doi.org/10.1016/j.bios.2017.03.010
- Xie, S. L., Wen, K., Xie, J., Zheng, Y. J., Peng, T., Wang, J. Y., Yao, K., Ding, S. Y., & Jiang, H. Y. (2018). Magnetic-assisted biotinylated single-chain variable fragment antibody-based immunoassay for amantadine detection in chicken. Analytical and Bioanalytical Chemistry, 410(24), 6197–6205. https://doi.org/10.1007/s00216-018-1227-z
- Xu, L. G., Peng, S., Liu, L. Q., Song, S. S., Kuang, H., & Xu, C. L. (2016). Development of sensitive and fast immunoassays for amantadine detection. Food and Agricultural Immunology, 27(5), 678–688. https://doi.org/10.1080/09540105.2016.1148667
- Yan, H., Liu, X., Cui, F. Y., Yun, H., Li, J. H., Ding, S. Y., Yang, D. J., & Zhang, Z. H. (2013). Determination of amantadine and rimantadine in chicken muscle by QuEChERS pretreatment method and UHPLC coupled with LTQ orbitrap mass spectrometry. Journal of Chromatography B-Analytical Technologies in the Biomedical and Life Sciences, 938, 8–13. https://doi.org/10.1016/j.jchromb.2013.08.020
- Yuan, M. F., Xiong, Z. J., Fang, B. L., Guo, Z., Guo, D. B., Lai, W. H., & Peng, J. (2020). Preparation of an antidanofloxacin monoclonal antibody and development of immunoassays for detecting danofloxacin in meat. Acs Omega, 5(1), 667–673. https://doi.org/10.1021/acsomega.9b03270
- Zhu, F. F., Peng, J., Huang, Z., Hu, L. M., Zhang, G. G., Liu, D. F., Xing, K. Y., Zhang, K. Y., & Lai, W. H. (2018). Specific colorimetric ELISA method based on DNA hybridization reaction and non-crosslinking gold nanoparticles aggregation for the detection of amantadine. Food Chemistry, 257, 382–387. https://doi.org/10.1016/j.foodchem.2018.03.033