
 ?Mathematical formulae have been encoded as MathML and are displayed in this HTML version using MathJax in order to improve their display. Uncheck the box to turn MathJax off. This feature requires Javascript. Click on a formula to zoom.
ABSTRACT
Licochalcone A (LicoA), which is found in the root of Chinese licorice (Glycyrrhiza inflata Batalin), has been reported as an effective anti-microbial and anti-inflammation and was approved for the treatment of rosacea and acne in clinical therapeutic. To develop a monoclonal antibody against LicoA, a mannich reaction hapten conjugate was used for immunization, followed by the hybridoma technique. Enzyme-linked immunosorbent assay (ELISA) for the quantitative determination of LicoA was developed using a constructed antibody. The assay validation results were highly specific for the target compound, but minimally cross-reactive with the structure-related substances. After optimal conditions, the detection limit was 4.32 ng/mL and the quantification limit was 6.84–107.21 ng/mL. As a result, the developed ELISA was applied to determine the concentration of LicoA in raw licorice and marketed samples. This assay will aid in the quality control of licorice and derived products, as it can be used to identify plant species and determine bioactive markers.
1. Introduction
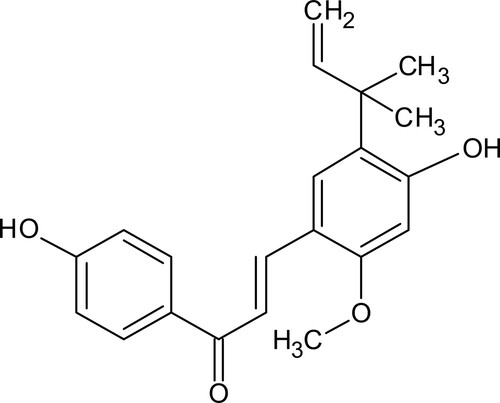
Licochalcone A (LicoA) is a substance in the chalcones class, which is a precursor of the flavonoids group, as its structure is demonstrated in . The previous studies reported that LicoA was the specific marker of Glycyrrhiza inflata Batalin (Chinese licorice). The yield of LicoA was about 0.3–1% (w/w) (Fukuda et al., Citation2010; Hayashi et al., Citation2000; Kondo et al., Citation2007a). With a prenylated substitution functional group, it increases affinity toward biological membrane penetration resulting in a broad range of pharmacological activities (Yang et al., Citation2015). LicoA has reported on the growth inhibition of gram-positive bacteria including Bacillus sp. The antibacterial effect was resisted in the presence of high salt and protease enzyme, which is used in the place of a cationic food preservative agent inactivated in that condition (Tsukiyama et al., Citation2002). In the case of gram-negative bacteria, LicoA inhibits the aggregation of drug-resistant Salmonella enterica, a food-contaminated bacteria which can cause diarrhoea in humans (Hosseinzadeh et al., Citation2020). In addition, LicoA has anti-parasitic activity toward malaria (Mishra et al., Citation2009) and toxoplasmosis-induced bacteria (Si et al., Citation2018). Therefore, LicoA is an interesting candidate for the treatment of infection and in food preservation. LicoA exhibited anti-inflammation by the down-regulation of a gene related to the production of inflammatory cytokines, such as TNF-α, IL-6, and IL-1β. The reduction of inflammatory cells, tissue swelling, and protein leakage in the lung tissue were also observed (Chu et al., Citation2012). Moreover, LicoA can also inhibit PGE2 and NO production that consequences from osteoarthritis (Jia et al., Citation2017). Since LicoA is well-known for its anti-microbial and anti-inflammatory properties, researchers try to apply it for the treatment of diseases related to these conditions such as acne. In 2018, Yang et al. found that LicoA could inhibit mediators that cause acne lesions (NLRP3 inflammasome). Since then, LicoA was incorporated in the cosmetic regimen for the treatment of acne and other inflammatory-related skin conditions (sensitive facial skin, rosascea, and atopic dermatitis) in a clinical setting (Kantikosum et al., Citation2019; Schoelermann et al., Citation2016).
Figure 1. Structure of licochalcone A.
Since LicoA is well-known for its strong anti-microbial and anti-inflammatory activities, it has received an intensive research focus, nowadays. Moreover, there are many products derived from LicoA present in the market, which are available in the form of an enriched LicoA extract and skin product. Based on the label, the LicoA content in a product is about 0.025–0.05% (w/w) (Kantikosum et al., Citation2019; Wananukul et al., Citation2012). To ensure product efficacy and consumer safety, an analysis of LicoA content should be applied before pushing the product to the markets. Liquid chromatography with a UV detector was the standard method for the analysis of LicoA. However, the sensitivity of the method was not sufficient for product analysis and a complex additional step of sample preparation is required (Li et al., Citation2019). Previously, there were reports on using the antigen–antibody principle for the detection of plant secondary metabolites, including Glycyrrhiza sp. derived substances. The enzyme-linked immunosorbent assay (ELISA) for the detection of glycyrrhizin (Shan et al., Citation2001) and liquiritin (Fujii et al., Citation2014) were developed, resulting in the establishment of a higher sensitivity method for the licorice analysis when compared with the conventional HPLC method.
To the best of our knowledge, there is no publication established on the immunoassay method of LicoA. Therefore, this study was intended to produce a monoclonal antibody against LicoA. The constructed antibody can be applied for the development of the immunoassay method which has benefit in high sensitivity and specificity, when compared with the conventional HPLC method. Besides, it allows high-throughput screening for sample determination. Furthermore, it can be used for licorice species identification, which was previously done by sequencing genetics or investigating genetic markers (Kondo et al., Citation2007b).
2. Materials and methods
2.1. Chemicals and reagents
Licochalcone A was purchased from Sigma-aldrich (Missouri, USA). Bovine serum albumin was purchased from Nacalai Tesque (Kyoto, Japan). To conjugate immunogens, ovalbumin (OVA) and human serum albumin (HSA) from Sigma-Aldrich (Missouri, USA) were used. 2-(N-morpholino) ethanesulfonic acid, 0.9% sodium chloride, pH 4.7 (MES buffer saline) was acquired from Thermo Scientific (Missouri, USA). Freund’s complete and incomplete adjuvants were purchased from Difco (Missouri, USA). Goat anti-mouse polyclonal secondary antibodies labelled with horseradish peroxidase were purchased from Abcam (Missouri, USA). 2,2’-azino-bis (3-ethylbenzthiazoline-6-sulphonic acid) (ABTS) (Sigma-Aldrich, Missouri, USA) was used as a peroxidase enzyme substrate. Acetonitrile, acetic acid, and methanol were purchased from Ajax Finechem (New South Well, Australia). All chemicals were of analytical grade.
2.1.1. Cell culture reagents
The enriched RPMI 1640 Dulbecco’s Ham’s F12 (eRDF), the myeloma and hybridoma culture medium were purchased from Kyokuto Pharmaceutical Industrial Co. (Tokyo, Japan). The hypoxanthine–aminopterin–thymidine (HAT) and HT supplement, the selective medium for hybridoma cells were bought from Gibco Invitrogen (New York, USA).
2.1.2. Animals
The five-week-old male BALB/c mice were obtained from Nomura Siam International (Bangkok, Thailand). All mice were maintained and cared at the Northeast Laboratory Animal Center (Khon Kaen University). The immunization plan and animal procedures followed the institutional animal care and use committee at Khon Kaen University’s guidelines for animal experiments (IACUC-KKU-8/63).
2.1.3. Plant and marketed product samples
Glycyrrhiza inflata, G. glabra plants and product samples were purchased from the markets in Thailand and China.
2.2. Sample extraction
Dry plant specimens were milled to a fine powder. After accurately weighing 50 mg of powder in a microtube, 0.5 mL of methanol was added to act as an extracting solvent. The sample was sonicated for 20 min and centrifuged to collect the supernatant. The extraction process was repeated four times. For the herbal drug samples, 100 mg of drug powder was weighted; then, the extraction process was done as described in the plant sample part. All extract supernatants were dried at room temperature following extraction. Before performing the ELISA analysis, all dried samples were redissolved in methanol and diluted with distilled water to a concentration of 20% methanol.
2.3. Development of antibody against licochalcone A
2.3.1. Antigen-protein conjugation
The Mannich reaction (Jean et al., Citation1999) was used to conjugate licochalcone A (LicoA) and bovine serum albumin (BSA). In brief, 5 mg of LicoA was dissolved in a mixture of 600 µL absolute methanol and 600 µL of 37% formaldehyde. The solution was then gradually dropped to 5 mg of BSA in 8 mL of 0.1 M MES buffer saline solution pH 4.7. The reaction was incubated at 37°C with constant mixing for 24 h to allow antigen and protein conjugation. After the incubation was complete, the solution was dialysed to remove any remaining salt and freeze-dried. Conjugation was confirmed by determining the hapten number using a matrix-assisted laser desorption/ionization (MALDI) in conjunction with a time-of-flight detector (TOF). The protocol and method of calculation were compiled in accordance with Udomsin et al. (Citation2017). The procedure for conjugating LicoA to ovalbumin (OVA) and human serum albumin (HSA), which is used as a coating substance in ELISA, was identical to that for conjugating LicoA to BSA, except replacing BSA with HSA or OVA.
2.3.2. Mice immunization
Mice aged five weeks were immunized intraperitoneally with LicoA-BSA. The dose of conjugated substances was 300 µg for the initial immunization and was combined with Freund’s complete adjuvant to increase immunogenicity. Antibody-boosting immunizations were administered every two weeks. The dose of conjugated substance was halved for the second and third immunizations, and Freund’s complete adjuvant was replaced with Freund’s incomplete adjuvant. Three days after the third boosting immunisation, blood samples were collected to determine the antibody titer using the indirect ELISA method.
2.3.3. Cell fusion and hybridoma cell culture
Prior to cell fusion, the mouse myeloma (sp2/0) cell line was cultured and maintained at 37°C in eRDF supplemented with 20% fetal bovine serum (FBS). After obtaining a sufficiently high serum antibody titer, the mouse was decapitated to separate the spleen. The PEG method was then used to fuse spleen cells and myeloma. The fusion cells were placed in a 96-well cell culture plate. The following day, HAT was added to allow only hybridoma cells to grow on culture media. After two weeks of culture, a sample of the culture media was taken to screen for a positive clone capable of producing antibodies using an indirect ELISA. The positive clone was then subcultured in a 24-well cell culture plate and examined for inhibitory activity, which correlates with the specificity against LicoA. By limiting dilution, the clone with the greatest specificity was chosen for cloning. The highly specific clone was scaled up and purified using an ammonium sulfate precipitation method. The purification protocol was adapted from Grodzki and Berenstein (Citation2010) with minor modifications. In brief, the culture media were collected using centrifugation at a speed of 2228 g, and then, filtered. The solution of saturated ammonium sulfate was slowly added, while stirring until the salt concentration reached 50% (v/v). The solution was kept at 25°C for 1 h to allow for antibody precipitation. The mixture solution was transferred to a conical tube and centrifuged at 3000 g for 30 min to collect the antibody pellet. The pellet was redissolved in PBS and dialysed to remove any remaining salt. Finally, the dialysed product was freeze-dried and the concentration was determined using the Bradford protein assay.
2.3.4. ELISA method for determination of antibody titer
Three days after the third booster immunisation, blood was collected via tail vein and centrifuged for 10 min at 19,000 g to collect the supernatant. The serum was then diluted in phosphate-buffered saline containing 0.05% tween 20 (PBST). For determination of antibody titer, LicoA-OVA (2.5 µg/mL) in carbonate buffer (pH 9.6) was coated on a 96-well plate and incubated for an hour. After that, 1% gelatin in phosphate buffer saline (PBS) was added to minimize the disruption caused by non-specific reactions. After one hour of blocking, methanol at a concentration of 20% in distilled water was pipetted into the well. Following that, the diluted serum supernatant was added as the primary antibody. The ELISA plate was mixed and incubated for 1 h. A 1:1000 dilution of peroxidase-labeled anti-mouse IgG in PBST was added as a secondary antibody. After an hour of incubation, the ABTS solution (0.3 mg/mL ABTS dissolved in 200 mM citrate buffer pH 4 with 0.003% H2O2) was added to generate the color, which was detected at 405 nm using a Biochrome (Massachusetts, USA) microplate reader model EZ Read 400, after 20 min of incubation. All steps were performed at 37°C. After incubation in each step, the plate was washed three times with PBST.
2.3.5. Characterisation of anti-licochalcone A monoclonal antibody (anti-LicoA mAb) and the development of the ELISA method
After anti-LicoA mAb was purified from culture media, the antibody type was determined using the IsoStrip mouse monoclonal antibody isotyping kit (Roche diagnostic, Mannhaim, Germany). The Bradford protein assay was used to determine the antibody concentration using bovine serum albumin as a standard. Thereafter, the antibody was equipped for the development of ELISA to determine LicoA. To confirm the developed integrity of the method, validation parameters such as reactivity, cross reactivity, limit of detection, limit of quantification, percentage recovery, and precision were calculated.
2.3.6. The effect of protein conjugate on antibody reactivity
Reactivity is the property of antibodies that react to antigens. The indirect non-competitive ELISA was done to find the coating agent that resulted in the highest reactivity. In this experiment, two types of protein conjugate – LicoA-OVA and LicoA-has – were compared. The protocol started with coating the immunoplate with 2.5 µg/mL of the coating agent. Then, the plate was blocked with 1% gelatin in PBS. The anti-LicoA mAb was diluted with PBST and added as the primary antibody. In the latter step, the process was similar to the determination of antibody titer as described in the previous section. The coating agent that obtained the highest reactivity was selected for the determination of cross reactivity and the development of the ELISA method for the determination of LicoA. Moreover, the anti-LicoA mAb concentration that obtained an absorbance value of 1 was selected for the cross reactivity assay.
2.3.7. Cross reactivity (specificity), linearity, LOD and LOQ
The cross reactivity of antibodies against a specific substance (LicoA) was investigated in comparison to that of other substances. An indirect competitive ELISA could be used to determine the magnitude of recognition. Where that antibody recognized the free antigen, it was occupied by the antigen and washed out prior to the addition of the secondary antibody. As a result, the absorbance signal was less than the blank signal (20% methanol). The greater the recognition level, the lower the antigen (standard) concentration required for competitive binding. For the ELISA protocol, the plate was coated and blocked as described previously. Following that, antigens containing varying concentrations of LicoA or related substances were added, followed by anti-LicoA monoclonal antibodies. The secondary antibody and substrate were then added, as previously described. After determining the absorbance, plots were constructed between the logarithmic concentration of LicoA and the absorbance value (A/A0). The absorbance of LicoA (or the tested sample) was denoted by A, while the absorbance of a blank was denoted by A0 (20% methanol). The concentration range corresponding to a linear curve was selected as the calibration curve for LicoA determination. Additionally, the equation of the plot was used to calculate the 50% inhibitory concentration (IC50) of LicoA or related substances. As shown in the equation below, the IC50 value was used to calculate the percent cross reactivity.
The concentration of LicoA that provided 10% inhibition (or ALicoA/Ablank = 0.9) was determined as the limit of detection (LOD) for ELISA determination, using the equation of the plot. In addition, a concentration in the range of IC20 to IC80 of the calibration curve was selected as limited of quantification (LOQ) (Vdovenko et al., Citation2012).
2.3.8. Percentage recovery assay
The spike recovery was conducted to confirm that the concentration–response relationship was present as in the standard curve. Moreover, it was used to confirm that the matrix in the test sample will not affect the measurement. The three points of concentration that were evenly distributed in the linear range were selected as low (25%), medium (50%), and high (100%) concentrations of a standard LicoA. Since the non-spike licorice extract contained LicoA 59.21 ng/mL, the % recovery was calculated according to this equation;
The acceptable percentage recovery should be in the range of 80%–120% of the LicoA standard, which spiked in the sample (Andreasson et al., Citation2015).
2.3.9. Precision
Intra- and inter-plate variation was used to determine the precision parameter. For intra-plate variation (n = 3), the A/A0 value of the standard, from the same ELISA plate, was calculated in terms of percent relative standard deviation (% RSD). The variation between plates (n = 3) was determined by comparing the A/A0 values across plates. These parameters ensure that the result is reproducible from analysis to analysis. The acceptable % RSD should not be more than 10% and 15% for intra- and inter-plate, respectively (Minic & Zivkovic, Citation2020).
2.3.10. Sample determination
The sample determination was carried out using indirect competitive principles. The ELISA plate was coated with 2.5 µg/mL of LicoA-OVA for 1 h to fix the antigen on the immunoplate. Then, the plate was washed with PBST and added with 1% gelatin in PBS to block non-specific binding. After incubation for 1 h, samples or standard LicoA were added, and subsequently, anti-LicoA mAb was added to react with the antigen. Afterward, the anti-mouse IgG conjugated with HRP was added to detect the antibody that was coupled with the fixed antigen. Finally, the ABTS substrate was added and the absorbent was measured. The plot between the absorbent and the concentration of standard LicoA was implemented as a standard curve. The absorbent of samples was replaced in the equation and solved for the concentration of samples. All standards and samples were dissolved in 20% methanol in distilled water. To ensure repeatability, all analyses were performed in triplicate (n = 3).
2.3.11. Comparison with the HPLC method
The result of the analysis from ELISA was compared with the HPLC method, which was previously validated by Krittanai et al. (Citation2021). The correlation coefficient between the two methods was calculated. The HPLC method was operated on Shimadzu UV-vis with a detection wavelength of 254 nm. The C18 reverse phase column was used (Purospher STAR, RP-18 encapped, 250 × 4 mm, 5 µm). The mobile phase component consisted of acetonitrile (A) and 1.5% acetic acid (B) with a flow rate of 0.8 mL/min. The gradient system was set at 25% solvent A (at 0–20 min); then, the solvent A composition was increased to 75% at 20 min and maintained for 5 min. Subsequently, the solvent A percentage was increased up to 100% (at 40 min) and maintained for 5 min to flush impurities out of the system. At 45 min, solvent A was adjusted to 25% to re-equilibrate the column for further injection. A reference standard was used to analyse the amount of this substance in the samples. Pearson's correlation was used to compare the correlation between the results analysed from the developed ELISA and HPLC. Moreover, the plant sample that contained a low amount of LicoA was also analysed to compare the sensitivity of both analyses methods. The number of samples was reported in terms of the average standard deviation (SD) of triplicate analysis.
3. Results and discussion
3.1. Antigen conjugation and mice immunisation
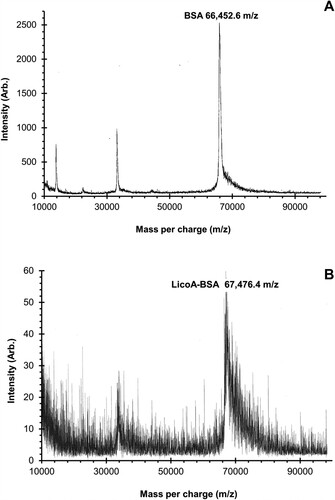
The Mannich reaction was applied to construct the conjugation between licochalcone A and bovine serum albumin (BSA), which is a carrier protein. From , the MALDI-TOF MS spectra demonstrated the molecular weight of BSA and LicoA-BSA conjugate as 66,452.6 and 67,476.4 Da, respectively. Since the molecular weight of LicoA equals to 338.4 Da, the hapten number of immunogen was equal to three, which means that three molecules of LicoA conjugated with one molecule of BSA (Xu et al., Citation2009). After the sixth immunization, the antibody titer was optimized; therefore, the mice were decapitated to isolate the spleen cell. After fusion, the hybridoma cells were maintained in the eRDF media supplemented with a 15% FBS and cloned by limiting dilution to select the optimized clone. After the fourth clone by limiting dilution, the clone 8F8 was selected – since it had the highest absorbance and selectivity. Then, the antibody was purified by the ammonium precipitation method. The Bradford protein assay showed the protein yield as an antibody concentration of 1.5 mg/mL (or 0.03 mg/mL cell culture medium). In addition, the IsoStrip mouse monoclonal antibody kit indicated the antibody isotype as IgG1 with a kappa light chain.
Figure 2. Matrix-assisted laser desorption ionization-time of flight mass spectrometry (MALDI-TOF MS) spectra of the BSA (A) and LicoA-BSA conjugate (B).
3.2. Optimisation and validation of ELISA
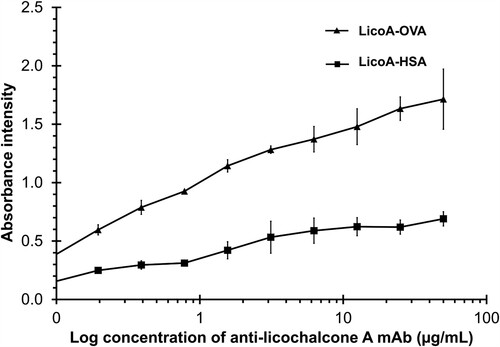
To optimize the ELISA system, an immunoplate was coated with a conjugate of LicoA and protein (OVA or HSA) to determine the antigen–antibody reactivity. As illustrated in , the result exhibited greater reactivity in LicoA-OVA than in LicoA-HSA. Therefore, LicoA conjugated with OVA was more suitable to be used in the ELISA system; since HSA had a molecular size of about 66 kDa which is bigger than the OVA (45 kDa) when conjugated with LicoA and used as a fixed antigen on the immune plate. The steric hindrance of the HSA molecule may hinder the binding of anti-LicoA to the fixed LicoA, resulting in a lower absorbance signal. In addition, the absorbance one can be achieved using an anti-LicoA mAb concentration of 1.36 µg/mL; it was chosen for the construction of the inhibition curve.
Figure 3. Reactivity curve of the anti-licochalcone A monoclonal antibody which reacted with coated antigen (LicoA-OVA demonstrated as a triangle, while LicoA-HSA is demonstated as a square).
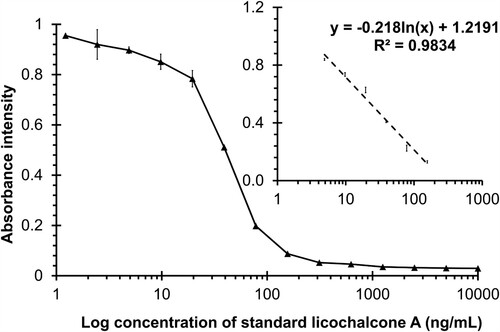
The inhibition curve was constructed using standard LicoA (concentration 1.22–10,000 ng/mL). As demonstrated in , the linearity concentration was at a range between 4.88 and 156.25 ng/mL (R2 = 0.9834). Additionally, the linear equation was derived from this graph, and the 50% inhibitory concentration (IC50) was determined to be 27.08 ng/mL. The limit of detection (LOD, IC10) was 4.32 ng/mL. Furthermore, the limit of quantification (LOQ) was 6.84–107.21 ng/mL. The developed ELISA had a higher sensitivity than the standard approach. According to the previous publications by Krittanai et al. (Citation2021), the LOD and LOQ by the HPLC method were 210 and 700 ng/mL, respectively. The LOD of this immunoassay was determined to be 50 times lower than that of the HPLC, while the LOQ was determined to be 100 times lower than that of the HPLC.
Figure 4. Inhibition and calibration curve of the anti-licochalcone A monoclonal antibody.
The cross reactivity of the antibody with a related licorice standard was used to determine its specificity. The investigation established that LicoA had a high degree of specificity. The cross reactivity between LicoA and other chalcone compounds was minimal, with echinatin having a cross reactivity of only 0.31%. The cross reactivity of other compounds was less than 0.01%, as shown in . As a result, the antibody obtained could be used to measure LicoA without interference from other structurally related substances. To ensure the accuracy of the result obtained from the ELISA method, a recovery assay was implemented. The standard LicoA in concentrations of 12.5, 25 and 50 ng/mL was spiked to the plant sample that was previously analysed for LicoA content. After that, % recovery was calculated to determine the correlation between the real amount of spike standard and the analysed amount that was acquired from the ELISA analysis. From the result demonstrated in , the percentage recovery of the method ranged from 99.13% to 109.43%, which was consistent with the satisfactory result stated by Lipton et al. (70%–120%) (Lipton et al., Citation2000). In addition, the intra- and inter-plate variations were performed to determine the method precision. The intra-plate percentage relative standard deviation (% RSD) was in the range between 1.63% and 9.86%, whereas inter-plate variation was between 2.51% and 8.41%. The data were considered to be of satisfactory repeatability when the percentages of intra- and inter-plate RSD were less than 10% and 15%, respectively (Minic & Zivkovic, Citation2020).
Table 1. Percentage cross reactivity of anti-licochalcone A monoclonal antibody (8F8).
Table 2. Accuracy and precision data of the anti-licochalcone A monoclonal antibody (8F8).
3.3. Sample determination
The natural root sample derived from Glycyrrhiza sp., plant tissue culture and products were extracted and analysed by ELISA. As shown in , the amount of LicoA found in natural roots ranged from 0.07 to 18.90 µg/g dry weight. According to the previous reports, licorice root typically contains 0.3%–1% (w/w) of LicoA (Kondo et al., Citation2007a). In the case of hairy root culture and the product samples, LicoA was found in a small amount, 0.17–6.46 µg/g dry weight. To ensure accuracy of the result, a standard analytical method as the HPLC-UV method was also employed. The result was compiled for analysis with the developed ELISA method (Pearson’s correlation equal to 0.991) as demonstrated in the supplementary material S1. Moreover, one sample derived from G. glabra found LicoA in a trace amount, which cannot be detected by the HPLC method. Based on a previous report by Kondo et al. (Citation2007b), licochalcones were found mainly in G. inflata (about 0.3–1% yield) but not in G. glabra. Therefore, the G. glabra sample analysed in this study may be the hybrid with G. inflata. With this data, it could prove that the ELISA method had a higher sensitivity than the HPLC method. Moreover, it could be used for the simple identification of licorice raw material, which is normally done by the investigation of a genetic marker.
Table 3. Determination of the licorice-derived sample and marketed product.
In general practice, the conventional HPLC with a UV detector is usually equipped for the determination of licorice active substance; however, the sensitivity of this method is not sufficient – in case that sample contained a small amount. Recently, the mass spectrometer is equipped to increase analytical sensitivity, but a major drawback is the complex sample preparation (Weng et al., Citation2019). Based on the specific reaction between antigen and antibody, an immunoassay principle can be applied for the determination of licorice actives substances, such as glycyrrhizin (Tanaka & Shoyama, Citation1998), glycyrrhetinic acid (Fujii et al., Citation2018) and liquiritin (Fujii et al., Citation2014). Since then, the ELISA method can be effectively applied to samples with high contaminants, such as food supplements, drinks, cosmetics and food additives. These methods allow analysis in a high-throughput screening format which makes the quality control process easier. Moreover, it can be developed as an immunochromatographic strip that allows a laboratory-free analysis (Putalun et al., Citation2005). Recently, LicoA – a pharmacologically active chalcone – is in the research focus, since it is well known for its strong anti-inflammatory activity and incorporation in skin products (Schoelermann et al., Citation2016). Moreover, LicoA is a specific marker indicated for species identification of licorice. It was reported to be found majorly in G. inflata, but not in other species (Fukuda et al., Citation2010). Therefore, the current study on the construction of anti-LicoA monoclonal antibody and its ELISA method can be applied for licorice species identification and the quality control of licorice-derived samples. Moreover, as a further study, the developed antibody can be utilized for the development of other immunoassay formats such as immunochromatographic strip, which is a user-friendly format with rapid detection of LicoA.
4. Conclusion
The current study successfully constructed an antibody against LicoA, an active substance in G. inflata. Besides, the monoclonal antibody was used to develop the ELISA method for the quantification of LicoA. The result from method validation exhibited acceptable accuracy and precision. Therefore, this study introduced the high sensitivity immunoassay method for LicoA determination, especially in the sample that contained traced amount of LicoA.
Supplemental Material
Download MS Word (13.8 KB)Disclosure statement
No potential conflict of interest was reported by the author(s).
Additional information
Funding
References
- Andreasson, U., Perret-Liaudet, A., Van, L. C., Blennow, K., Chiasserini, D., Engelborghs, S., Fladby, T., Genc, S., Kruse, N., Kuiperij, H. B., Kulic, L., Lewczuk, P., Mollenhauer, B., Mroczko, B., Parnetti, L., Vanmechelen, E., Verbeek, M. M., Winblad, B., Zetterberg, H., … Teunissen, C. E. (2015). A practical guide to immunoassay method validation. Frontiers in Neurology, 6, 179–186. https://doi.org/10.3389/fneur.2015.00179
- Chu, X., Ci, X., Wei, M., Yang, X., Cao, Q., Guan, M., Li, H., Deng, Y., Feng, H., & Deng, X. (2012). Licochalcone A inhibits lipopolysaccharide-induced inflammatory response in vitro and in vivo. Journal of Agricultural and Food Chemistry, 60(15), 3947–3954. https://doi.org/10.1021/jf2051587
- Fujii, S., Morinaga, O., Uto, T., Nomura, S., & Shoyama, Y. (2014). Development of a monoclonal antibody-based immunochemical assay for liquiritin and its application to the quality control of licorice products. Journal of Agricultural and Food Chemistry, 62(15), 3377–3383. https://doi.org/10.1021/jf404731z.
- Fujii, S., Uto, T., Nomura, S., & Shoyama, Y. (2018). Preparation of anti-glycyrrhetinic acid monoclonal antibody for application in an indirect competitive enzyme-linked immunosorbent assay. Analytical Letters, 51(8), 1147–1162. https://doi.org/10.1080/00032719.2017.1370598.
- Fukuda, E., Baba, M., Iwasaki, N., Uesawa, Y., Arifuku, K., Kamo, O., Tsubono, K., & Okada, Y. (2010). Identification of Glycyrrhiza species by direct analysis in real time mass spectrometry. Natural Product Communications, 5(11), 1934578X1000501. https://doi.org/10.1177/1934578X1000501111.
- Grodzki, A., & Berenstein, E. (2010). Antibody purification: Ammonium sulfate fractionation or gel filtration. In Oliver Constance & Jamur Maria Célia (Eds.), Immunocytochemical methods and protocols (pp. 15–26). Humana Press.
- Hayashi, H., Hosono, N., Kondo, M., Hiraoka, N., Ikeshiro, Y., Shibano, M., Kusano, G., Yamamoto, H., Tanaka, T., & Inoue, K. (2000). Phylogenetic relationship of six Glycyrrhiza species based on rbcL sequences and chemical constituents. Biological and Pharmaceutical Bulletin, 23(5), 602–606. https://doi.org/10.1248/bpb.23.602.
- Hosseinzadeh, S., Dastmalchi Saei, H., Ahmadi, M., & Salehi, T. (2020). Anti-quorum sensing effects of licochalcone A and epigallocatechin-3-gallate against Salmonella typhimurium from poultry sources. Veterinary Research Forum, 11(3), 273–279. https://doi.org/10.30466/vrf.2019.95102.2289
- Jean, J., Turcotte, C., Simard, R. E., & Fliss, I. (1999). Production and characterization of polyclonal antibodies against cholecalciferol (vitamin D3). Journal of Immunological Methods, 223(2), 155–163. https://doi.org/10.1016/S0022-1759(98)00215-4.
- Jia, T., Qiao, J., Guan, D., & Chen, T. (2017). Anti-inflammatory effects of licochalcone A on IL-1β-stimulated human osteoarthritis chondrocytes. Inflammation, 40(6), 1894–1902. https://doi.org/10.1007/s10753-017-0630-5.
- Kantikosum, K., Chongpison, Y., Chottawornsak, N., & Asawanonda, P. (2019). The efficacy of glycolic acid, salicylic acid, gluconolactone, and licochalcone A combined with 0.1% Adapalene vs Adapalene monotherapy in mild-to-moderate acne vulgaris: A double-blinded within-person comparative study. Clinical, Cosmetic and Investigational Dermatology, 12(1), 151–161. https://doi.org/10.2147/CCID.S193730
- Kondo, K., Shiba, M., Nakamura, R., Morota, T., & Shoyama, Y. (2007a). Constituent properties of licorices derived from Glycyrrhiza uralensis, G. glabra, or G. inflata identified by genetic information. Biological & Pharmaceutical Bulletin, 30(7), 1271–1277. https://doi.org/10.1248/bpb.30.1271.
- Kondo, K., Shiba, M., Yamaji, H., Morota, T., Zhengmin, C., Huixia, P., & Shoyama, Y. (2007b). Species identification of licorice using nrDNA and cpDNA genetic markers. Biological & Pharmaceutical Bulletin, 30(8), 1497–1502. https://doi.org/10.1248/bpb.30.1497.
- Krittanai, S., Buraphaka, H., Sakamoto, S., & Putalun, W. (2021). Enhancement of nutraceutical properties of licorice callus cultures using sample pre-treatment strategy. International Journal of Food Science & Technology, 56(11), 5843–5852. https://doi.org/10.1111/ijfs.15156.
- Li, L., Zhu, W., Yang, J., Liu, X., & Dong, Y. (2019). Rapid quantitative analysis of six flavonoids in licorice by ultra-performance convergence chromatography. Food Science and Technology, 39(2), 426–431. https://doi.org/10.1590/fst.09818.
- Lipton, C. R., Dautlick, J. X., Grothaus, G. D., Hunst, P. L., Magin, K. M., Mihaliak, C. A., Rubio, F. M., & Stave, J. W. (2000). Guidelines for the validation and use of immunoassays for determination of introduced proteins in biotechnology enhanced crops and derived food ingredients. Food and Agricultural Immunology, 12(2), 153–164. https://doi.org/10.1080/095401000404094.
- Minic, R., & Zivkovic, I. (2020). Optimization, validation and standardization of ELISA. In Gyula Mózsik (Ed.), Norovirus (1st ed., pp. 9–28). IntechOpen.
- Mishra, L. C., Bhattacharya, A., & Bhasin, V. K. (2009). Phytochemical licochalcone A enhances antimalarial activity of artemisinin in vitro. Acta Tropica, 109(3), 194–198. https://doi.org/10.1016/j.actatropica.2008.11.006.
- Putalun, W., Tanaka, H., & Shoyama, Y. (2005). Rapid detection of glycyrrhizin by immunochromatographic assay. Phytochemical Analysis, 16(5), 370–374. https://doi.org/10.1002/pca.862.
- Schoelermann, A. M., Weber, T. M., Arrowitz, C., Rizer, R. L., Qian, K., & Babcock, M. (2016). Skin compatibility and efficacy of a cosmetic skin care regimen with licochalcone A and 4-t-butylcyclohexanol in patients with rosacea subtype I. Journal of the European Academy of Dermatology and Venereology, 30(1), 21–27. https://doi.org/10.1111/jdv.13531.
- Shan, S. J., Tanaka, H., & Shoyama, Y. (2001). Enzyme-linked immunosorbent assay for glycyrrhizin using anti-glycyrrhizin monoclonal antibody and an eastern blotting technique for glucuronides of glycyrrhetic acid. Analytical Chemistry, 73(24), 5784–5790. https://doi.org/10.1021/ac0106997.
- Si, H., Xu, C., Zhang, J., Zhang, X., Li, B., Zhou, X., & Zhang, J. (2018). Licochalcone A: An effective and low-toxicity compound against toxoplasma gondii in vitro and in vivo. International Journal for Parasitology: Drugs and Drug Resistance, 8(2), 238–245. https://doi.org/10.1016/j.ijpddr.2018.02.006.
- Tanaka, H., & Shoyama, Y. (1998). Formation of a monoclonal antibody against glycyrrhizin and development of an ELISA. Biological & Pharmaceutical Bulletin, 21(12), 1391–1393. https://doi.org/10.1248/bpb.21.1391.
- Tsukiyama, R. I., Katsura, H., Tokuriki, N., & Kobayashi, M. (2002). Antibacterial activity of licochalcone A against spore-forming bacteria. Antimicrobial Agents and Chemotherapy, 46(5), 1226–1230. https://doi.org/10.1128/AAC.46.5.1226-1230.2002.
- Udomsin, O., Krittanai, S., Kitisripanya, T., Tanaka, H., & Putalun, W. (2017). A new highly selective and specific anti-Puerarin polyclonal antibody for determination of Puerarin using a Mannich reaction Hapten conjugate. Pharmacognosy Magazine, 13(52), 845–851. http://doi.org/10.4103/pm.pm_276_17
- Vdovenko, M. M., Gribas, A. V., Vylegzhanina, A. V., & Sakharov, I. Y. (2012). Development of a chemiluminescent enzyme immunoassay for the determination of dexamethasone in milk. Analytical Methods, 4(8), 2550–2554. https://doi.org/10.1039/c2ay25278c.
- Wananukul, S., Chatproedprai, S., & Charutragulchai, W. (2012). Randomized, double-blind, split-side comparison study of moisturizer containing licochalcone vs. 1% hydrocortisone in the treatment of infantile Seborrhoeic dermatitis: Licochalcone in infantile Seborrhoeic dermatitis. Journal of the European Academy of Dermatology and Venereology, 26(7), 894–897. https://doi.org/10.1111/j.1468-3083.2011.04187.x.
- Weng, Q., Chen, L., Ye, L., Lu, X., Yu, Z., Wen, C., Chen, Y., & Huang, G. (2019). Determination of licochalcone A in rat plasma by UPLC–MS/MS and its pharmacokinetics. Acta Chromatographica, 31(4), 262–265. https://doi.org/10.1556/1326.2018.00491.
- Xu, C., He, D., Zeng, L., & Luo, S. (2009). A study of adsorption behavior of human serum albumin and ovalbumin on hydroxyapatite/chitosan composite. Colloids and Surfaces B: Biointerfaces, 73(2), 360–364. https://doi.org/10.1016/j.colsurfb.2009.06.001.
- Yang, X., Jiang, Y., Yang, J., He, J., Sun, J., Chen, F., Zhang, M., & Yang, B. (2015). Prenylated flavonoids, promising nutraceuticals with impressive biological activities. Trends in Food Science & Technology, 44(1), 93–104. https://doi.org/10.1016/j.tifs.2015.03.007.