
ABSTRACT
Bananas (Musa spp.) enriched in resistant starch displayed multiple health benefits for diabetes. Here, we showed that banana starch administered to diabetic rats improved animal depressive-like behaviours of mood disorders. Four weeks of banana starch diet to high-sugar, high-fat, and STZ-induced diabetic rats lowered their blood insulin resistance, but increased their plasma HDL cholesterol and 5-HT levels, compared to the control groups of rats. The banana starch diet reconstructed the gut microbiota and increased their metabolite of butyrate, as well as increased the activity of superoxidase in diabetic rats. Furthermore, Banana starch intervention significantly increased the exhaustion time of the diabetic rats, and almost restored it to the normal state of control groups in their swimming and tail suspension tests. Together, our results indicated the modulation of the gut-microbiota-brain axis as a possible mechanism that enables the banana starch diet as a potential therapeutic way for diabetes-associated mood disorders.
Introduction
Banana (Musa spp.) is widely cultivated in tropical and subtropical regions and popularly consumed in the world. Unripe banana is enriched in resistant starch and other nutrients (i.e. potassium and ascorbic acid). Banana resistant starch has been reported to have multiple health benefits for diabetic patients, for example, attenuation of hypoglycaemic and hypolipidaemic functions (Mondal et al., Citation2021). The effect of bananas associated with its anti-diabetes functions was documented as inhibition of carbohydrate metabolic enzymes (Costa et al., Citation2019), dietary glucose absorption (Ara et al., Citation2020), and glucose transporters (Ramu et al., Citation2017) as well as improvement of insulin production and enhancement of insulin release activity of pancreatic β cells (Jaber et al., Citation2013). However, diabetes-induced multiple complications including cognitive and psychological dysfunctions (Rosado et al., Citation2020). Although the dietary intervention was reported to have a strong effect on diabetes-associated cognitive diseases (Wessels et al., Citation2011), no studies were reported about the effects of the banana diet on diabetes-induced psychiatric dysfunctions such as mood disorders.
Mood disorder is one of the complications of diabetes, the display incidence of mood disorder was significantly increased in diabetic patients, which became a universal challenge for human health life (Ravona-Springer et al., Citation2010). The pathophysiology of linking the two diseases is still under investigation. Previous studies showed that the diet could ameliorate type-2 diabetes-induced mood disorders, for example, diabetic mice administered fluoxetine or phlorizin significantly increased the mice’s lifespan by decreasing the mood disorders-associated levels of GSH, BDNF, TrkB, and ERK in the brain of mice (Grunberger et al., Citation2007). The root bark of Morus alba also improved depressive-like behaviours in diabetic rats by driving the expression of brain-derived neurotrophic factors (BDNF) (Bunner et al., Citation2015). Those studies and others implicated that proper diet is a potential therapeutic for diabetes-associated mood disorders, but the mechanisms among different diet functions are elusive.
Emerging studies indicated that the gut-microbiota-brain axis and diet played critical roles in the modulation of diabetes and its associated mood disorders as well as other neurodegenerative diseases (Liu et al., Citation2020). The gut-microbiota-brain axis refers to the bidirectional physiological connection among the gut, the microbiota, and the brain (Buin et al., Citation2020). Inside, the gut microbiota plays a vital role in linking gut function to brain function. Dysbiosis, an altered microbial profile favouring pathogenic microbes over beneficial ones in the gut, is often observed in diabetes (Santos et al., Citation2021), obesity (Hoogendoorn et al., Citation2019), Parkinson’s (Kamdi et al., Citation2021), and Alzheimer’s diseases (Ye et al., Citation2017). It is generally considered that diet functions on cognitive and psychiatric disorders via modulation of the gut-microbiota-brain axis by shaping the gut microbiota, thus affecting the associated diseases (Murciano-Brea et al., Citation2021).
The dietary pattern has a real-time effect on shaping gut microbiota profile. For example, Banana starch was reported to be able to lower Firmicutes to Bacteroidetes ratio and increase the short-chain fatty acids in faeces of normal rats (Martins et al., Citation2021). Probiotics, prebiotics, and diet were able to modulate the gut-microbiota-brain axis by changing the compositions of GI microbiota (Shi et al., Citation2020). Diet can affect exercise-induced stress behaviour and mood through modulation of the gut-microbiota-brain axis (Gao et al., Citation2020). In diet-induced obese mice, microbiota-accessible carbohydrates could prevent neuroinflammation and cognitive decline by improving the gut microbiota–brain axis (Kincaid et al., Citation2021). The gut microbiota profile changed by dietary intervention plays a critical role in the modulation of the gut-microbiota-brain axis.
Given many recent research works indicated that resistant starch and other dietary intervention linking the gut-microbiota-brain axis to cognitive and psychiatric disorders, we conducted a comprehensive study to investigate the effect of banana starch on diabetes-associated depressant-like mood disorders and related mechanisms in STZ-induced diabetic rats. In this study, banana powder with high content of resistant starch was well prepared. To determine the effect of dietary banana starch, the normal rat group and diabetic rat group with standard chow were applied as double control groups. Meanwhile, the banana diet was administered to diabetic rats with low (1 g/kg), middle (2 g/kg), and high doses (4 g/kg) of resistant starch, which were determined based on the dietary fibre levels for the prevention of type-2 diabetes. The World Health Organization (WHO) nutrition guideline indicated that the recommended intake of total dietary fibre was about 2.19 g/kg body weight. The analysis of gut microbiota, plasma and liver metabolites, and depressant-like behaviours was performed in all animal groups. One-way and two-way ANOVA methods were used for data analysis. The results of this study demonstrate the role of the gut-microbiota-brain in the effect of the banana starch diet on diabetes-induced mood disorders. Thus, a banana with high content of resistant starch is a potential therapeutic for diabetes-induced mood disorders.
Materials and methods
Banana powders preparation
The raw banana starch was prepared from unripe (green) bananas (Musa spp. ABB Group, Dongguan dajiao, China). Briefly, after washing, the bananas were peeled, cut into 3–4 cm3 pieces, and immediately macerated in the colour protecting solution composed of sodium sulphite anhydrous (0.05%), citric acid (0.4%) and vitamin C (0.1%). The homogenate was then centrifuged at 4000 rpm/min for 10 min. Sediments were further purified by washing and centrifuged twice with the above solution. The white starch sediments were dried in a spiral vibrofluidized bed model dryer at 40–45°C, passed through a 100-mesh screen after pulverization, and then stored at room temperature using the vacuum package. The nutritional and functional components of the banana powder products with high content of resistant starch were analysed in the lab ().
Table 1. The major nutritional and functional components of banana powder products.
Animals and diabetic animal model
Sprague–Dawley male rats, male, weighing 80∼90 g, were purchased from Guangdong Experimental Animal Centre. They were raised in the Laboratory Animal Centre of Guangzhou University of Chinese Medicine with SPF grade, a temperature of 25°C, a humidity of 60%, and given standard laboratory feed and free drinking water. The diabetic rat’s model was established by high glucose and a high-fat diet (20% more sugar, 10% more egg yolk, and 10% more lard) combined with streptozotocin (STZ). The rats were first fed with high sugar and high-fat diet for 4 consecutive weeks. After fasting for 12 h, the rats were injected with STZ (30 mg/kg, dissolved in 0.1 mmol/l citric acid buffer, pH 4.4, ice bath, ready for use, used up within 5 min) interperitoneally into the left lower abdominal cavity. The normal control group was injected with citric acid buffer (0.1 mmol/l, pH 4.4) of a dose of 1 ml/kg at the same time. The fasting blood glucose (FBG) of rats was measured after 72 h STZ treatment. Diabetes was determined as rats with FBG > 16.6 mmol/l in three independent measurements.
Banana starch (BS) intervention
Sprague–Dawley male rats were divided into normal control group (n = 10, non-diabetic, no BS), standard chow group (n = 10, diabetic, no BS), low-dose banana powder group (n = 10, diabetic, 1 g BS/kg), medium-dose group (n = 10, diabetic, 2 g BS/kg), and high-dose banana powder group (n = 10, diabetic, 4 g BS/kg). The rats in the normal control group and standard chow group were intragastrically fed with normal saline once a day for 4 weeks, and the rats in the low-, middle-, and high-dose banana powder groups were fed with the specified dose of BS once a day for up to 4 weeks. Each group was given free drinking water and general feeding prepared according to the AIN-93G standard (Reeves et al., Citation1993), and the high-sugar and high-fat feed were slightly modified based on the AIN-93G with 20% more sugar and 20% more fat (10% more egg yolk and 10% more lard).
Bodyweight, urine output, food, and water intake measurement
During the experiment, the amount of food intake, water intake, urine output, and body weight of each rat were recorded once a week, and blood samples were taken from the tip of the tail every week to determine the fasting blood glucose value after 12 h of fasting for each group.
Oral glucose tolerance test
After the intervention of banana powder for 4 weeks, an oral glucose tolerance test was carried out. The rats were fed with glucose solution (2.1 g/kg) after fasting for 5 h. The blood glucose level was measured at 0, 30, 60, and 120 min after intragastric administration.
Blood collection and analysis
After 4 weeks of BS intervention, 5 ml of blood was taken from the abdominal aorta. After automatic coagulation, 3000 rpm/min and centrifugation for 10 min, the serum was obtained and frozen in the refrigerator at −80°C for standby. The total cholesterol, high-density lipoprotein cholesterol, low-density lipoprotein cholesterol, and triglyceride in serum were measured by the automatic biochemical analyser.
Five millilitres of blood was collected from EDTA-K2 anticoagulant blood collection vessels, and plasma was obtained after centrifugation. Fasting insulin concentration was measured by insulin enzyme-linked immunosorbent assay (Cat #RVE-BX-96, Northern Biological Institute). The steady-state model was used to calculate and compare the insulin sensitivity index and insulin resistance index of each group.
One millilitre of blood was placed in an EDTA-K2 anticoagulant tube and centrifuged at room temperature at 2000 rpm/min for 15 min to obtain platelet-rich plasma (PRP). PRP was taken again at 4°C for 2000 rpm/min, centrifuged for 10 min, and the supernatant was discarded to obtain platelets. Double-antibody sandwich method (Cat# JN20707, Shanghai Jining Shiye Co.) was used to determine the level of 5-HT in the samples. On the other hand, orbital blood samples were taken from SD rats every week. One millilitre of blood was placed in an EDTA-K2 anticoagulant tube and centrifuged at room temperature at 2000 rpm/min for 15 min to obtain platelet-rich plasma (PRP). PRP was taken again at 4°C, centrifuged at 2000 rpm/min for 10 min, and platelets were removed from the supernatant. The level of 5-ht in the samples was determined by the double-antibody sandwich method (Cat# JN20707, Shanghai Jining industrial co., LTD.).
Liver enzyme and SEM analysis
After the intervention of banana powder for 4 weeks, fasting overnight and anaesthesia dissection, rat livers were taken out to clean the bloodstain, cut it into pieces, and incubated in a preprepared 10% of saline solution. After the liver homogenate was centrifuged at 2000 rpm/min for 10 min, the activities or contents of liver glycogen, free fatty acids, total bilirubin, superoxide dismutase, malondialdehyde, lactate dehydrogenase, aspartate aminotransferase, and glutamate aminotransferase as well as total protein and albumin were determined and calculated by immunoassay kits provided by the Nanjing Jiancheng Bioengineering Institute. At the same time, the activities of hexokinase, pyruvate kinase, malate dehydrogenase, succinate dehydrogenase and glucose-6-phosphatase were also determined by fluorescence kits provided by the same institute.
On the other hand, the liver and pancreas were removed and washed with normal saline, soaked in 4% formaldehyde solution for fixation, block repair, water washing, dehydration, transparency, wax immersion and paraffin embedding, paraffin section, HE staining, and sealing. The prepared HE stained sections were placed under the optical microscope to observe the pathological changes from low magnification to high magnification.
Small intestine analysis
The small intestine of all group rats was cut open to expose the intestinal mucosa, washed with cold saline and dried, and the small intestine was scraped with cover slides to make tissue homogenate in 10% saline buffer with a final concentration of 0.1 g/mL, which was used to measure the activities of maltase, sucrase, and α-amylase.
Swimming training and weight-bearing swimming test (WST)
After the intervention experiment, swimming training was conducted for the weight-bearing swimming experiment and forced swimming experiment. Rats in each group were trained in standing water with a diameter of 100 cm and a water depth of 50 cm, and the water temperature was kept at (25 ± 1)°C. The training duration is 20 min on the first day, 40 min on the second day, and 60 min on the third day. The rats that could not swim (repeatedly submerged in water during swimming training) were excluded.
The WST share similar mechanisms of FST and TST to evaluate depression. Seven rats from each group were used for WST. In the test, tails of the rats were attached with farmers for about 5% weight of each rat. The effort time is calculated until the head maintains 10s under the surface of the water from the beginning.
Forced swimming test (FST)
This test is generally used in translational depression research, now used to evaluate depression-like behaviours. The test is based on the repeated exposure to a barred swim under the same test conditions within a 24-h interval. If an animal spent a longer time floating during the second test, it is regarded as having the most sensitive sign of “behavioural despair”. The re-exposure animal intended to produce a state of learned helplessness in the original situation is considered to have a behavioural hallmark of depression.
In this study, seven rats were placed in a cylinder (height 70 cm, diameter 15 cm) filled with tap water (25°C). Each of the groups was taken a pre-test for an initial 15 min. The procedure was repeated 24 h later for a 5-min test session. Rats were completely dried, and the cylinders were filled up with tap water after each test. The time that rats spent swimming, struggling, and floating was recorded. Immobility behaviour in the test means rats have no movement but keep their heads over the water. Climbing behaviour in the test means rats have vigorous limb movement and attempt to climb up on the cylinder. Swimming behaviour in the test means rats have free movement with all four limbs under water.
Tail suspension test (TST)
The test was first introduced in 1985 to measure the potential effectiveness of Ads. The theoretical basis and behavioural measurement of TST are like those of FST. In the test, animal tails suspended are recorded as the time of immobility. Generally, the suspended animal tails immediately have agitation- or escape-like behaviours, followed by a temporally immobile posture. If the tail immobile time is decreasing, the animal was considered to have depressant-like behaviours.
In our study, seven rats were selected in each control. Each rat was suspended for 6 min, and the cumulative immobility time in the 5 min (immobility means that all the limbs of the rats were immobile except for breathing) and longest single resting time (s) were recorded.
Gut microbiome determination
Faecal samples were collected from each group. The total cellular DNA was extracted with a commercial DNA extraction kit from Kangwei Century Biotechnology Co., Ltd according to the kit instructions. The kit protocol furnished the final genomic DNA samples with a concentration of about 10 ng/µL for further PCR reactions.
The gene sequences of Enterococcus, Enterobacter, Bifidobacterium, Bacteroides, and Lactobacillus were selected for analysis. The corresponding PCR primers () were designed to target the bacterial hypervariable V3-V4 region of 16S rRNA. The PCR reactions were performed with a CFX96Tmreal-time system (Bio-Rad). The PCR products with their specific barcodes and adapters were sequenced by the Illumin MiSeq platform. The copy numbers of Enterococcus, Enterobacter, Bifidobacterium, Bacteroides, and Lactobacillus in the samples were obtained according to the standard curve and the Ct value of the samples by real-time fluorescence quantitative PCR, through the preparation of the plasmid standard and the faecal bacterial DNA samples.
Table 2. The PCR primer sequence, size, and annealing temperature of selected gut microbiota of Lactobacillus, Bifidobacterium, Enterococcus, Enterobacteria, and Bacteroides.
SCFAs assays
The levels of SCFAs (acetate, propionate, and butyrate) were analysed by Gas Chromatograph7890 (Agilent Technology Co., Ltd) equipped with a chromatographic ZB-WAX column (30 m × 0.25 μm × 0.25 mm) and flame ionization detector. In the analysis of SCFAs in the gut colon, 0.3 g of colon extracts were homogenized with 1.5 mL of PBS buffer (pH 6.5), then centrifuged at 10,000 rpm/min (4°C, 10 min). 300 μl H2SO4 (1%) was added to the 100-μl supernatant. The mixture was refluxed at 70°C for 30 min, then extracted with 300 μl cold hexane. Two microlitres of the organic phase was analysed by gas chromatography. The initial temperature was 100°C, then raised to 200°C at 2°C /min. The column was maintained at this temperature for 20 min. The same procedure was used for the treatment of standard SCFAs (acetate, propionate, and butyrate, 25 mmol/L). The total SCFAs were calculated based on the sum of these three acids. On the other hand, the analysis of SCFAs in faecal is like that of the gut colon, except for the sample treatment. Briefly, 200 mg of foetal sample was homogenized with 1 ml of distilled water, and then 0.1 ml of 50% H2SO4(w/w) and 1.5 ml of diethyl ether were added. The mixture was incubated at 4°C for 30 min, then centrifuged at 6000 rpm/min for 5 min. The organic phase was collected and followed by GS analysis as described.
HE staining
The rat pancreas and liver tissues were washed with saline buffer (pH 7.2), and fixed with a 4% methyl aldehyde solution. After being washed and dried, the tissues were embedded in paraffin for staining with haematoxylin and eosin to observe the histopathological changes. The HE staining images were obtained by an inverted microscope (×800).
Statistical analysis
Besides RNA sequencing and gut microbiome, all other test data were expressed as mean ± standard deviation (SD). Statistical analyses were performed by SPSS 1.7.3 statistical software. The differences between mean values were compared by Student’s t-test and one-way ANOVA. The data for banana dietary intervention experiments were determined by two-way ANOVA with different banana starch doses as factors. The post hoc test was carried out using Schiffer’s test for multiple comparison test by GraphPad Prism 6.0 software. Statistically significant means were reported if p < 0.05.
Animal test declaration
All experimental protocols were approved by the Laboratory Animal Centre of Guangzhou University of Chinese Medicine. Guangzhou University of Chinese Medicine has been granted the license for the use of experimental animals by the Department of Science and Technology of Guangdong Province, according to the “Regulations on the Management of Experimental Animals in Guangdong Province”. The license number currently valid is SCXK (Guangdong) 2018-0034.
All methods were carried out in accordance with the Regulations on the Management of Experimental Animals and The Measures for the Quality Control of Experimental Animals enacted by The State Council of the People's Republic of China. The animal experiment scheme, experiment purpose, experiment method, observation index, and the method of killing animals after the experiment are in line with animal protection, animal welfare, and ethical principles, as well as the relevant provisions of national experimental animal welfare ethics. All animals were kept in a pathogen-free environment and fed ad lib. The procedures for care and use of animals were approved by the Ethics Committee of the Animal Care Welfare Committee of Guangzhou University of Chinese Medicine, and all applicable institutional and governmental regulations concerning the ethical use of animals were followed.
All methods are reported in accordance with ARRIVE guidelines
Results
Banana powder significantly improved the body weight and food intake parameters of high-sugar, high-fat, and STZ-induced diabetic rats
Compared to the Normal group of rats, the STZ-induced rats not only showed symptoms of eating more, drinking more, urinating more, and weight loss, but also were slow responsive to capture and less active to curl up. With the progress of diabetes, the above symptoms were becoming worse with apparent behaviour disorders. However, in the banana starch (BS) fed a group of diabetic rats, those symptoms were significantly improved.
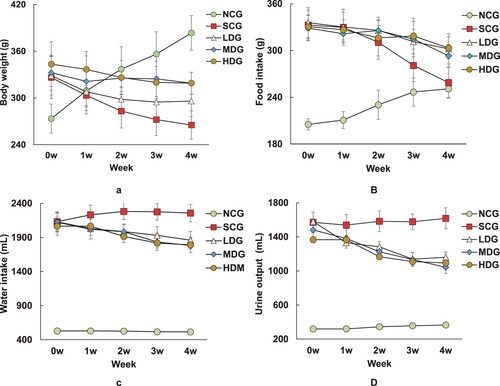
At the beginning of the animal experiments, the body weight, food intake, water intake, and urine output of diabetic rats had no significant difference, except for the normal control group (NCG). After 1 week of diet administration, the body weight, food intake, water intake, and urine output of each diabetic group with BS intervention were apparently higher than the SC diabetic group (10%, p < 0.05) ((A–D)). The increasing trend lasted till 4 weeks of diet administration (35%, p < 0.05), and a higher dose of BS intervention apparently had a stronger effect on the body weight and food intake ((A,B)). After 2 weeks of BS intervention in the diet, the bodyweight of LDG rats was significantly higher than the SC group (9%, p < 0.05), and that of MDG and HDG rats weighted more than 19% than the SC rats ((A)). The food intake of LDG and MDG rats was 7% higher than the SC rats, while that of the HDG rats had no significant difference with the SCG rats ((B)). The water intake and urine output of all BP intervention groups have no statistical difference, but all are higher than the SC rats (10%, p < 0.05) ((C,D)). After 4 weeks of experiments, the body weights of all LDG, MDG and HDG rats stayed relatively stable during 2–4 weeks of BS diets, but were higher than that of SCG rats (12% for MDG and HDG, 23% for LDG, p < 0.05) ((A)). The food intake of the normal control group and the SCG group had no significant changes, but was still much higher than the SCG rats (12%, p < 0.05) ((B)). The water intake and urine output of all BS intervention rats still had no difference significantly, but were lower than the SCG rats (16%, p < 0.05) ((C,D)). No cross-reaction of diet and treatment was observed as demonstrated by the NCG rats’ parameters. Thus, the BS diet affected the body weight and food intake parameters of diabetic rats independently.
Figure 1. Effects of banana powder intervention on body weight, food intake, water intake and urine output in normal control group of non-diabetic rats (NCG), standard chow (SCG), and low (LDG), middle (MDG), and high dose (HDG) of banana starch intervention diabetic rats. (A) Bodyweight; (B) Food intake; (C) Water intake; (D) Urine output.
The banana starch diet decreased the fasting blood glucose level and improved glucose tolerance in high-sugar, high-fat, and STZ-induced diabetic rats
The fasting blood glucose levels of diabetic rats were significantly higher than the NCG rats at the beginning of the experiments (260%, p < 0.05). While the NCG rats stayed stable fasting blood levels on diet, the SCG rats showed slightly higher blood glucose level during the experiment periods (18.7–23.9 mmol/L after 4 weeks of diet). The fasting blood glucose levels of BS intervention group rats were decreased with time with a slight dose response. After 4 weeks of experiments, the fasting blood glucose of the BS intervention groups was significantly lower than that of the SCG group (54%, p < 0.05), but still higher than that of the NCG rats (180%, p < 0.05) ((A)).
Figure 2. Effect of banana starch diet on fasting blood glucose (FBG) of normal control group of non-diabetic rats (NCG), standard chow (SCG), and low (LDG), middle (MDG), and high dose (HDG) of banana starch intervention diabetic rats. (A) FBG levels in each rat group during 4 weeks of experiments; (B) The area under the FBG curve for each group; (C) The oral glucose tolerance test results of each group within a period of 120 min experiments.
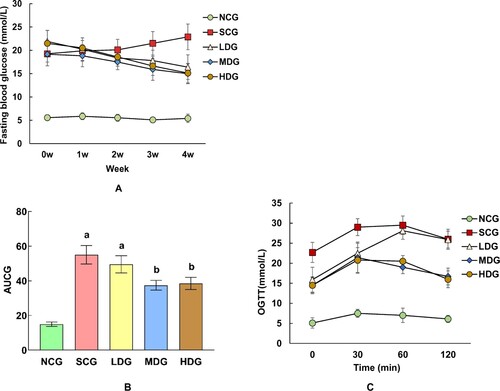
On the other hand, compared with SCG rats, the oral glucose tolerance test (OGTC) results indicating that glucose tolerance of LDG, MDG, and HDG rats had larger AUC of 7%, 12%, and 16% (p < 0.05), respectively ((B,C)), whereas the NCG rats had little glucose tolerance. The results were in accordance with the above-glucose-level experiment results, which demonstrated that the BS diet affected the glucose metabolism independently without interactions. Particularly, a higher dose of BS diet had a stronger effect on glucose metabolism in diabetic rats. BS helped improving glucose tolerance in diabetic rats, although it did not bring it back to normal glucose levels.
Banana powder improved blood insulin and cholesterol metabolism in high-sugar, high-fat, and STZ-induced diabetic rats, independent of insulin secretion
The blood insulin and cholesterol levels of each group of rats were measured as shown in . The insulin levels of diabetic rats are higher than that of NCG non-diabetic rats (110%, p < 0.05). Accordingly, compared with the NCG rats, the insulin resistance index of the diabetic rats after BS intervention was significantly increased (120%, p < 0.05), and the insulin sensitivity index was significantly decreased (44%, p < 0.05). There was no significant difference among the diabetic rats after BS intervention. The results indicated that the intervention of banana powder could improve insulin resistance in diabetic rats, independent of insulin secretion.
Table 3. Effect of Banana starch on blood insulin and cholesterol levels of normal control non-diabetic rats (NCG), standard chow diabetic rats (SCG), low dose of banana starch diabetic rats (LDG), middle dose of banana starch rats (MDG), and high dose of banana starch diabetic rats (HDG).
On the other hand, the total cholesterol and triglyceride levels of non-diabetic rats in NCG are significantly lower than that of diabetic rats in SCG, LDG, MDG, and HDG. Particularly, the LDL cholesterol level in NCG non-diabetic rats is significantly lower than that of LDG diabetic rats (310%, p < 0.05), and the LDL cholesterol levels of diabetic rats with BS intervention (LDG, MDG, and HDG) are significant than that of SCG. This kind of difference is not observed in the examination of HDL cholesterol in all rats. The results showed that the intervention of banana powder could reduce the cholesterol level in diabetic rats, independent of cholesterol intake.
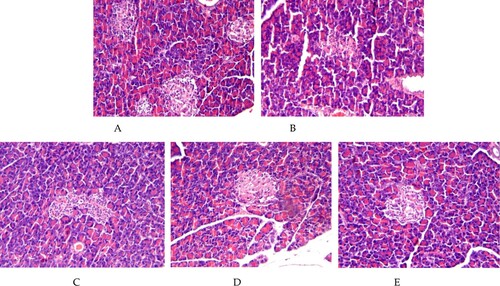
Furthermore, the pancreas tissue of all rats were treated and their HE staining images are shown in . Although diabetes damaged the rats’ pancreas ultrastructure, the BS intervention apparently attenuates such damages with a dose response.
Figure 3. HE staining imaging of rat pancreatic tissues from normal control group of non-diabetic rats (NCG), standard chow (SCG), and low (LDG), middle (MDG), and high dose (HDG) of banana starch intervention diabetic rats.
Banana powder enhanced the antioxidation capacity in livers of high-sugar, high-fat, and STZ-induced diabetic rats
Various liver metabolism-associated parameters in different rat groups were measured and the results are shown in . The content of liver glycogen in non-diabetic NCG rats was significantly higher than that of diabetic rats of SCG (240%, p < 0.05), but the BS intervention significantly increased the liver glycogen level of LDG rats, as compared to the SCG rats without apparent dose response (95%, p < 0.05). Thus, the transformation capacity of liver glycogen was increased by the BS diet in diabetic rats.
Table 4. Effect of Banana starch on liver levels of SOD, MIDA,Free fat acid, total bilirubin, LDH, AST, ALT, TP, ALB, HK, PK, MIDH, SDH, G-6-P in normal control non-diabetic rats (NCG), standard chow diabetic rats (SCG), low dose of banana starch diabetic rats (LDG), middle dose of banana starch rats (MDG), and high dose of banana starch diabetic rats (HDG).
On the other hand, the level of liver Superoxide Dismutase (SOD) in NCG rats was apparently higher than that of SCG rats (149%, p < 0.05). However, BS intervention significantly increased the SOD activity of LDG rats compared to SCG rats (39%, p < 0.05), and this increasing trend apparently had a dose response as compared to the SOD levels of MDG and HDG rats. Furthermore, compared to LDG rats, BS intervention decreased the level of malondialdehyde (MDA) in LDG diabetic rats (32%, p < 0.05). Also comparing the SCG rats to LDG rats, BS could significantly decrease the levels of free fatty acids (24%, p < 0.05), total bilirubin (7%, p < 0.05), lactate dehydrogenase (LDH) (19%, p < 0.05), transaminase (AST) (17%, p < 0.05), alanine aminotransferase (ALT) (30%, p < 0.05), total protein (TP) (25%, p < 0.05), and albumin (ALB) (28%, p < 0.05). The decreasing trend had slight dose responses as demonstrated in the data of MDG and HDG rats. Therefore, the A/G ratio of LDG rats was significantly increased than that of SCG rats (373%, P < 0.05), which indicated that BS intervention could delay the disorder of liver function and reduce the injury of hepatocytes in diabetic rats.
Compared to non-diabetic NCG rats, the activities of hexokinase (HK) and pyruvate kinase (PK) in the SCG diabetic rats significantly decreased by 77% and 39%, (p < 0.05), respectively. However, compared with the SCG diabetic rats, the activities of HK and PK in the BS intervention group (i.e. LDG) were significantly increased (HK93%, PK11%, p < 0.05) without apparent dose responses. The results suggested that banana starch could change the activity of HK and PK in the glycolytic pathway, promote the phosphorylation of glucose, and thus improve the glucose metabolism in diabetic rats.
Moreover, compared to non-diabetic NCG rats, the activity of malate dehydrogenase (MDH) and succinate dehydrogenase (SDH) in the SCG diabetic rats decreased significantly (MDH 61%, SDH 72%, p < 0.05). However, compared to the SCG rats, the diabetic rats with banana starch intervention had almost no significant changes of the activity of MDH and SDH. The results indicated that banana starch intervention had no significant effect on the MDH- and SDH-involved tricarboxylic acid cycle pathway of glucose metabolism in diabetic rats.
Furthermore, the G-6-P activity of rat livers in SCG diabetic rats was dramatically increased, compared to NCG non-diabetic rats (302%, p < 0.05). However, the BS intervention could decrease the G-6-P activity of the livers in diabetic rats (22%, LDG vs. SCG p < 0.05). This indicated that the BS intervention could inhibit gluconeogenesis and glycogen decomposition in the liver of diabetic rats.
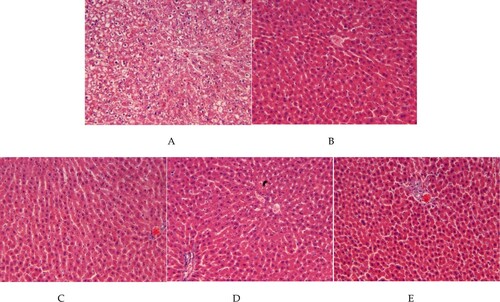
This result was also consistent with the HE stains imaging of hepatic tissues of each group of rats (). As shown in , BS intervention attenuates the hepatic damage of liver tissues (LDG/MDG/HDG vs. SCG), although BS intervention was not able to restore the live function of diabetic rats to normal level (vs. NCG rats)
Figure 4. HE staining imaging of rat hepatic tissues from normal control group of non-diabetic rats (NCG), standard chow (SCG), and low (LDG), middle (MDG), and high dose (HDG) of banana starch intervention diabetic rats.
BS intervention significantly increases the intestinal key enzymes of glucose metabolism and SCFA in high-sugar, high-fat, and STZ-induced diabetic rats
The rats’ intestinal key enzymes were isolated and purified as described. The activities of three key enzymes of maltase, sucrase, and α-Amylase in the intestine were analysed. The three enzymes are majorly responsible for the transformation of starch to glucose in the intestine. The experimental data are summarized in . Not surprisingly, the activities of maltase, sucrase, and α-amylase in the small gut mucosa of the non-diabetic NCG rats were significantly higher than those of the SCG diabetic rats by 80%, 77%, and 265% (p < 0.05), respectively. The results indicated that general starch is easy to cause the rise in blood glucose after meals in diabetes. However, in the tests of diabetic rats, compared to the SCG rats, the activities of maltase, sucrase, and α-amylase in the BS intervention LDG group were decreased by 16%, 20%, and 12% (p <0.05), respectively. The decreasing trend slightly went with the increase of BS intervention dose. The results suggested that the BS diet had an inhibitory effect on the activity of the key enzyme of sugar absorption in small gut mucosa in diabetic rats.
Table 5. Effect of Banana starch on gut levels of maltase, sucrase, a-amylase, SCFA, pH in normal control non-diabetic rats (NCG), standard chow diabetic rats (SCG), low dose of banana starch diabetic rats (LDG), middle dose of banana starch rats (MDG), and high dose of banana starch diabetic rats (HDG).
At the same time, the SCFA in their intestine were checked as shown in . The total SCFA in SCG diabetic rats were significantly lower than that of NCG non-diabetic rats (42%, p < 0.05). However, BS intervention apparently increased the SCFA in diabetic rats with a dose response (LDG83%, MDG178%, HDG236%, vs. SCG, p < 0.05). BS intervention also slightly reduced the pH values in the intestine of diabetic rats (i.e. pH7.79 for SCG vs. pH6.98 for LDG).
Table 6. Effect of Banana starch on gut SCFA levels of acetic acid, propionic acid, and butyrate in normal control non-diabetic rats (NCG), standard chow diabetic rats (SCG), low dose of banana starch diabetic rats (LDG), middle dose of banana starch rats (MDG), and high dose of banana starch diabetic rats (HDG).
The banana starch intervention reduced the 5-HT level of blood platelets in high-sugar, high-fat, and STZ-induced diabetic rats
5-HT is a sensitive indicator of a depressant state. The level of 5-HT in blood platelets is close to that of the brain in animals (Crowell & Wessinger, Citation2007; O'Mahony et al., Citation2010). In the experiments, levels of platelet 5-HT in different dose groups were analysed by immunoassays (EFXER 00123, Nanjing Yifei Biotech Co.), and the results are included in and . Diabetes induced a significant elevation of platelet 5-HT level, which was increased by 155% (p < 0.05) in diabetic SCG rats, compared to NCG non-diabetic rats. On the other hand, BS intervention demonstrated a significant reduction of 5-HT level, which was decreased by 21% (p < 0.05) in LDG rats, compared to SCG rats (). Two weeks after BS intervention, the level of 5-HT in the non-NCG group was significantly decreased, and the decreasing trend continued during 4 weeks of experiments (). The results indicated that the BS intervention has potential inhibition on 5-HT expression in depressant-like animals. BS intervention could improve peripheral neuropathy and potentially inhibit the expression of 5-HT in depressed animals, thus improving the comprehensive symptoms of diabetes.
The banana starch intervention changed the faecal gut microbiota and SCFA in high-sugar, high-fat, and STZ-induced diabetic rats
Five gut microbiotas (GM), Lactobacillus, Bifidobacterium, Enterococcus, Enterobacteria, and Bacteroides were chosen for evaluation, and the data are presented in . Compared to the GM of non-diabetic NCG rats, the GM profile of the SCG diabetic rats was changed, in that the copy numbers of Bifidobacterium and Lactobacillus were decreased by 44% and 69% (p < 0.05), respectively. Whereas the copy numbers of Enterococcus, Enterobacteria, and Bacteroides increased by 162%, 83%, and 219% (p < 0.05), respectively. However, compared to the SCG rats, the copy number of Bifidobacterium and Lactobacillus were significantly increased, while that of Enterococcus, Enterobacteria, and Bacteroides significantly decreased. Both increasing and decreasing trends had apparent dose responses. The results suggested that the BS diet had promoted effect on the probiotic bacteria such as Bifidobacterium and Lactobacillus, while has an apparent inhibitory effect on the bad bacteria such as Enterococcus, Enterobacteria, and Bacteroides.
Table 7. Effect of banana starch on gut microbiota growth of Lactobacillus, Bifidobacterium, Enterococcus, Enterobacteria, and Bacteroides in normal control non-diabetic rats (NCG), standard chow diabetic rats (SCG), low dose of banana starch diabetic rats (LDG), middle dose of banana starch rats (MDG), and high dose of banana starch diabetic rats (HDG).
It is known that probiotic bacteria of Bifidobacterium and Lactobacillus are favouring growth in acidic conditions. This is well correlated with the previous results in and , in which BS intervention increased the total amount of SCFA and decreased the pH values in the colon of diabetic rats. It indicated that the BS diet as a prebiotic could promote the growth or activity of beneficial microorganisms in the colons of diabetic rats.
The checking of the faecal levels of each individual SCFAs such as acetic acid, propionic acid, and butyrate in the BS intervention rats last 4 weeks, and the data are presented in . After 4 weeks of BS interventions, the levels of acetic and propionic acids were significantly increased in dose response. For example, the acetic acid level was increased by 370% (p < 0.05) in HDG rats, compared to 91% (p < 0.05) in LDG rats. The propionic acid level was increased by 277% (p < 0.05) in HDG rats, compared to 68% (p < 0.05) in LDG rats.
The acetic acid content in each dose group was negatively correlated with blood glucose concentration () (low-dose group: r = 0.980, p = 0.002; medium-dose group: r = 0.985, p = 0.001; high-dose group: r = 0.999, p = 0.001); The correlation between propionic acid content and blood glucose concentration in each dose group was not consistent. The propionic acid content in the middle- and high-dose groups was significantly negatively correlated with the blood glucose concentration, and there was no correlation between propionic acid content and blood glucose concentration in the low-dose group; the correlation between butyric acid content and blood glucose concentration was also not consistent in each dose group, among which the butyric acid content in the high-dose group was significantly correlated with blood glucose concentration (low-dose group: r = 0.871, p = 0.027; medium-dose group: r = 0.826, p = 0.042; high-dose group: r = 0.960, p = 0.005).
BS intervention improved the mental state of high-sugar, high-fat, and STZ-induced diabetic rats
The mental state of diabetic rats under BS intervention was checked by their depressive-like behaviours, such as weight-bearing swimming tests (WST), forced swimming tests (FST), and tail suspension tests (TST) ( and ). The exhaustive swimming time recorded in FST means the time rats used from swimming to exhaustion which is a common indicator of exercise ability.
Figure 5. Effect of banana powder intervention on mental behaviours in normal control group of non-diabetic rats (NCG), standard chow (SCG), and low (LDG), middle (MDG), and high dose (HDG) of banana starch intervention diabetic rats. (A) Comparison of exhaustive swimming time in each group, (B) Comparison of the behaviours of Immobility Behaviour Counting (IBC), Swimming Behaviour Counting (SBC), Cumulative Immobility Counting (CBC) in each group in the forced swimming test. (C) Comparison of the behaviours of AFT and MSRT in each group in the tail suspension test.
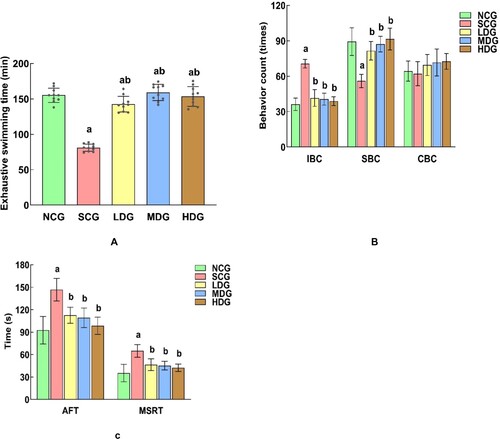
Table 8. Effect of Banana starch on depressive-like behaviours of exhausting swimming, forced swimming and tail suspension tests in normal control non-diabetic rats (NCG), standard chow diabetic rats (SCG), low dose of banana starch diabetic rats (LDG), middle dose of banana starch rats (MDG), and high dose of banana starch diabetic rats (HDG).
The exhaustion time of rats in SCG diabetic rats was significantly lower than that in the NCG rats (91%, p < 0.05). However, BS intervention significantly increases the exhaustion time of the diabetic rats (75%, p < 0.05), and almost restores to the normal state (MDG vs. NCG). The result indicated that BS intervention can prolong the exhaustion time and improve the exercise endurance of diabetic rats.
In the evaluation of rats’ other behaviours, while diabetes-induced longer immobility behaviour (95%, p < 0.05, NCG vs. SCG), BS intervention apparently reduces their immobility behaviour (70%, p < 0.05, LDG vs. SCG) with a slight dose response. The enhancing effect of BS intervention was also observed in the evaluation of rats’ swimming behaviours (46%, p < 0.05, LDG vs. SCG). However, there was no difference in climbing behaviours for all rats.
In summary, diabetes increased the rats’ cumulative immobility behaviour time, while decreased their longest single resting time (SCG vs. NCG). In both cases, BS intervention significantly ameliorated both behaviours without the apparent BS dose response.
Discussion
In this study, we conducted comprehensive studies of banana starch intervention on high-sugar, high-fat, and STZ-induced diabetic rats. We found that the BS intervention significantly lowered the insulin resistance index by 25% in diabetic rats, compared to the control groups of rats, although the total insulin levels in rats remain relatively stable. The metabolic products of HDL cholesterol were increased by 164%, while LDL cholesterols were reduced by 50%, compared to the control groups of rats. The triglyceride level in diabetic rats remains relatively stable. Compared to the group, we also showed that BS significantly enhanced the antioxidant function of diabetic rats as evidenced by increasing the SOD activity by 40%, a key enzyme responsible for the live anti-oxidative function. However, BS lowered the enzymatic activities of LDH, AST, and ALT, which implied that the TCA cycle is not important in the BS-mediated anti-depressant function, although the glycogen level was significantly increased by 99% after the BS diet treatment in diabetic rats. In addition, compared to the control groups of rats, dietary starch in 4 weeks altered microbiome diversity in diabetic mice and increased the abundance of the probiotic Lactobacillus and Bifidobacterium. We also found that Banana starch increased the faecal levels of acetate and butyrate, but not propionate. The levels of faecal SCFAs, particularly butyrate, were well correlated with plasma glucose metabolism in the 4-week monitoring period of the treated rats. Furthermore, compared to the control groups of rats, banana starch increased plasma platelets’ 5-HT levels by 21%, a key hormone/neurotransmitters in the regulation of the gut-brain axis (Crowell & Wessinger, Citation2007; O'Mahony et al., Citation2010). Finally, we first reported that banana powder can improve the health condition of diabetes-induced mood disorders in mice. Banana starch significantly improved diabetic rats’ swimming behaviour times 46%, while reducing their immobility behaviours by 41%, compared to the control groups of rats. Their improvement apparently had a dose response of banana starch intervention. In summary, our study clearly demonstrated the strong associations among the guts, microbiotas, and brain in diabetic rats. The results highlighted the role of Banana starch intervention as an effective way for alleviation of diabetes and its associated symptoms such as mood disorders. Diabetes is one of the fastest-growing diseases with multiple cardiovascular and neurological complications that lead to increased mortality. Despite many efforts that have been made to manage type-2 diabetes, the related complications, particularly mood disorders and depression, are increasing currently with poor outcomes (Li et al., Citation2020). Our results provided clues for alleviation of diabetes-induced mood disorders with daily consumption-resistant enriched food diet intervention, such as bananas.
Previous studies of banana starch showed that unripen banana-enriched resistant starch was effective to alleviate the diabetic condition in diabetic mice study (Konda et al., Citation2020; Lotfollahi et al., Citation2020). Recent clinical studies showed that patients with pre-diabetes and diabetes-consuming green bananas could improve their plasma low-density lipoprotein particle functionality (Lotfollahi et al., Citation2020). Preliminary studies with high-fat induced obesity mice demonstrated that resistant starch from green banana was able to improve liver lipid metabolism (Konda et al., Citation2020). Our results are consistent with those findings that banana starch intervention can significantly improve the health condition in diabetic animals. The results implied that unripe bananas can serve as a good source of resistant starch applied to a human who had diabetic complications. In addition, insulin resistance is reported to be associated with depression and anti-depressant treatment (Rashidian et al., Citation2021). This is also evidenced in our studies in that HDL cholesterol plays a key role in the BS-regulated anti-depressant action. The HDL/triglycerols ratio may be a marker to evaluate the outcome of mood disorder diet treatment in the clinic, as reported (Bikri et al., Citation2021).
Previous studies suggested that the insulin level is associated with glucose and lipid hypometabolism, TCA cycle, and anti-oxidation function (Cox et al., Citation2019). Our studies implied that the TCA cycle is not important in the banana starch-mediated anti-depressant function. The microbial metabolite of butyrate was reported to play a key role in brain neuropharmacology including depression and other social behaviours (Liu et al., Citation2017; Stilling et al., Citation2016; Cavaleri & Bashar, Citation2018). Our study indicated that faecal butyrate generated by microbiota after a banana starch diet is important in the regulation of mood disorders in diabetic animals. A banana starch dietary was reported to alter tryptophan and its metabolites 5-HT and IPA, the well-known key hormone/neurotransmitters of the gut-brain axis (O'Mahony et al., Citation2010). A banana diet was demonstrated to enhance the abundance of the probiotic Lactobacillus and Bifidobacterium in gut (Wu et al., Citation2020). Those results were consistent with our findings. However, the reconstructing effect of banana starch on gut microbiota may be different, due to the feeding periods, animal strains, and house condition. Rosado reported an increase of Bacteroidetes by green banana flour in high-fat mice (Rosado et al., Citation2021); however, we observed a decrease of Bacteroidetes by banana starch powder in high-sugar, high-fat, STZ-induced rats. Nevertheless, we were not able to investigate the whole pattern changes of microorganisms under banana starch intervention.
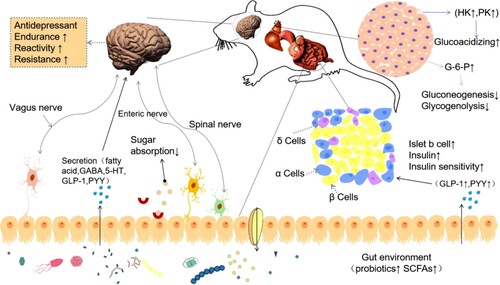
In summary, our studies suggest a novel mechanism of the dietary banana starch effect of diabetic-induced mood disorders via modulation of the gut-microbiota-brain axis (). Banana starch intervention restructured the gut microbiome resulting in the alteration of microbial metabolites, upregulated hippocampus mitochondrial biogenesis, and attenuated mood disorders in diabetic animals. Diet pattern has been associated with mood disorders. Dietary quality is associated with a lower risk for the onset of mood disorder symptoms (Molendijk et al., Citation2018). Yet, the improvement of banana starch on diabetic-induced mood disorders has not been tested in humans. The functions of other ingredients in BS also need to be studied. On the other hand, behavioural tests of forced swimming and tail suspension tests have been well documented for the evaluation of mood disorders in recent research works (Bikri et al., Citation2021; Vadnie et al., Citation2021). In our study, those tests were applied to evaluate the effect of banana starch on depression in diabetic rats. The banana starch intervention significantly changed the profiles of rats’ swimming behaviour and immobility behaviours. This kind of improvement apparently showed the dose response of banana starch. The results highlighted the role of the gut microbiota-brain axis in the amelioration of diabetes-associated mood disorders by resistant starch (Fung, Citation2020; Rutsch et al., Citation2020; Liu et al., Citation2015).
Figure 6. The proposed mechanism diagram of banana starch intervention attenuates diabetes-induced depressive-like behaviours via modulation of the gut-microbiota-brain axis.
Future studies on human subjects are expected to better evaluate the effects of long-term consumption of unripe banana starch on managing mood disorders in diabetic patients. The signal transduction pathways are associated with banana starch intervention under investigation for a better understanding of the mechanisms associated with banana starch effects on mood disorders. Other banana ingredients in addition to its resistant starch as well as the optimal dosage of banana powder are being studied before it can become a routine therapy for mood disorders. Our preliminary studies in rats, however, did show hope for the efficacy of banana starch in the management of mood disorders in diabetes.
Supplemental Material
Download MS Word (998.1 KB)Disclosure statement
No potential conflict of interest was reported by the author(s).
Additional information
Funding
References
- Ara, F., Tripathy, A., Ghosh, P., & Ghosh, D. (2020). Correction of glycemic and oxidative stress sensors in streptozotocin induced diabetic rat model: Impact of dose dependent study of n-butanol solvent fraction of hydro-methanol extract of banana flower (Musa balbisiana). Journal of Food Biochemistry, 44(10), e13386. https://doi.org/10.1111/jfbc.13386.
- Bikri, S., Aboussaleh, Y., Berrani, A., Louragli, I., Hafid, A., Chakib, S., & Ahami, A. (2021). Effects of ate seeds administration on anxiety and depressive symptoms in streptozotocin-induced diabetic rats: Biochemical and behavioral evidences. Journal of Basic and Clinical Physiology and Pharmacology, 32(6), 1031–1040. https://doi.org/10.1515/jbcpp-2020-0225.
- Buin, E., Pavin, E. J., & Silveira, M. (2020). High anxiety and depressive symptoms in partners of type 1 diabetes persons in a sample of the Brazilian population. Diabetology & Metabolic Syndrome, 12, 23. https://doi.org/10.1186/s13098-020-00531-5. eCollection 2020.
- Bunner, A. E., Wells, C. L., Gonzales, J., Agarwal, U., Bayat, E., & Barnard, N. D. (2015). A dietary intervention for chronic diabetic neuropathy pain: A randomized controlled pilot study. Nutrition & Diabetes, 5(5), e158. https://doi.org/10.1038/nutd.2015.8.
- Cavaleri, F., & Bashar, E. (2018). Potential synergies of beta-hydroxybutyrate and butyrate on the modulation of metabolism, inflammation, cognition, and general health. Journal of Nutrition and Metabolism, 2018, 7195760. https://doi.org/10.1155/2018/7195760, eCollection 2018.
- Costa, E. S., França, C. N., Fonseca, F. A. H., Kato, J. T., Bianco, H. T., Freitas, T. T., Fonseca, H. A. R., Figueiredo Neto, A. M., & Izar, M. C. (2019). Beneficial effects of green banana biomass consumption in patients with pre-diabetes and type 2 diabetes: A randomised controlled trial. British Journal of Nutrition, 121(12), 1365–1375. https://doi.org/10.1017/S0007114519000576
- Cox, N., Gibas, S., Salisbury, M., Gomer, J., & Gibas, K. (2019). Ketogenic diets potentially reverse type II diabetes and ameliorate clinical depression: A case study. Diabetes & Metabolic Syndrome: Clinical Research & Reviews, 13(2), 1475–1479. https://doi.org/10.1016/j.dsx.2019.01.055
- Crowell, M. D., & Wessinger, S. B. (2007). 5-HT and the brain-gut axis: Opportunities for pharmacologic intervention. Expert Opinion on Investigational Drugs, 16(6), 761–765. https://doi.org/10.1517/13543784.16.6.761
- Fung, T. C. (2020). The microbiota-immune axis as a central mediator of gut-brain communication. Neurobiology of Disease, 136, 104714. https://doi.org/10.1016/j.nbd.2019.104714, Epub 2019 Dec 14.
- Gao, H., Song, R., Li, Y., Zhang, W., Wan, Z., Wang, Y., Zhang, H., & Han, S. (2020). Effects of oat fiber intervention on cognitive behavior in LDLR–/–mice modeling atherosclerosis by targeting the microbiome–Gut–brain axis. Journal of Agricultural and Food Chemistry, 68(49), 14480–14491. https://doi.org/10.1021/acs.jafc.0c05677
- Grunberger, G., Jen, K. L., & Artiss, J. D. (2007). The benefits of early intervention in obese diabetic patients with FBCx: A new dietary fibre. Diabetes/Metabolism Research and Reviews, 23(1), 56–62. https://doi.org/10.1002/dmrr.687
- Hoogendoorn, C. J., Shapira, A., Roy, J. F., Walker, E. A., Cohen, H. W., & Gonzalez, J. S. (2019). Depressive symptom dimensions and medication non-adherence in suboptimally controlled type 2 diabetes. Journal of Diabetes and its Complications, 33(3), 217–222. https://doi.org/10.1016/j.jdiacomp.2018.12.001
- Jaber, H., Baydoun, E., EL-Zein, O., & Kreydiyyeh, S. I. (2013). Anti-hyperglycemic effect of the aqueous extract of banana infructescence stalks in streptozotocin-induced diabetic rats. Plant Foods for Human Nutrition, 68(1), 83–89. https://doi.org/10.1007/s11130-013-0341-5
- Kamdi, S. P., Raval, A., & Nakhate, K. T. (2021). Phloridzin ameliorates type 2 diabetes-induced depression in mice by mitigating oxidative stress and modulating brain-derived neurotrophic factor. Journal of Diabetes & Metabolic Disorders, 20(1), 341–348. https://doi.org/10.1007/s40200-021-00750-1
- Kincaid, H. J., Nagpal, R., & Yadav, H. (2021). Diet-Microbiota-Brain axis in Alzheimer's disease. Annals of Nutrition and Metabolism, 21–27. https://doi.org/10.1159/000515700
- Konda, P. Y., Poondla, V., Jaiswal, K. K., Dasari, S., Uyyala, R., Surtineni, V. P., Egi, J. Y., Masilamani, A. J. A., Bestha, L., Konanki, S., Muthulingam, M., Lingamgunta, L. K., Aloor, B. P., Tirumalaraju, S., Sade, A., Kamsala, V. R., Nagaraja, S., Ramakrishnan, R., & Natesan, V. (2020). Pathophysiology of high fat diet induced obesity: Impact of probiotic banana juice on obesity associated complications and hepatosteatosis. Scientific Reports, 10(1), 16894. https://doi.org/10.1038/s41598-020-73670-4
- Li, X., Qiu, W., Li, N., Da, X., Ma, Q., Hou, Y., Wang, T., Song, M., & Chen, J. (2020). Susceptibility to hyperglycemia in rats with stress-induced depressive-like behavior: Involvement of IL-6 mediated glucose homeostasis signaling. Frontiers in Psychiatry, 11, 557. https://doi.org/10.3389/fpsyt.2020.00557. eCollection 2020.
- Liu, X., Cao, S., & Zhang, X. (2015). Modulation of gut microbiota-brain axis by probiotics, prebiotics, and diet. Journal of Agricultural and Food Chemistry, 63(36), 7885–7895. https://doi.org/10.1021/acs.jafc.5b02404
- Liu, Z., Dai, X., Zhang, H., Shi, R., Hui, Y., Jin, X., Zhang, W., Wang, L., Wang, Q., Wang, D., Wang, J., Tan, X., Ren, B., Liu, X., Zhao, T., Wang, J., Pan, J., Yuan, T., Chu, C., … Liu, X. (2020). Gut microbiota mediates intermittent-fasting alleviation of diabetes-induced cognitive impairment. Nature Communications, 11(1), 855. https://doi.org/10.1038/s41467-020-14676-4.
- Liu, Z., Patil, I., Sancheti, H., Yin, F., & Cadenas, E. (2017). Effects of lipoic acid on high-fat diet-induced alteration of synaptic plasticity and brain glucose metabolism: A PET/CT and (13)C-NMR study. Scientific Reports, 7(1), 5391. https://doi.org/10.1038/s41598-017-05217-z
- Lotfollahi, Z., Mello, A. P. d. Q., Costa, E. S., Oliveira, C. L. P., Damasceno, N. R. T., Izar, M. C., & Neto, A. M. F. (2020). Green-banana biomass consumption by diabetic patients improves plasma low-density lipoprotein particle functionality. Scientific Reports, 10(1), 12269. https://doi.org/10.1038/s41598-020-69288-1
- Martins, L. B., Braga Tibães, J. R., Sanches, M., Jacka, F., Berk, M., & Teixeira, A. L. (2021). Nutrition-based interventions for mood disorders. Expert Review of Neurotherapeutics, 21(3), 303–315. https://doi.org/10.1080/14737175.2021.1881482
- Molendijk, M., Molero, P., Ortuno Sanchez-Pedreno, F., Van der Does, W., & Angel Martinez-Gonzalez, M. (2018). Diet quality and depression risk: A systematic review and dose-response meta-analysis of prospective studies. Journal of Affective Disorders, 226, 346–354. https://doi.org/10.1016/j.jad.2017.09.022
- Mondal, A., Banerjee, S., Bose, S., Das, P. P., Sandberg, E. N., Atanasov, A. G., & Bishayee, A. (2021). Cancer preventive and therapeutic potential of banana and Its bioactive constituents: A systematic, comprehensive, and mechanistic review. Frontiers in Oncology, 11, 697143. https://doi.org/10.3389/fonc.2021.697143
- Murciano-Brea, J., Garcia-Montes, M., Geuna, S., & Herrera-Rincon, C. (2021). Gut microbiota and neuroplasticity. Cells, 10(8), 2084. https://doi.org/10.3390/cells10082084.
- O'Mahony, S. M., Bulmer, D. C., Coelho, A.-m., Fitzgerald, P., Bongiovanni, C., Lee, K., Winchester, W., Dinan, T. G., & Cryan, J. F. (2010). 5-HT(2B) receptors modulate visceral hypersensitivity in a stress-sensitive animal model of brain-gut axis dysfunction. Neurogastroenterology & Motility, 22(573-578), e124. https://doi.org/10.1111/j.1365-2982.2009.01432.x
- Ramu, R., Shirahatti, P., Dhanabal, S. P., Zameer, F., Dhananjaya, B. L., & Nagendra Prasad, M. N. (2017). Investigation of antihyperglycaemic activity of banana (Musa sp. Var. Nanjangud rasa bale) flower in normal and diabetic rats. Pharmacognosy Magazine, 13(Suppl 3), S417–S423. https://doi.org/10.4103/0973-1296.216331.
- Rashidian, H., Subramaniapillai, M., Park, C., Lipsitz, O., Zuckerman, H., Teopiz, K., Cao, B., Lee, Y., Gill, H., Ho, R., Lin, K., Rodrigues , N. B., Michelle Iacobucci, Rosenblat, J. D., McIntyre, R. S., & Mansur, R. B. (2021). Insulin resistance is associated with deficits in hedonic, self-reported cognitive, and psychosocial functional response to antidepressant treatment in individuals with major depressive disorder. Journal of Affective Disorders, 282, 448–453. https://doi.org/10.1016/j.jad.2020.12.074
- Ravona-Springer, R., Luo, X., Schmeidler, J., Wysocki, M., Lesser, G., Rapp, M., Dahlman, K., Grossman, H., Haroutunian, V., & Schnaider Beeri, M. (2010). Diabetes is associated with increased rate of cognitive decline in questionably demented elderly. Dementia and Geriatric Cognitive Disorders, 29(1), 68–74. https://doi.org/10.1159/000265552
- Reeves, P. G., Nielsen, F. H., & Fahey, G. C. (1993). AIN-93 purified diets for laboratory rodents: Final report of the American Institute of Nutrition ad hoc writing committee on the reformulation of the AIN-76A rodent diet. The Journal of Nutrition, 123(11), 1939–1951. https://doi.org/10.1093/jn/123.11.1939
- Rosado, C. P., Rosa, V. H. C., Martins, B. C., Soares, A. C., Almo, A., Monteiro, E. B., Mulder, A. d. R. P., Moura-Nunes, N., & Daleprane, J. B. (2021). Green banana flour supplementation improves obesity-associated systemic inflammation and regulates gut microbiota profile in high-fat diet-fed mice. Applied Physiology, Nutrition, and Metabolism, 46(12), 1469–1475. https://doi.org/10.1139/apnm-2021-0288.
- Rosado, C. P., Rosa, V. H. C., Martins, B. C., Soares, A. C., Santos, I. B., Monteiro, E. B., Moura-Nunes, N., da Costa, C. A., Mulder, A. d. R. P., & Daleprane, J. B. (2020). Resistant starch from green banana (Musa sp.) attenuates non-alcoholic fat liver accumulation and increases short-chain fatty acids production in high-fat diet-induced obesity in mice. International Journal of Biological Macromolecules, 145, 1066–1072. https://doi.org/10.1016/j.ijbiomac.2019.09.199
- Rutsch, A., Kantsjo, J. B., & Ronchi, F. (2020). The gut-brain axis: How microbiota and host inflammasome influence brain Physiology and pathology. Frontiers in Immunology, 11, 604179. https://doi.org/10.3389/fimmu.2020.604179. eCollection 2020.
- Santos, A. P. B., Zajdenverg, L., Guimarães, H. C., Beato, R. G., de Almeida, M. A., Ritter, S. R. F., Machado, J. C. B., Teixeira, A. L., Barbosa, M. T., & Caramelli, P. (2021). Diabetes and impaired fasting glucose in a population-based sample of individuals aged 75 + years: Associations with cognition, major depressive disorder, functionality and quality of life-the Pieta study. Neurological Sciences, 42(9), 3663–3671. https://doi.org/10.1007/s10072-020-05008-x
- Shi, H., Wang, Q., Zheng, M., Hao, S., Lum, J. S., Chen, X., Huang, X.-F., Yu, Y., & Zheng, K. (2020). Supplement of microbiota-accessible carbohydrates prevents neuroinflammation and cognitive decline by improving the gut microbiota-brain axis in diet-induced obese mice. Journal of Neuroinflammation, 17(1), 77. https://doi.org/10.1186/s12974-020-01760-1.
- Stilling, R. M., van de Wouw, M., Clarke, G., Stanton, C., Dinan, T. G., & Cryan, J. F. (2016). The neuropharmacology of butyrate: The bread and butter of the microbiota-gut-brain axis? Neurochemistry International, 99, 110–132. https://doi.org/10.1016/j.neuint.2016.06.011
- Vadnie, C. A., DePoy, L. M., & McClung, C. A. (2021). Measuring the effects of circadian rhythm-related manipulations on depression-like behavior in rodents: Forced swim and tail suspension tests. Methods in Molecular Biology, 2130, 69–78. https://doi.org/10.1007/978-1-0716-0381-9_5
- Wessels, A. M., Lane, K. A., Gao, S., Hall, K. S., Unverzagt, F. W., & Hendrie, H. C. (2011). Diabetes and cognitive decline in elderly African Americans: A 15-year follow-up study. Alzheimer's & Dementia, 7(4), 418–424. https://doi.org/10.1016/j.jalz.2010.07.003
- Wu, T. Y., Tsai, S.-J., Sun, N.-N., Dai, F.-J., Yu, P.-H., Chen, Y.-C., & Chau, C.-F. (2020). Enhanced thermal stability of green banana starch by heat-moisture treatment and its ability to reduce body fat accumulation and modulate gut microbiota. International Journal of Biological Macromolecules, 160, 915–924. https://doi.org/10.1016/j.ijbiomac.2020.05.271.
- Ye, M., Ke, Y., Liu, B., Yuan, Y., Wang, F., Bu, S., & Zhang, Y. (2017). Root bark of Morus alba ameliorates the depressive-like behaviors in diabetic rats. Neuroscience Letters, 637, 136–141. https://doi.org/10.1016/j.neulet.2016.11.036