
 ?Mathematical formulae have been encoded as MathML and are displayed in this HTML version using MathJax in order to improve their display. Uncheck the box to turn MathJax off. This feature requires Javascript. Click on a formula to zoom.
ABSTRACT
Phenylethanolamine A (PEAA), as a typical β2-adrenoceptor agonist (β-AA), was widely illegally used in feed to improve the lean meat ratio. The detection performance of immunoassay, which is one of the effective methods to monitor PEAA residues in animal urine, has been hindered by high concentration of salt. Herein, we produced one highly salt-tolerant monoclonal antibody (mAb) 3E2 by hybridoma technology. Homologous modelling and molecular docking were used to analyse the antibody salt tolerance mechanism. Results show that the tight hydrophobic binding cavity is the key to high tolerance. Then the mAb 3E2 was used for specific detecting PEAA by enzyme-linked immunosorbent assay (ELISA) with the IC50 value of 0.36 ng mL−1and the LOD value of 0.065 µg L−1. Benefiting from the high salt tolerance of antibodies, swine urine and sheep urine spiked with PEAA can be detected directly by ELISA, and the acceptable recovery rates of 80.1–108.8% were obtained.
Introduction
Phenylethanolamine A (PEAA,C19H24N2O4, 2-[4-(nitrophenyl)butan-2-ylamino]-1-[4-methoxypheny-l]ethanol), also known as clenrapmine, is an important β2-adrenoceptor agonist (β-AA) (Li et al., Citation2015a). The addition of PEAA to feed can improve the lean meat ratio (Jiang et al., Citation2016). However, studies have shown that consumers who consume meat and dairy products containing PEAA will experience some acute symptoms of cardiovascular and central nervous system poisoning, such as nausea, heart palpitations, vomiting and so on (Cao et al., Citation2013). Therefore, the Ministry of Agriculture of China No. 1519 announcements have banned the usage of PEAA as a feed additive in animal feed.
At present, methods for PEAA mainly include liquid chromatography–tandem mass spectrometry, reversed-phase liquid chromatography–tandem mass spectrometry, ultra-high performance liquid chromatography–tandem mass spectrometry and so on (Li et al., Citation2017; Wang et al., Citation2015a; Zhang et al., Citation2012). Although instrument detection methods have the merits of being highly accurate, the expensive instruments, the complex manipulation process and the long detection time, limit their application in the rapid screening field (Li et al., Citation2015b). Therefore, it has great practical significance to establish a rapid, simple and sensitive detection method for PEAA.
With high-throughput capability, easy operation, as well as highly sensitivity and specificity, immunoassays based on antigen-antibody interactions provide an alternative to achieve the qualitative and semi-quantitative analyses for PEAA residues (Liu et al., Citation2018). Multiple immunoassays were established to detect PEAA (Tang et al., Citation2015), such as colloidal gold-based immunoassay (Dai et al., Citation2015), immunoaffinity chromatography column (Mei et al., Citation2014), electrochemiluminescent immunosensor (Yan et al., Citation2014), and enzyme-linked immunosorbent assay (ELISA) (Bai et al., Citation2012; Cao et al., Citation2013; Wang et al., Citation2016; Li et al., Citation2015c). Among them, ELISA has the advantages of good specificity and high sensitivity (Mari et al., Citation2021), and is the most widely used rapid detection technology (Li et al., Citation2021).
ELISA detection of PEAA usually requires dilution or centrifugation steps (Zhang et al., Citation2014). Urine usually affects the sensitivity of the test such as multiple ions influence (Zhang et al., Citation2014). Antibody is the core biological binder of immunoassay, which can ensure the sensitivity, specificity, accuracy and precision of detection (Cao et al., Citation2013). The tolerance and affinity of antibodies determine the performance of immunoassay.
In this article, a highly salt-tolerant monoclonal antibody against PEAA was produced. The tolerance salt mechanism was studied by homologous modelling and molecular docking. Finally, a rapid indirect competitive ELISA (icELISA) based on the mAb 3E2 was developed for detecting PEAA with high sensitivity and specificity. More importantly, benefiting from the high salt tolerance of antibodies, swine urine and sheep urine spiked with PEAA can be detected directly by ELISA without dilution steps.
Experimental section
Materials and apparatus
PEAA, clorprenaline, tulobuterol, ractopamine, cimaterol, terbutaline, bambuterol, zilpaterol, mabuterol, brombuterol, formoterol, fenoterol, clenbuterol, penbutolol, cimbuterol and salbutamol were acquired from Thermo Fisher Scientific, Inc. (Waltham, MA, USA). Keyhole limpet hemocyanin (KLH), bovine serum albumin (BSA), complete Freund’s adjuvant (CFA) and incomplete Freund’s adjuvant (IFA)were acquired from Sigma-Aldrich (St. Louis, MO, USA). Horse radish peroxidase (HRP)-labelled goat anti-mouse antibody was obtained from Jackson ImmunoResearch Laboratories. Fetal calf serum, cell culture medium (DMEM), polyethylene glycol (PEG) 1500 and red blood cell lysis buffer were obtained from Gibco BRL (Carlsbad, CA, USA). The oligonucleotide primers were synthesized in Invitrogen (Shanghai, China). RNeasy Mini Kit was bought from Qiagen (USA). The molecular simulation was calculated by Discovery Studio 2019. Polystyrene microtitre plates were acquired from Corning incorporated (Costar 2592, Corning, NY). The optical density (OD) values were measured using the PerkinElmer Envision plate reader (Waltham, MA, USA). The chemical reagents were provided by Sinopharm Chemical Reagent, Inc. (Beijing, China).
Buffers and solutions
0.01 mol L−1 phosphate-buffered saline (PBS) (pH 7.4) contains 0%, 2%, 4%, 8%, 16% urea, 0, 10, 20, 30 acetonitrile and 0%, 5%, 10%, 20%, 40% methanol, respectively; 0.01 mol L−1 phosphate-buffered (PB) (pH 7.4) contains 0, 0.14, 1, 5 mol L−1 NaCl, respectively. Other buffers and solutions are the same as conventional ELISA.
Antigen preparation
The PEAA was derivatized by reduction of nitryl group to amino group (Cao et al., Citation2013). The diazobenzidine method was used to couple haptens to carrier proteins (KLH and BSA) to form immunogen (KLH) and coating antigen (BSA). Specifically, PEAA haptens (10 mg) were dissolved in a mixture of 1 M hydrochloric acid (HCl) 50 µL. Then, 5 μL of 30% sodium nitrite was added and stirred in dark liquid at 4°C for 1 h, and proteins were soluble in 0.1 M CB (pH 9.6) stored at 4°C for 0.5 h. Add the PEAA solution to the protein solution and stir in the dark for 3 hours. Dialysis was performed with 0.01 M PBS for 2 days and then stored at −20 °C.
Production of mAbs
Ten 8-week-old BALB/c mice were used to immunize by the procedure we previously described (Wang et al., Citation2015b). In brief, immunogen emulsified with CFA for the first injection (200 µg) and IFA for the other injection (100 µg). From the second immunization, antiserum was collected on the 7th day after immunization, and detected by icELISA. By fourth immunization, the mice with the highest affinity were selected to cell fusion. (Bai et al., Citation2021b). Hybridoma cells were screened for antibody generation by icELISA and then subcloned by limited dilution method. The clones with high inhibition were cloned for ascites production three times. The subtype of antibody 3E2 was identified by Mouse Antibody Isotyping Kit.
Variable region sequencing of antibody
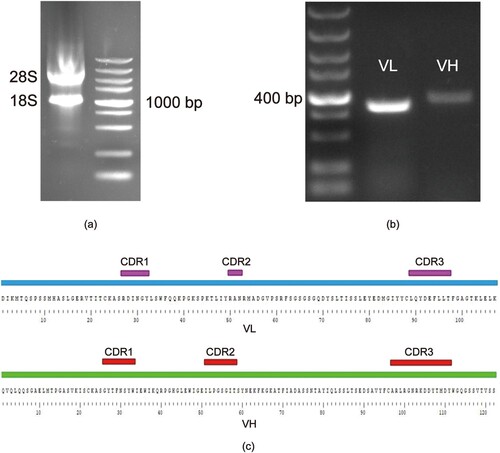
The total RNA was extracted by the Rneasy Mini Kit from the hybridoma cells 3E2. The RNA was immediately used to synthesize cDNA. The target sequences from the cDNA were obtained by RT-PCR. And the PCR was performed using the primers listed in Table S1. The PCR products were sent to Genwiz (Suzhou, China) for sequencing. The gene sequences of 3E2 Fv were submitted to ExPASy database (https://web.expasy.org) and then obtain the variable fragment antibody amino acid sequences. The sequencing results of variable fragment antibody 3E2 are presented in (c).
Figure 1. Identification and sequence analysis of 3E2 Fv. (a) Agarose gel electrophoresis of total RNA; left panel, the 28S RNA and 18S RNA; right panel, DNA marker. (b) agarose gel electrophoresis of PCR amplified products of VL and VH genes from hybridoma cells; left panel, DNA marker; middle panel, VL gene fragment; right panel, VH gene fragment. (c) amino acid sequences of the VH and VL of 3E2; purple, CDR1, CDR2 and CDR3.
Homology modelling of antibody
The 3D structure of 3E2 Fv was built in Discovery Studio 2019 software by Model Antibody module (Pawar et al., Citation2021; Liu et al., Citation2010). According to the existing protein structure in IMGT, the Model Antibody module was used to identify the heavy and light chain sequences of Fv, and 10 Fv structural models were obtained. The structure with higher resolution and the higher similarity was used to model antibody framework for 3E2. The IMGT database was compared with the complementary determination region (CDR) of traditional antibody sequences to further optimize the CDR region and ensure the rationality of the structure. The best-simulated conformation was selected according to the PDF value. Ramachandran diagram was used to evaluate the optimization model. The optimal conformation was selected by PDF value and Ramachandran plot.
Molecular docking of antibody
CDOCKER on Discovery Studio 2019 is a mesh-based molecular docking method, which can achieve flexible docking between ligand and receptor (Gagnon et al., Citation2014; Sharma et al., Citation2021). The PEAA is connected to the active pocket of Fv in CDOCKER mode. The pocket is defined by the antibody binding cavity. The 3D structure of PEAA was drawn by using Discovery Studio 2019, and the force field was given to optimize the structure. The best conformation of PEAA-Fv was selected by the interaction energy value.
Protocol of ELISA
Each microdroplet plate well was coated with 100 μL carbonate buffer with coating antigen, and then incubated overnight at 4°C. After blocking 2 h at 37°C, 50 μL β-AAs standard and 50 μL mAb were added to the well, and then were incubated at 37°C for 30 min. After washing for 5 times, 100 μL diluted HRP labelled goat anti-mouse IgG was added and incubated at 37°C for 30 min. After further washing, TMB substrate was added and incubated at 37°C for 15 min. The colour reaction was inhibited by 2 M H2SO4 (50 μL/well), and the OD value at 450 nm was determined.
PEAA-specific mAb characterization
The checkerboard method was used to optimize the optimal concentration and matching combination of envelope antigen and antibody. At optimal working concentrations of antibodies and antigens, the urine strength (concentrations of urine were 0%, 2%, 4%, 8% and 16%), organic solvent (proportion of methanol were 0%, 5%, 10%, 20% and40%, proportion of acetonitrile were 0%,10%, 20% and 30%) pH value (5.0, 6.0, 7.0, 7.4, 8.0 and 9.0), and sodium chloride strength (concentrations of NaCl were 0, 0.14, 1, and 5 mol L−1)were optimized. The standard curves of the icELISA were constructed by OriginPro 8.0 (OriginLab Corp., Northampton, MA)
The specificity of 3E2 was evaluated by using PEAA, clorprenaline, tulobuterol, ractopamine, cimaterol, terbutaline, bambuterol, zilpaterol, mabuterol, brombuterol, formoterol, fenoterol, clenbuterol, penbutolol, cimbuterol and salbutamol. The cross reactivity (CR) was using the formula as follows:
Analysis of spiked samples
The established icELISA method based on 3E2 showed high affinity and stability, and its practicality was evaluated by adding urine samples that were already confirmed by HPLC-MS/MS. The PEAA-negative samples of urine were obtained from the Beijing Key Laboratory of Diagnostic (Beijing, China). Urine is used directly for ELISA testing that does not need to dilute. The limit of detection (LOD) was obtained by calculating the average of 20 samples of blank urine (no analyte) plus three standard deviations.
Results and discussion
Identification of hapten and conjugates
The PEAA hapten was coupled with proteins by the diazotization method to form immunogens (KLH-PEAA) and coated antigens (BSA-PEAA). The PEAA-BSA conjugate was characterized successfully by using MALDI-TOF-MS (Figure S1). The molar ratio of the PEAA-BSA was 6.4 by calculation. The results showed that PEAA hapten was successfully conjugated with BSA. The coated antigen was also constructed correctly. The KLH conjugate could not be identified by MALDI-TOF-MS as it has no definite molecular weight and was characterized successfully by using ELISA.
Screening and characterization of antisera and mAb
After four immunizations, the mice with high affinity (IC50 value of 5.6 µgL−1) was selected to produce antibodies. The results confirmed the Immunogenicity of PEAA-KLH as it induces positively antibody response. The molecular hydrophobicity of benzene ring with methoxy group might be powerful for the immune response (Bai et al., Citation2021a).
In this study, the mouse with highest affinity to PEAA was chosen for cell fusion. The mouse spleen cells and Sp2/0 myeloma cells were fused using the polyethylene glycol fusion technique. And then, we screened the subclones hybridoma cells and finally selected PEAA-3E2 to expand and cryopreserve. The antibody 3E2 was characterized and it was found that it could tolerate 5M sodium chloride solutions (e). Therefore, we further extracted its variable region sequence for further research.
Analysis of anti-PEAA Fv gene
It has been demonstrated that producing scFv antibodies from hybridoma cell lines with the native paired VH/VL is an effective method(Liu et al., Citation2016; Mahalakshmi et al., Citation2019). Thus, in this study, 3E2 Fv was produced from the related hybridoma cells. The subtype of antibody 3E2 was identified by Mouse Antibody Isotyping, and the heavy chain is IgG1, light chain is kappa. as shown in Table. S1. The brightness of 28S and 18s from total RNA indicates that RNA quality is available (a) and then rapid reverse transcription to cDNA. The target sequence VH (360 bp) and VL (320 bp) were successfully amplified from the reversed cDNA (b). Submitting the gene sequences of 3E2 Fv to the ExPASy database to obtain the amino acid sequences. The sequence of VH and VL was analysed by DS2019 software with BLAST module. The complementary determining regions (CDRs) were identified in VH and VL, respectively (c).
Construction of the Fv 3D model
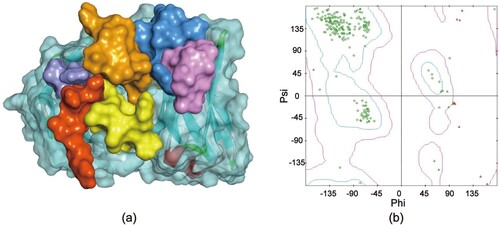
Homologous modelling is based on the theory of the conservative of the protein tertiary structure (Hu et al., Citation2016). The template 1D5I LH has the highest identity(95.6%) with the Fv sequence by IMGT database. Based on the 3D antibody structure of 1D5I LH, the 10 antibody structural models are generated. As the lower PDF value, the model is better optimized by homologous constraints. The antibody 3D model with the lower most PDF value is the best model (a). And the reliability of the Fv 3D model could be estimated by the Ramachandran plot. In theory, a reliable model would have more than 90% of the residues in the reasonable region for the Ramachandran plot. As expected, the built model showed in (b), 96.07% of the Fv amino acid residues in the reasonable region were blue and purple, 3.9% of the amino acid residues in the unreasonable region were red.
Figure 2. 3D model of Fv 3E2 and the evaluation of the Fv model. (a) 3D model of Fv 3E2. The LCDR1, LCDR2, LCDR3, HCDR1, HCDR2 and HCDR3 is red, purple, yellow, blue, pink and orange, respectively. (b) Ramachandran plot of the Fv model.
Recognition mechanism of mAbs to PEAA
CDOCKER is a popular docking method based on the CHARM force field (Min et al., Citation2010). In this study, the conformation of PEAA was randomly searched by using the polymer dynamics method, and then the conformation of mAb 3E2 was optimized by the simulated annealing method, so that CDOCKER could produce high-precision docking results (Türker et al., Citation2020). The PEAA was docked into the antibody binding pocket of the Fv. The PEAA-Fv complex that has the optimal value of CDOCKER_ENERGY and consistent with the cross-reaction rate results was used as the final docking result. The bingding pocket of the Fv consists mainly consists of LCDR1, HCDR2 and HCDR3 (a). The tight hydrophobic binding cavity (a) is similar to triclocarban single domain camelid antibody 5vl2 and may be the key to high salt tolerance (Sofia et al., Citation2019).
Figure 3. Molecular docking diagram of PEAA and 3E2. (a) Antibody binding pocket with hydrophobicity. (a)The 2D views of interaction between PEAA and key amino acid residues.
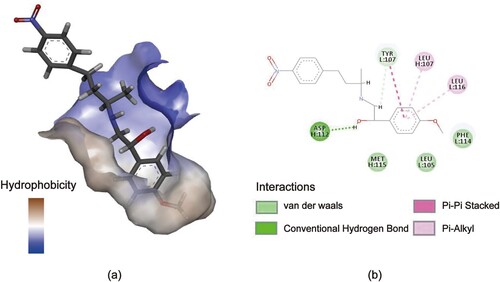
The ASP112 in the HCDR3 combining region forms a hydrogen bond with PEAA at a distance of 2.68 Å. The TYR107 in the LCDR3 region forms a weak atypia hydrogen bond as well as a pi–pi bond with the PEAA. Pi-alkyl was formed by LEU107 in HCDR3 and LEU116 in LCDR3 with PEAA, which indicated strong hydrophobic interaction forces. And the PHE114 in LCDR3, LEU105 in LCDR3 and MET115 in HCDR3 provided the main hydrophobic forces (b). The increase of salt ion concentration is beneficial to increase the hydrophobic force usually. Therefore, the higher hydrophobic force in antigen binding of Fv is the prerequisite of salt tolerance Through molecular docking, it is showed that the amino acids have the interaction between PEAA and Fv are LEU107, MET115, ASP112 of VH chains, and LEU105, TYR107, PHE114, LEU116 of VL chain, respectively. The interactions of amino acids together formed a tight binding cavity with small surface area accessible to the solvent and thus reducing the influence of ions during the binding process between 3E2 and PEAA.
Optimization of ELISA conditions
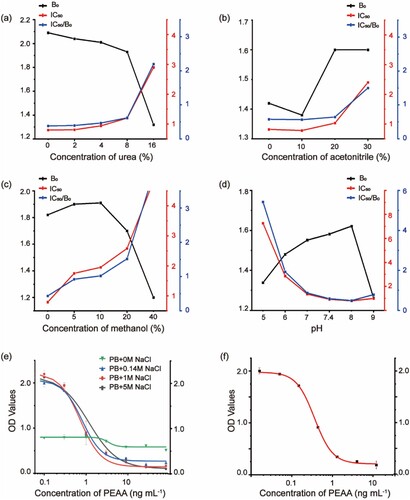
The possible factors that can influence the icELISA performance were optimized to establish a high specific and sensitive ELISA. The PEAA-BSA was used as a coating antigen. The dilutions of immunoreagents were optimized by checkerboard assay. The result showed that best dilutions of mAb (3E2), coating antigens (BSA-PEAA), and goat anti-mouse IgG were1/60000, 1/9000, and 1/5000, respectively. And several physicochemical factors including urea strength, organic solvent, pH value and ionic strength were further evaluated. The ratio of IC50/B0 was steady at urine strength of 8.0% as shown in (a). Urea content in urine usually does not exceed 4%. The results in (band c) show organic solvent tolerance test, indicating that the IC50/B0 ratio decreased significantly when the concentration of acetonitrile was over 20% or the concentration of methanol achieving 20%. And the ratio of IC50/B0 was better at pH 7.4–8.0 in the range 5.0–9.0 (d). It can be seen from (e) that the antibody performance was steady at ionic strength from 0.14 to 5.0 mol L−1, exhibiting a huge improvement compared with no sodium chloride ion. Therefore, the antibody 3E2 is well adapted to the urine environment.
Figure 4. Optimization of physicochemical parameters on the icELISA and calibration curves assessed by the icELISA. The effect of (a) urea strength, (b) acetonitrile, (c) methanol, (d) pH value and (e)ionic strength on the icELISA (N = 3). (f)The standard curves of icELISA based on mAb 3E2 for detecting PEAA.
Sensitivity and specificity of the icELISA
The sensitivity of the assay was evaluated by the IC50 value. Based on optimal assay conditions, various concentrations of PEAA (0, 0.016,0.05, 0.148, 0.44, 1.3, 4 and 12 ng mL−1) were detected by the icELISA (f). And the IC50was 0.36 ng mL−1. The analytical range of the developed icELISA was 0.11–1.12 ng mL−1.
The specificity of the icELISA was evaluated by cross-reactivity (CR) of the mAb with 15 structural analogues of β-AAs. The CR values are summarized in that showed the CR values of the antibody with 2β-AAs were lower than 0.29%, and there was almost negligible recognition with the other 13β-AAs compounds (ractopamine, cimaterol, terbutaline, bambuterol, zilpaterol, mabuterol, brombuterol, formoterol, fenoterol, clenbuterol, penbutolol, cimbuterol and salbutamol,). These results showed that the mAb 3E2 was very specific for PEAA. It is reasonable that the mAb could not recognize the compounds containing hydroxy in the benzene ring. As this moiety was binding to antibody and the bottom of pocket was hydrophobic. The mAb could recognize clorprenaline and tulobuterol as compounds containing hydrophobic chlorine atomic in the benzene ring, but the shape was not exactly matched the binding pocket.
Table 1. The cross-reactivity(CR) values of the ELISA for detecting 16 β-agonists.
Matrix effect and recovery
In this study, due to the high salt tolerance, the antibody was used to detect PEAA in swine and sheep urine samples. The IC50 (0.36 ng mL−1) of PEAA was almost no influence in urine. The calculated LOD of the icELISA based on 3E2 for PEAA was 0.065 μg L−1 in swine and sheep urine.
The recovery and coefficient of variation (CV) are used to evaluate the accuracy and precision of the developed icELISA in swine urine and sheep urine samples. PEAA-negative urine samples were spiked with PEAA at three different concentrations (). The icELISA for the detection of PEAA in swine and sheep urine is demonstrated reliable with the recoveries ranging from 80.1% to 108.8% and the CV lower than 11.3%.
Table 2. The recoveries of the ELISA for the determination of PEAA in fortified urines.
Conclusions
In this study, a PEAA monoclonal antibody 3E2, which can tolerate 5 M NaCl solution, was prepared and used to develop ELISA. The high salt tolerance mechanism was analysed by homologous modeling and molecular docking, which indicated that the deep and rigid binding pocket of antibody binding cavity is the reason for the high salt tolerance of 3E2. Benefiting from the high salt tolerance, the ELISA based on 3E2 can detect PEAA in animal urine samples directly with satisfied recovery rate.
Supplemental Material
Download MS Word (34.2 KB)Disclosure statement
No potential conflict of interest was reported by the author(s).
Acknowledgments
This work was supported by the National Key R&D Program of China (2018YFC1602900) and the Sanming Project of Medicine in Shenzhen (SZSM201611068).
References
- Bai, Y. C., Jiang, H., Zhang, Y., Dou, L., Liu, M., Yu, W., Wen, K., Shen, J., Ke, Y., Yu, X., Wang, Z. (2021a). Hydrophobic moiety of capsaicinoids haptens enhancing antibody performance in immunoassay: Evidence from computational chemistry and molecular recognition. Journal of Agricultural and Food Chemistry, 69(34), 9957–9967. doi:10.1021/acs.jafc.1c03657
- Bai, Y. C., Wang, Y. H., Li, Q., Dou, L., Liu, M., Shao, S., Zhu, J., Shen, J., Wang, Z., Wen, K., Yu, W. (2021b). Binding affinity–guided design of a highly sensitive noncompetitive immunoassay for small molecule detection. Food Chemistry, 351, 129270. doi:10.1016/j.foodchem.2021.129270.
- Bai, Y. H., Liu, Z. H., Bi, Y. F., Wang, X., Jin, Y. Z., Sun, L., & Xu, S. X. (2012). Preparation of polyclonal antibodies and development of a direct competitive enzyme-linked immunosorbent assay to detect residues of phenylethanolamine A in urine samples. Journal of Agricultural and Food Chemistry, 60(46), 11618–11624. doi:10.1021/jf3036066
- Cao, B., Guangzhao, H., Hong , Y., Huafang, C., Shuqun , L., & Anping, D. (2013). Development of a highly sensitive and specific enzyme-linked immunosorbent assay (ELISA) for the detection of phenylethanolamine A in tissue and feed samples and confirmed by liquid chromatography tandem mass spectrometry (LC-MS/MS). Talanta, 115, 624–630. doi:10.1016/j.talanta.2013.06.026
- Dai, M. Y., Gong, Y. F., Liu, A., Zhang, L. L., Lin, J. X., Zhang, M. Z., & Yu, X. P. (2015). Development of a colloidal gold-based lateral-flow immunoassay for the rapid detection of phenylethanolamine A in swine urine. Analytical Methods, 7(10), 4130–4137. doi:10.1039/C5AY00641D
- Gagnon, J. K., Law, S. M., & Brooks, C. L. (2014). Flexible CDOCKER: Development and application of a pseudo-explicit structure-based docking method within CHARMM. Journal of Computational Chemistry, 106(2), 753–762. doi:10.1002/jcc.24259.
- Hu, Z. Q., Li, H. P., Liu, J. L., Xue, S., Gong, A. D., Zhang, J. B., Liao Y. C. (2016). Production of a phage-displayed mouse ScFv antibody against fumonisin B1 and molecular docking analysis of their interactions. Biotechnology and Bioprocess Engineering, 21(1), 134–143. doi:10.1007/s12257-015-0495-0
- Jiang, D., Cao, B., Wang, M., Yang, H., Zhao, K., Li, J., Li, M., Sun, L., & Deng, A. (2016). Development of a highly sensitive and specific monoclonal antibody based enzyme-linked immunosorbent assay for the detection of a new β-agonist, phenylethanolamine A, in food samples. Journal of the Science of Food and Agriculture, 97(3), 1001–1009. doi: 10.1002/jsfa.7826.
- Li, J., Chen, Y., Su, Y. Q., Ding, X. M., Xia, W. S., Liu, H. M., & Zhang, Y. B. (2017). Single-step multiresidue determination of β-lactam antibiotics and β-agonists in porcine muscle byliquid chromatography-tandem mass spectrometry. Food Analytical Methods, 10(7), 2185–2193. doi:10.1007/s12161-016-0738-5
- Li, J. H., Li, C., Wu, M., Zhang, Y., Ma, X., Cheng, H., & Yan, J. H. (2015a). Development of an ultrasensitive immunochromatographic assay (ICA) strip for the rapid detection of phenylethanolamine A in urine and pork samples. Journal of Food Science, 80(4), T894–T899. doi:10.1111/1750-3841.12814
- Li, X. M., Wang, W. J., Wang, L. M., Wang, Q., Pei, X. Y., & Jiang, H. Y. (2015b). Rapid determination of phenylethanolamine A in biological samples by enzyme-linked immunosorbent assay and lateral-flow immunoassay. Analytical and Bioanalytical Chemistry, 407(25), 7615–7624. doi:10.1007/s00216-015-8917-6
- Li, Y., Lu, S., Liu, Z., Sun, L., Guo, J., Hu, P., Zhang, J., Zhang, Y, Wang, Y., Ren, H., Meng, X., Zhou, Y. (2015c). A monoclonal antibody based enzyme-linked immunosorbent assay for detection of phenylethanolamine A in tissue of swine. Food Chemistry, 167, 40–44. doi:10.1016/j.foodchem.2014.06.085
- Li, Y., Ye, H. L., Liu, M., Song, S. Q., Chen, J., Cheng, W. K., Yan, L. P. (2021). Development and evaluation of a monoclonal antibody-based competitive ELISA for the detection of antibodies against H7 avian influenza virus. BMC Veterinary Research, 17(1), 64. doi:10.21203/rs.3.rs-36939/v2
- Liu, J., Zhang, H. C., Duan, C. F., Dong, J., Zhao, G. X., Wang, J. P., Li, N., Liu, J. Z., Li Y. W. (2016). Production of anti-amoxicillin ScFv antibody and simulation studying its molecular recognition mechanism for penicillins. Journalof Environmental Scienceand Health, Part B, 51(11), 742–750. doi:10.1080/03601234.2016.1198639
- Liu, Y., Cai, M., Wu, W., Fang, Y., She, P., Xu, S., & Bao, N. (2018). Multichannel electro-analytical devices for competitive ELISA of phenylethanolamine A. Biosensors & Bioelectronics, 99(2018), 21–27. doi:10.1016/j.bios.2017.04.002
- Liu, Y. H., Guo, Y. R., Wang, C. M., Gui, W. J., & Zhu, G. N. (2010). Homology modeling of anti-parathion antibody and its interaction with organophosphorous pesticides and analogues. Journalof Environmental Scienceand Health, Part B, 45(8), 819–827. doi:10.1080/03601234.2010.515501
- Mahalakshmi, N., Ravishankaran, R., Kamatchi, R., Sangith, N., Kaliraj, P., & Meenakshisundaram, S. (2019). Molecular evolution of single chain fragment variable (scFv) for diagnosis of lymphatic filariasis. Molecular Biology Reports, 46(5), 5409–5418. doi:10.1007/s11033-019-04995-1
- Mari, G. M., Li, H. F., Dong, B. L., Yang, H. J., Mi, J. F., Guo, L. C., Yu, X. Z., Han, D. G., Wang Z. H. (2021). Hapten synthesis, monoclonal antibody production and immunoassay development for direct detection of 4-hydroxybenzehydrazide in chicken, the metabolite of nifuroxazide. Food Chemistry, (1-2), 355:129598. doi:10.1016/j.foodchem.2021.129598
- Mei, L., Cao, B., Yang, H., Xie, Y., Xu, S., & Deng, A. (2014). Development of an immunoaffinity chromatography column for selective extraction of a new agonist phenylethylamine A from feed, meat and liver samples. Journal of Chromatography B, 945–946, 178–184. doi:10.1016/j.jchromb.2013.11.057
- Min, W. K., Cho, Y. J., Park, J. B., Bae, Y. H., Kim, E. J., Park, K., Park, Y. C., Seo J. H. (2010). Production and characterization of monoclonal antibody and its recombinant single chain variable fragment specific for a food-born mycotoxin, fumonisin B1. Biotechnology and Bioprocess Engineering, 33(1), 109–115. doi:10.1007/s00449-009-0350-9.
- Pawar, S. S., & Rohane, S. H. (2021). Review on Discovery Studio: An important tool for molecular docking. Asian Journal of Research in. Chemistry, 14(1), 1–3. doi:10.5958/0974-4150.2021.00014.6
- Sharma, S., Sharma, A., & Gupta, U. (2021). Molecular docking studies on the anti-fungal activity of allium sativum (garlic) against mucormycosis (black fungus) by BIOVIA Discovery Studio Visualizer 21.1. 0.0. Annals Antivirals and Antiretrovirals, 5(1), 028–032. doi:10.21203/rs.3.rs-888192/v1
- Sofia, T., Linda, A., Mark, D., Gualberto, G., Dacid, K. (2019). Structure and specificity of several triclocarban-binding single domain camelid antibody fragments. Journal of Molecular Recognition, 32(1), e2755. doi:10.1002/jmr.2755
- Tang, Q. H., Cai, F. D., Deng, A. P., & Li, J. G. (2015). Ultrasensitive competitive electrochemiluminescence immunoassay for the β-adrenergic agonist phenylethanolamine A using quantum dots and enzymatic amplification. Microchimica Acta, 182(1–2), 139–147. doi:10.1007/s00604-014-1292-8
- Türker, F., Noma, S., Akta, A., Tok, T. T., Ates, B., Gök, Y. (2020). The (NHC)PdBr 2 (2-aminopyridine) complexes: Synthesis, characterization, molecular docking study, and inhibitor effects on the human serum carbonic anhydrase and serum bovine xanthine oxidase. Monatshefte für Chemie-Chemical Monthly, 151(10), 1557–1567. doi:10.1007/s00706-020-02687-2
- Wang, L., Pu, R. C., Wang, X. X., Luo, C. Y., Zhang, L. C., Zhang X. S. (2015a). Multiresidue determination of β2-agonists including phenylethanolamine A in animal-derived food by ultra-high performance liquid chromatography/tandem mass spectrometry. Journal of Chromatographic Science, 53(6), 925–931. doi:10.1093/chromsci/bmu149
- Wang, X. M., Liufu, T. L., Beloglazova, N. V., Luo, P. J., Qu, J. W., & Jiang, W. X. (2016). Development of a competitive indirect enzyme-linked immunosorbent assay for screening phenylethanolamine A residues in pork samples. Food Analytical Methods, 9(11), 3099–3106. doi:10.1007/s12161-016-0500-z
- Wang, Z. H., Mi, T., Beier, R. C., Zhang, H., Sheng, Y., Shi, W., Zhang, S., & Shen, J. (2015b). Hapten synthesis, monoclonal antibody production and development of a competitive indirect enzyme–linked immunosorbent assay for erythromycin in milk. Food Chemistry, 171, 98–107. doi:10.1016/j.foodchem.2014.08.104
- Yan, P. P., Zhang, J., Tang, Q. H., Deng, A. P., & Li, J. G. (2014). A quantum dot based electrochemiluminescent immunosensor for the detection of pg level phenylethanolamine A using gold nanoparticles as substrates and electron transfer accelerators. Analyst, 139(17), 4365–4372. doi:10.1039/C4AN00378K
- Zhang, L., Gong, Y., Zhang, M., Xi, X., Li, M., Chen, Z, Yu, X., Zhou, Y. (2014). Development of a monoclonal antibody-based direct competitive enzyme-linked immunosorbent assay for a new β-adrenergic agonist phenylethanolamine A. Analytical Methods, 6(15), 5942–5950. doi:10.1039/C4AY00682H
- Zhang, M. X., Li, C., & Wu, Y. L. (2012). Determination of phenylethanolamine A in animal hair, tissues and feeds by reversed phase liquid chromatography tandem mass spectrometry with QuEChERS. Journal of Chromatography B, 900, 94–99. doi:10.1016/j.jchromb.2012.05.030