
 ?Mathematical formulae have been encoded as MathML and are displayed in this HTML version using MathJax in order to improve their display. Uncheck the box to turn MathJax off. This feature requires Javascript. Click on a formula to zoom.
ABSTRACT
A pre-column derivatization liquid chromatographic method was developed for the simultaneous determination of both glucosamine and galactosamine in selected food samples. The derivatization of glucosamine and galactosamine with 9-fluorenylmethoxycarbonyl chloride was accomplished under alkaline conditions and UV irradiation. When the detection wavelength was 265 nm and acetonitrile-0.1% phosphoric acid was the mobile phase at a flow rate of 1.0 mL/min, the linear range of ultraviolet intensity of glucosamine and galactosamine was 10–100 μg/mL,correlation coefficient of glucosamine was 0.9994 and correlation coefficient of galactosamine was 0.9993. The standard recovery of three kinds of food was in the range of 94.09–114.5%, the relative standard deviation (RSD) was 0.38–5.29%, the detection limit was 1.0 mg/kg, and the quantitative limit was 4.0 mg/kg. The results of this research indicate that this method is suitable for the simultaneous determination of glucosamine and galactosamine in food.
Highlights
Simultaneous detection of HPLC for GlcN and GalN in food were built.
Galactosamine was derivatized with 9-fluorenylmethoxycarbonyl chloride (FMOC-Cl).
The established method was applied to the detection of actual samples.
It was subjected to quantitative and qualitative analytical GlcN and GalN in food.
1. Introduction
Glucosamine (GlcN) and galactosamine (GalN) are C-4 differential isomers formed by replacing the hydroxyl group at the C2 position of glucose with an amino group. GlcN and GalN show multiple biological activities. Glucosamine is a natural amino monosaccharide that is an intermediate in the synthesis of proteoglycan macromolecules. Mucopolysaccharides, glycoproteins, and proteoglycans can be synthesized from glucosamine. Glucosamine is an intermediate in the synthesis of articular cartilage and synovial fluid molecules promote the synthesis of cartilage and inhibit the breakdown of articular cartilage. Glucosamine also has an anti-inflammatory effect and stimulates chondrocyte growth (Ilic et al., Citation2008; Jin et al., Citation2011; Kosman et al., Citation2017; Zhou et al., Citation2004). Chinese drug standard WS1-(X-090)-2005Z is used to determine the content of glucosamine hydrochloride capsules by UV spectrophotometry after the Elson-Morgan reaction. Following the standard GB/T20365-2006, when the detection wavelength was 195 nm, the baseline noise was higher and the detection sensitivity of the instrument was reduced (Hairui et al., Citation2016; Zhang et al., Citation2006). With the widespread use of glucosamine in health products, its detection methods have become a contemporary research hotspot in the food industry. Galactosamine is a hepatocyte uracil phosphate nucleoside disruptor. Uridine phosphate was depleted after galactosamine enters the body, resulting in damage to a series of organelles as well as protein synthesis disruption, which results in liver cell damage (Gong et al., Citation2007; Liang-ming et al., Citation2006; Nakama et al., Citation2001; Sinha et al., Citation2007; Tunc & Sehnaz, Citation2008;Woo-Cheol et al., Citation2009). Because of the cytotoxic effect of galactosamine, monitoring its level in food is important to protect the health of consumers. In view of the difference in biological activity and functional properties of glucosamine and galactosamine, simultaneous determination of glucosamine and In view of the difference in biological activity and functional properties of glucosamine and galactosamine in the same substance is of great significance for human health.
At present, there are many reports on the detection methods of glucosamine at home and abroad, but there are few methods to detect glucosamine and galactosamine simultaneously. The main methods for determining glucosamine and galactosamine were colorimetric (Thomas A. & Samuel P., Citation1964) and ion chromatographic methods (Maurizio et al., Citation2001). However, these methods are less stable, less accurate, and less sensitive, especially for the determination of trace substances.
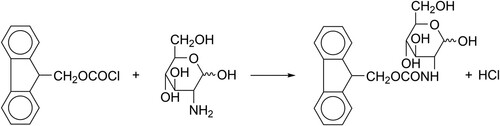
With advancements in technology, the use of analytical tests is becoming more widespread. Currently, the most commonly used method for sugar detection is HPLC (Rajarshi & Paul, Citation2019). More accurate qualitative and quantitative analysis can be obtained by selecting the appropriate derivatization reagent, derivatization mode, mobile phase, detector, etc. Due to its sensitivity and high efficiency, pre-column derivatization liquid chromatography is gradually becoming a popular method for the analysis of glucosamine and galactosamine.9-fluorenylmethoxycarbonyl chloride (FMOC-Cl) can react with primary and secondary amino sugars or amino acids as a derivative reagent. The principle of this study is that under alkaline conditions, glucosamine ((a)) and galactosamine ((b)) were derivatized with 9-fluorenylmethoxycarbonyl chloride (FMOC-Cl) (). Glucosamine and galactosamine are C-4 differential isomers of each other and react following the same principle.
Figure 1. Glucosamine and Galactosamine structural formula. (a) Glucosamine (b) Galactosamine.
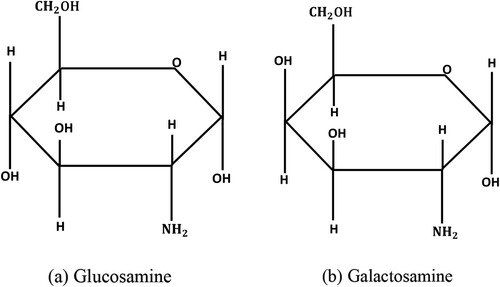
Figure 2. Reaction equation of 9-fluorenylmethoxycarbonyl chloride with glucosamine.
2. Materials and methods
2.1 Reagents and instruments
2.1.1 Experimental materials and reagents
Bird's nests (instant stewed bird's nest, triangle bird's nest, pure bird's nest, dried bird's nest) as solid substrate, milk as liquid substrate, and starch as blank substrate were purchased from a retail market.
Glucosamine hydrochloride, galactosamine hydrochloride, and 9-fluorenylmethyloxycarbonyl chloride were obtained from Shanghai Macklin Biochemical Co., Ltd. Acetic acid was ordered from Tokuyama Pharmaceutical Co., Ltd., Shanghai, China. Amino acids mixture standard solution was ordered from Fujifilm Wako Pure Chemical Co., Ltd., Japan. Boric acid was ordered from Shanghai Yunling Chemical Plant. Hydrochloric acid, phosphoric acid, and sodium hydroxide were obtained from Sinopharm Chemical Reagent Co., Ltd. Ultrapure water was used in all experiments.
2.1.2 Experimental instruments
Derivatised compounds were detected by HPLC apparatus-2695 Series HPLC – (Waters Corporation, USA).
Reaction system was occured in Digital display constant-temperature six-hole water bath – (Yinzhou Qun'an Experimental Instrument Co., Ltd., Ningbo, China)
Solution pH need pH meter – (Instrument Co., Ltd. Shanghai, China) to measure in pretreatment and reaction system.
High-speed centrifuge instrument – (Xiangyi Laboratory Instrument Development Co., Ltd., Hunan, China) was used to extract supernatant.
Electronic analytical balance – (Huazhi Electronic Technology Co., Ltd., China) was used to weight materials and samples.
Vortex Mixer – (IKA Works Co., Ltd., Guangzhou China) was used to mix reactants and products.
Ultrapure water was prepared by ultrapure water system – (Hetai Instrument Co., Ltd., Shanghai, China).
2.1.3 Solution preparation
The glucosamine hydrochloride and galactosamine hydrochloride standard reference reserve solution was prepared by precisely weighing 0.4 g each of glucosamine hydrochloride and galactosamine hydrochloride standards, which were then dissolved in 0.1 M hydrochloric acid in a 100 mL brown volumetric flask. The flask was kept cold at 0–4 oC and away from light. When using the solution, it was diluted with 0.1 M hydrochloric acid to the required concentration.
The glucosamine hydrochloride standard reference solution was prepared by precisely weighing 0.4 g of glucosamine hydrochloride standard and then dissolving it in 0.1 M hydrochloric acid in a 100 mL brown volumetric flask. The flask was kept cold at 0–4 oC and away from light.
The galactosamine hydrochloride standard reference solution was prepared by precisely weighing 0.4 g of galactosamine hydrochloride standard and then dissolving it in 0.1 M hydrochloric acid in a 100 mL brown volumetric flask. The flask was kept cold at 0–4 oC and away from light.
The 9-fluorenylmethoxycarbonyl chloride standard reference solution was prepared by precisely weighing 0.05 g of 9-fluorenylmethoxycarbonyl chloride standard and then dissolving it in acetonitrile in a 10 mL brown volumetric flask. The flask was kept cold at 0–4 oC and away from light. It was used within 48 h of preparation.
The sodium hydroxide reserve solution was prepared by dissolving sodium hydroxide (0.1 g) in 250 mL ultrapure water in a volumetric flask. Then, a 0.01 M sodium hydroxide solution was prepared and stored until later use.
The borate buffer solution reserve solution was prepared by mixing boric acid (2.40 g) and sodium hydroxide (1.14 g) and then dissolving them in ultrapure water in a 100 mL volumetric flask. A pH 10 borate buffer solution was prepared.
The derivatization termination solution was prepared by mixing acetic acid and acetonitrile (volume ratio 2: 8) and storing the mixture away from light.
2.2 Liquid chromatography
HPLC was performed using a 5 µm 4.6 × 150 mm Eclipse XDB-C18 column (Agilent). The mobile phases were 0.1% phosphoric acid solution (A) and HPLC-grade acetonitrile (B). The flow rate was 1 mL/min, the injection volume was 20 µL, the detection wavelength was 265 nm, and the column temperature was 25 ℃. Gradient elution was performed using the time gradient shown in .
Table 1. Mobile phase time gradient.
2.3 Experimental methods
2.3.1 Sample preparation
First, after all samples were crushed and homogenized, 0.10 g of each sample was weighed and dissolved in 4.0 M hydrochloric acid in a 5 mL volumetric flask. The solution was shaken well by a water bath (90 ℃) for 3.0 h. After the solution was blown by N2 gas, the residue was diluted in ultrapure water to 10 mL in a volumetric flask. The sample was centrifuged for 5 min at 10,000 r/min, and then the supernatant was removed and set aside.
2.3.2 Derivatization method
A 0.2 mL sample of glucosamine hydrochloride and galactosamine hydrochloride standard solution was precisely extracted. Then, 0.2 mL of borate buffer solution and 0.1 mL 9-fluorenylmethoxycarbonyl chloride solution were successively shaken on a vortex mixer. After mixing, the system was allowed to stand for 10 min. Then, 0.2 mL derivatization termination solution was added, and when the reaction was complete, it was filtered through a 0.45 μm microporous filter. The filtrate was collected in an HPLC injection vial (Zhu et al., Citation2005).
2.3.3 Sample pretreatment
A 0.1 g sample was precisely weighed and then added to 4.0 M hydrochloric acid (HCl) or 4.0 M trifluoroacetic acid (TFA) solution separately into 5 mL volumetric flasks. The solution was shaken on a vortex mixer. The solution was reacted in a constant-temperature water bath at temperature 90 oC for 3.0 h. After the solution was blown using N2 gas, the residue was diluted in ultrapure water in a 10 mL volumetric flask. The solution was centrifuged for 5 min at 10,000 r/min, and then the supernatant was removed,and the derivatization reaction was monitored according to the derivatization method in section 2.3.2. Derivatised compounds were collected in an HPLC injection vial.
2.4 Standard curve establishment
The glucosamine hydrochloride and galactosamine hydrochloride standard reference reserve solution was diluted to a concentration of 100 µg/mL, and 0.1, 0.2, 0.5, 0.8, and 1.0 mL samples were extracted. The derivatization reaction was carried out according to the method in section 2.3.2. After filtering through a 0.45 μm microporous filter, followed by high-performance liquid chromatography and UV detection, the standard curve was obtained.
3. Results and discussion
3.1 Chromatography
3.1.1 Detection wavelength
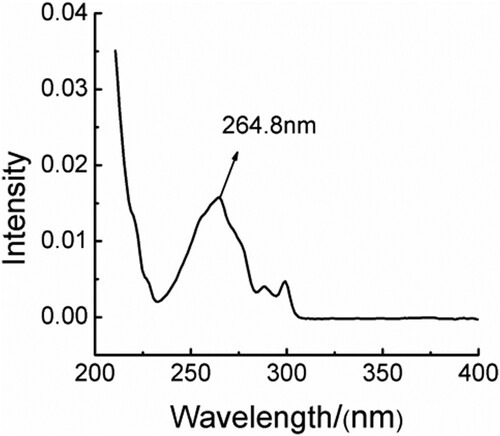
UV spectrophotometry was used to obtain a wavelength scan spectrum from 200 to 400 nm, and spectral peaks appeared at 264.8 nm. As shown in , the absorption wavelength of derivatised compounds via derivatization reaction of glucosamine hydrochloride and galactosamine hydrochloride were measured to be 265 nm.
Figure 3. UV spectrum of derivatised compounds.
3.1.2 Selection of the mobile phase
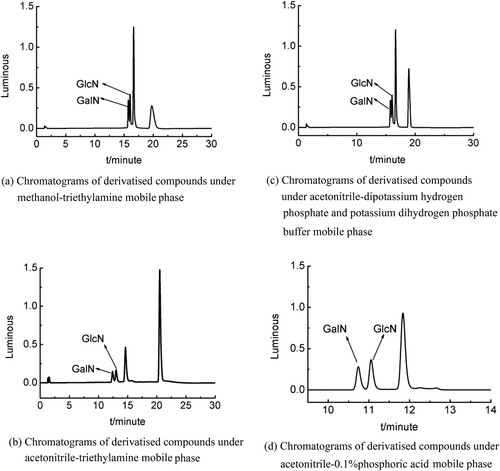
Different mobile phases were investigated. Acetonitrile was selected as the organic phase because it has a better separation effect for derivatised compounds than methanol((a and b)). In terms of the aqueous phase, the effects of dipotassium hydrogen phosphate and potassium dihydrogen phosphate buffer, phosphoric acid, and triethylamine on the separation were investigated. According to the separation of the target peak ((c and d)), when the acetonitrile-0.1%phosphoric acid mixture was selected as the mobile phase, the elution effect was stronger than others.
Figure 4. (a) Chromatograms of derivatised compounds under methanol-triethylamine mobile phase. (b) Chromatograms of derivatised compounds under acetonitrile-triethylamine mobile phase. (c) Chromatograms of derivatised compounds under acetonitrile-dipotassium hydrogen phosphate and potassium dihydrogen phosphate buffer mobile phase. (d) Chromatograms of derivatised compounds under acetonitrile-0.1%phosphoric acid mobile phase.
3.1.3 Selection of the elution method
During the experiment, continuous elution and gradient elution methods were studied. During continuous elution, environmental factors were unstable. Therefore, gradient elution was selected to separate the target peaks. The elution ratio of the mobile phase was continuously adjusted according to the degree of elution, and the gradient elution rate was determined, as shown in .
3.2 Selection of derivatization conditions
3.2.1 Selection of derivatization pH
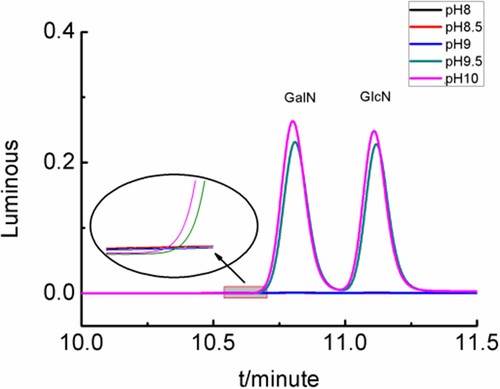
A 0.2 mL sample of the glucosamine hydrochloride and galactosamine hydrochloride standard solution was precisely extracted. Then, 0.2 mL of borate buffer solution at pH values of 9.0, 9.5, and 10 were added separately. The derivatization reaction (2.3.2) was shown in . When the solution pH was belowed 9.0, the derivatization reaction could not occur. The effect of the derivatization reaction at pH 10 was better than at pH 9.5. If the solution pH was greater than 10, the Eclipse XDB-C18 column that was used in the HPLC would be destroyed.
Figure 5. Chromatograms of derivatised compounds under different pH.
3.2.2 Selection of the derivatization time
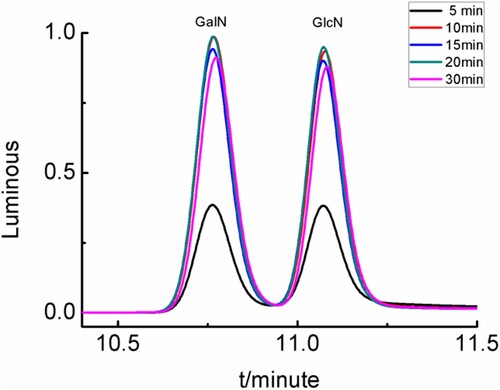
The derivatization reaction (2.3.2) was conducted under different reaction times of 5, 10, 15, 20, and 30 min, and the resulting chromatograms of derivatised compounds were shown in . When the reaction time was 10, 15, or 20 min,the chromatogram peaks area of derivatised compounds were better than other reaction times. So, a reaction time of 10 min was the optimal condition.
Figure 6. Chromatograms of derivatised compounds under different reaction time.
3.2.3 Selection of derivatization temperature
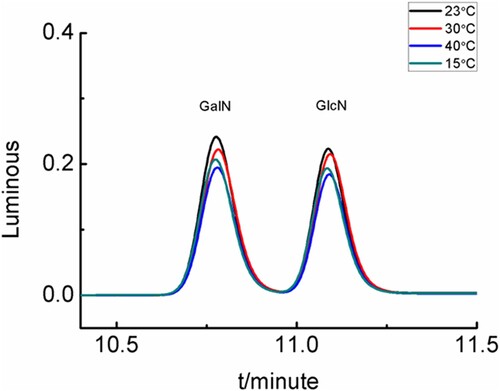
During the derivatization reaction (2.3.2), temperatures of 15, 23(room temperature), 30, 35, and 40 ℃ were used. The resulting chromatograms of the derivatised compounds were shown in . When the reaction temperature were 23 ℃and 30℃, the chromatogram peaks area of derivatised compounds were greater. To facilitate the test operation, a reaction temperature of room temperature was the optimal condition.
Figure 7. Chromatograms of derivatised compounds under different reaction temperature.
3.3 Determination of derivatization peaks
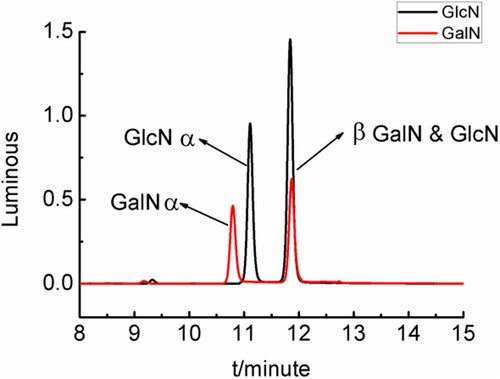
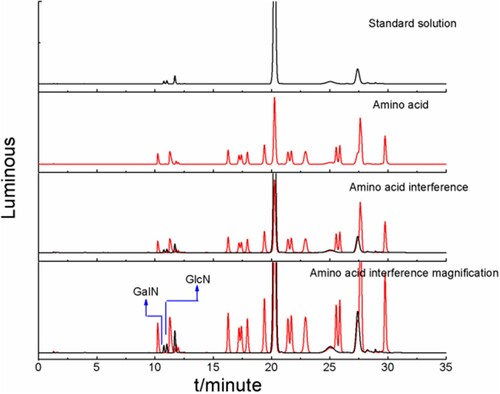
Derivatization of glucosamine and galactosamine produced two isomers, which displayed separate α and β double peaks in the HPLC chromatograms of derivatised compounds in . Since the β peaks of derivatised compounds of glucosamine and galactosamine overlapped, due to the derivatization reaction (2.3.2). So the derivatization effect was qualitatively and quantitatively assessed using the α peak. It was shown that the derivatised compounds of galactosamine (GalN) peak was at 10.75 min, and the derivatised compounds of glucosamine (GlcN) peak appeared at 11.17 min.
Figure 8. Chromatograms of derivatised compounds of GlcN and GalN standards solutions.
3.4 Interference experiment of amino acids in food
Free amino acids in food can react with 9-fluorenylmethoxycarbonyl chloride (Elisabeth L et al., Citation2005; Herbert et al., Citation2000; Jámbor & Molnár-Perl, Citation2009; López-Cervantes et al., Citation2006). In the experiment, a standard amino acid solution was added to the sample solution, and the derivatization reaction of amino acids was monitored according to the derivatization method in Section 2.3.2.
According to the chromatograms (), within the retention time range of 10–12 min, amino acids did not interfere with derivatised compounds of glucosamine and galactosamine.
Figure 9. Amino acid interference chromatograms.
3.5 Selection of sample pretreatment conditions
3.5.1 Selection of acid
Sample was added to 4.0 M hydrochloric acid (HCl) or 4.0 M trifluoroacetic acid (TFA) solution. After the solutions were prepared via Section 2.3.3, and derivatised compounds were prepared via Section 2.3.2. As shown in and , the derivatization effect using hydrochloric acid was better than trifluoroacetic acid.
Figure 10. Sample pretreatment effect under different acids.
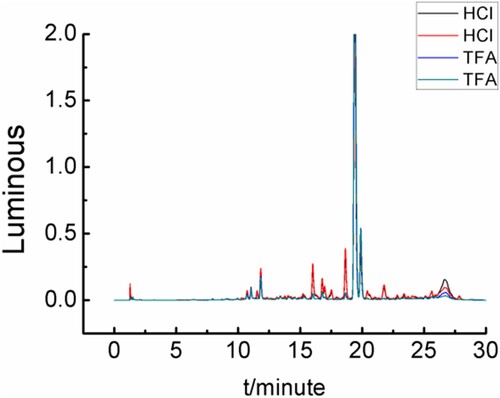
Table 2. Sample pretreatment effects under different acids.
3.5.2 Selection of sample pretreatment temperature
Sample was added to 4.0 M hydrochloric acid solution. According Section 2.3.3,The solution was reacted in an adjustable-temperature water bath at 70°C, 80°C, 90°C and 100 oC for 3.0 h, and derivatised compounds were prepared via Section 2.3.2. As shown in and , 90 oC provided better results than other temperatures.
Figure 11. Sample pretreatment effect under different temperature.
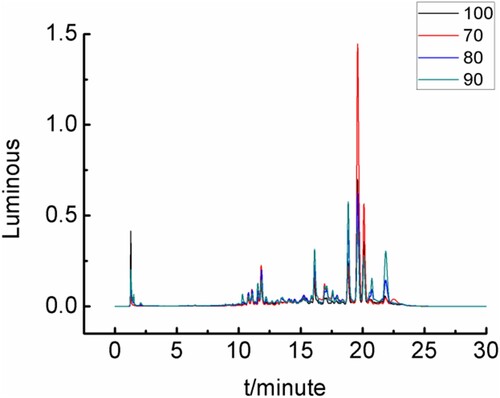
Table 3. Sample pretreatment effect under different temperature.
3.6 Methodology validation
3.6.1 Linearity
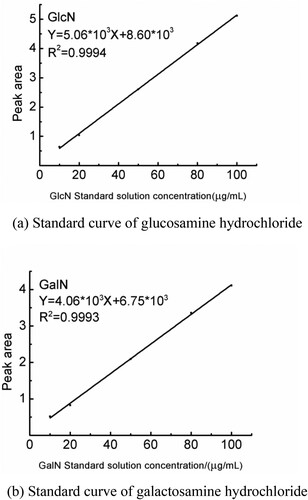
According to the method in Section 2.3, the standard curve was established using standard solutions with concentrations of 10, 20, 50, 80, and 100 µg/mL for liquid-phase determination. Using the peak area of derivatised compounds as the ordinate, and the amount of standard glucosamine hydrochloride and galactosamine hydrochloride standards added as the abscissa, two standard curves were drawn. Regression was conducted to obtain the glucosamine hydrochloride linear equation Y = 5.06×10³X + 8.60×10³, R2 = 0.9994, and the galactosamine hydrochloride linear equation was Y = 4.06×10³X+ 6.75×10³, R2 = 0.9993. In the range of 10–100 μg/mL, a good linear relationship was obtained, as shown in (a and b).
Figure 12. (a) Standard curve of glucosamine hydrochloride. (b) Standard curve of galactosamine hydrochloride.
3.6.2 Detection limit determination
According to the research method described in section 2.3, pretreament of samples and analytical detection of derivatised compounds were carried out. The detection limit was 1.0 mg/kg, which was calculated as three times the signal-to-noise ratio (S/N = 3), and the quantitative limit was 4.0 mg/kg, which was calculated as 10 times the signal-to-noise ratio (S/N = 10). These values indicate the high sensitivity of the method.
3.6.3 Recovery experiment and precision
According to the method described in section 2.3, a labelled recovery test was carried out for three kinds of food, including edible bird's nest, milk, and starch (chromatograms were shown in ). Three different concentrations of glucosamine hydrochloride and galactosamine hydrochloride standards solution (10, 20, and 100 μg/mL) were also added. The recovery and relative standard deviation (RSD) were calculated, and the results were shown in . As shown in , the sample recovery rate ranged from 94.09 to 114.15%, and the RSD ranged from 0.38 to 5.29% (n = 6). Equation (1) was used to calculate the sample recovery rate (P) from the concentrations, and Equation (2) was used to calculate the relative standard deviation. These metrics were met the requirements for an experimental analysis method and shown that this method has good precision and high accuracy.
(1)
(1)
(2)
(2)
Figure 13. Chromatograms of samples with added standards.
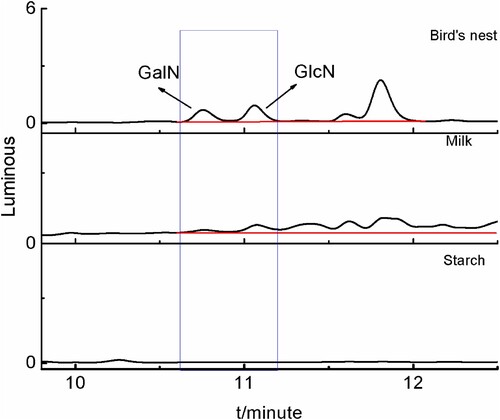
Table 4. Recovery and precision of GlcN and GalN in different food substrates.
3.6.4 Stability of derivatised compounds
The stability of the derivatised compounds was investigated. According to the experimental method in section 2.3, the derivatized sample solution was stored at 4 ℃ in the dark, and samples were injected every 1.0 h for determination. As shown in , after 10 h, the derivatised compounds remained stable, and the difference between the maximum concentration and the minimum concentration was less than 0.48%.
Table 5. Change in the front area within 10 h.
3.7 Actual sample testing
This method can be applied to a variety of food substrates. In this experiment, the glucosamine and galactosamine contents of three kinds of commercially-available preserved foods (edible bird's nest, milk, and starch) were analysed according to the newly-established method (chromatogram was shown in ). The detection results were shown in .
Figure 14. Chromatograms of samples.
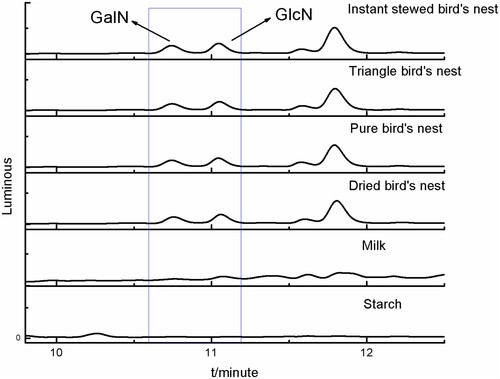
Table 6. Actual sample detection values.
4. Conclusion
A method for the simultaneous detection of glucosamine and galactosamine in foods has rarely been reported. In this work, an HPLC analysis method was established in which glucosamine and galactosamine samples and 9-fluorenylmethoxycarbonyl chloride were used to generate compounds via UV absorption. The target compounds were separated by liquid chromatography. The results were shown that the linear range of the peak area of glucosamine standard was 10–100 µg/mL, as so as galactosamine standard. The recoveries of three kinds of food were approximately 94.09–114.15%, the RSD was 0.38–5.29%, and the detection limit was 1.0 mg/kg. This method was shown that the pretreatment conditions were optimized and the detection time was shortened. This method was suitable for simultaneously detecting glucosamine and galactosamine in a variety of foods and has high sensitivity and strong specificity.
Ethical approval
This article does not contain any studies with human participants or animals performed by any of the authors.
Disclosure statement
No potential conflict of interest was reported by the author(s).
Data availability statement
All data generated or analysed during this study are included in this published article.
Additional information
Funding
References
- Elisabeth L, S., William L, R., & Marzia, P. (2005). Analysis of plasma amino acids by HPLC with photodiode array and fluorescence detection. Clinica Chimica Acta, 354(1), 83–90. https://doi.org/10.1016/j.cccn.2004.11.016
- Gong, P., Wang, Z.-Y., & Wang, H.-J. (2007). Protective effects of pLNCX-SOD gene transfection on hepatocyte injury induced by obstructive jaundice in rats. Hepatobiliary & Pancreatic Diseases International: HBPD INT, 6(2), 194–198.
- Hairui, S., Kedi, X., Hengyi, Z., Xiaoxiang, Z., & Zheng, X. (2016). Determination of glucosamine and its derivatives released from photocrosslinked gelatin hydrogels using HPLC. Biomedical Chromatography: Bmc, 30(2), 169–174. https://doi.org/10.1002/bmc.3533
- Herbert, P., Barros, P., Ratola, N., & Alves, A. (2000). HPLC determination of amino acids in musts and port wine using OPA/FMOC derivatives. Journal of Food Science, 65(7), 1130–1133. https://doi.org/10.1111/j.1365-2621.2000.tb10251.x
- Ilic, M. Z., Martinac, B., Samiric, T., & Handley, C. J. (2008). Effects of glucosamine on proteoglycan loss by tendon, ligament and joint capsule explant cultures. Osteoarthritis and Cartilage, 16(12), 1501–1508. https://doi.org/10.1016/j.joca.2008.04.026
- Jámbor, A., & Molnár-Perl, I. (2009). Amino acid analysis by high-performance liquid chromatography after derivatization with 9-fluorenylmethyloxycarbonyl chloride. Journal of Chromatography A, 1216(15), 3064–3077. https://doi.org/10.1016/j.chroma.2009.01.068
- Jin, P., Yan, X., Wang, Z., Wu, X., Zou, D., Hu, X., & Sun, C. (2011). Development, comparison, and peak validation of a high-performance liquid chromatography method for direct determination of glucosamine hydrochloride in pharmaceutical formulations. Journal of Liquid Chromatography & Related Technologies, 34(20), 2533–2547. https://doi.org/10.1080/10826076.2011.591032
- Kosman, V., Karlina, M., Pozharitskaya, O., Shikov, A., & Makarov, V. (2017). HPLC determination of glucosamine hydrochloride and chondroitin sulfate, weakly absorbing in the near UV region, in various buffer media. Journal of Analytical Chemistry, 72(8), 879–885. https://doi.org/10.1134/S106193481708007X
- Liang-ming, L., Jie, L., Ji-xiang, Z., Huan, D., Shui-lin, S., & Gao-fei, X. (2006). Role of hepatocellular apoptosis and mechanisms of liver injury in lipopolysaccharide-induced acute liver failure in D-galactosamine-sensitized rats. Zhonghua yi xue za zhi, 86(30), 2122–2126.
- López-Cervantes, J., Sánchez-Machado, D. I., & Rosas-Rodríguez, J. A. (2006). Analysis of free amino acids in fermented shrimp waste by high-performance liquid chromatography. Journal of Chromatography A, 1105(1), 106–110. https://doi.org/10.1016/j.chroma.2005.08.040
- Maurizio, C. G., Salvatore, C., Alida Maria, F., Rosalia, V., & Alberto, C. (2001). Improved high-performance liquid chromatographic method to estimate aminosugars and its application to glycosaminoglycan determination in plasma and serum. Journal of Chromatography B: Biomedical Sciences and Applications, 765(2), 151–160. https://doi.org/10.1016/S0378-4347(01)00427-3
- Nakama, T., Hirono, S., Moriuchi, A., Hasuike, S., Nagata, K., Hori, T., Ido, A., Hayashi, K., & Tsubouchi, H. (2001). Etoposide prevents apoptosis in mouse liver with D -galactosamine/lipopolysaccharide-induced fulminant hepatic failure resulting in reduction of lethality. Hepatology, 33(6), 1441–1450. https://doi.org/10.1053/jhep.2001.24561
- Rajarshi, G., & Paul, K. (2019). HPLC with charged aerosol detector (CAD) as a quality control platform for analysis of carbohydrate polymers. BMC Research Notes, 12(1), 268. https://doi.org/10.1186/s13104-019-4296-y
- Sinha, M., Manna, P., & Sil, P. C. (2007). Amelioration of galactosamine-induced nephrotoxicity by a protein isolated from the leaves of the herb, Cajanus indicus L. BMC Complementary and Alternative Medicine, 7(1), 11. https://doi.org/10.1186/1472-6882-7-11
- Thomas A., G., & Samuel P., B. (1964). Determination of glucosamine and galactosamine using borate buffers for modification of the Elson-Morgan and Morgan-Elson reactions. Analytical Biochemistry, 9(3), 253–262. https://doi.org/10.1016/0003-2697(64)90183-6
- Tunc, C., & Sehnaz, B. (2008). Combination of selenium and three naturally occurring antioxidants administration protects D-galactosamine-induced liver injury in rats. Biological Trace Element Research, 122(2), 127–136. https://doi.org/10.1007/s12011-007-8061-z
- Woo-Cheol, L., Joon-Ki, K., Jung-Woo, K., Woo-Yong, O., Joo-Yeon, J., Shik, K. Y., Ah, J. H., Sue, C. J., & Sun-Mee, L. (2009). Palmatine attenuates d-galactosamine/lipopolysaccharide-induced fulminant hepatic failure in mice. Food and Chemical Toxicology, 48(1), 222–228. https://doi.org/10.1016/j.fct.2009.10.004
- Zhang, L.-j., Huang, T.-m., Fang, X.-l., Li, X.-n., Wang, Q.-s., Zhang, Z.-w., & Sha, X.-y. (2006). Determination of glucosamine sulfate in human plasma by precolumn derivatization using high performance liquid chromatography with fluorescence detection: Its application to a bioequivalence study. Journal of Chromatography. B, Analytical Technologies in the Biomedical and Life Sciences, 842(1), 8–12. https://doi.org/10.1016/j.jchromb.2006.04.045
- Zhou, J. Z., Waszkuc, T., & Mohammed, F. (2004). Single laboratory validation of a method for determination of glucosamine in raw materials and dietary supplements containing glucosamine sulfate and/or glucosamine hydrochloride by high-performance liquid chromatography with FMOC-Su derivatization. Journal of AOAC International, 87(5), 1083–1092. https://doi.org/10.1093/jaoac/87.5.1083
- Zhu, X., Cai, J., Yang, J., & Su, Q. (2005). Determination of glucosamine in impure chitin samples by high-performance liquid chromatography. Carbohydrate Research, 340(10), 1732–1738. https://doi.org/10.1016/j.carres.2005.01.045