
ABSTRACT
An immunochromatographic assay (ICA) based on surface-enhanced Raman scattering (SERS) for ultrasensitive and quantitative detection of florfenicol (FF) in food samples was developed. Au nanocubers (AuNCs) with long wavelength absorption were synthesised, characterised and used as the substrate in SERS-ICA. Immunoprobe was prepared by linking Raman reporter and the antibody against FF on AuNCs. The SERS-ICA was completed in 15 min. By measuring the Raman intensities on T lines, quantitative detection of FF was achieved. The IC50 and limit of detection (LOD) of the assay for FF were 0.027 ng mL−1 and 0.12 pg mL−1, respectively. The cross-reactivity (CR) of the assay with thiamphenicol, chloramphenicol and other four drugs were examined. The recoveries of FF in spiked samples were 88.5% ∼ 102.4% with RSD of 2.3% ∼ 7.4%. It was proven that SERS-ICA was able to rapidly detect FF in food samples with high sensitivity, accuracy and precision.
Introduction
Florfenicol (FF) is a broad-spectrum antibiotic used in veterinary medicine belonging to the family of compounds that includes thiamphenicol and chloramphenicol (). All three drugs act by inhibiting bacterial protein synthesis by binding to 50S and 70S subunits in the ribosome to abolish the activity of peptidyltransferase (Anadón et al., Citation2008; Cannon et al., Citation1990). FF is an analogue of chloramphenicol which was once widely used in both human and veterinary medicine but is currently banned for use in food-producing animals in many countries due to its threat to human health through genotoxic effects and blood dyscrasias such as aplastic anaemia. FF was developed as an alternative to chloramphenicol by the substitution of a nitro group with a methane sulphonyl group. In addition, due to the substitution of the hydroxy group at the C-3 site of chloramphenicol with fluorine, FF exhibits activity against chloramphenicol-resistant and thiamphenicol-resistant bacterial strains, which would otherwise inactivate those compounds acetylation of their hydroxy groups via chloramphenicol acetyltransferase production (Fodey et al., Citation2013; Saito-Shida et al., Citation2019). FF is unionised in a pH range from 3 to 9 and also poorly soluble in aqueous solutions. Because of its lipophilicity, FF shows a good tissue penetration and is active at lower concentrations against a number of bacterial pathogens. It is considered that the antibacterial activity of FF is better than chloramphenicol and thiamphenicol but with lower toxicity. Due to these advantages, FF is now widely used for the treatment or prevention of bacterial infectious diseases in livestock and aquaculture (Xie et al., Citation2018; Zeng et al., Citation2019). However, FF still displays some extent toxic side effects such as immunotoxicity and embryotoxicity (Sadeghi & Olieaei, Citation2019; Tao et al., Citation2014). To ensure food safety, the application of FF is strictly controlled. China, United States and European have set a maximum residue limits (MRL) value for FF from 100 to 3000 mg kg−1 in animal derived foods (Wang et al., Citation2019).
The main analytical methods for the determination of FF residues in food samples are chromatographic methods including GC-MS (Tian et al., Citation2017; Wu et al., Citation2015), LC (Rairat et al., Citation2020), LC-MS/MS (Sichilongo & Kolanyane, Citation2020; Xu et al., Citation2015). Normally the chromatographic methods are accurate and sensitive, but they exhibit some disadvantages such as complicated performance, expensive instruments and the need for specialised technicians. Enzyme linked-immunosorbent assay (ELISA) with high sensitivity and specificity has also been used for the detection of FF in food samples (Li et al., Citation2018). However, the operation of ELISA is time-consuming and laborious.
As a point-of-care (POC) testing technology, immunochromatographic assay (ICA) performed on membrane has been intensively studied and widely used in clinical, biological, environmental, and food analytical fields due to its simplicity, short times to obtain test results, a user-friendly format, low cost, and long-term stability (Bahadır & Sezgintürk, Citation2016; Mak et al., Citation2016). The most commonly used ICA is based on colloidal gold nanoparticles (NPs) displaying red colour on testing (T) line for qualitative or seme-quantitative detection. In the last decades, many quantitative ICAs using different NPs as signal read-out such as quantum dots, up-converting phosphor NPs, dye-doped NPs, etc. have been developed (Juntunen et al., Citation2012; Taranova et al., Citation2015).
Surface-enhanced Raman scattering (SERS) refers to the phenomenon that when Raman active substances are adsorbed on the surface of rough noble metals (gold, silver, etc.), the Raman intensities of the substances can be greatly amplified (Schlucker, Citation2014; Sharma et al., Citation2012). Currently, electromagnetic (EM) and charge transfer (CT) theories are accepted for the explanation of enhancement mechanism of SERS (Li et al., Citation2017; Weiss & Haran, Citation2001). In EM theory, the enhancement mainly results from the interactions between the molecules and the huge local surface plasmon resonance (LSPR) on the substrate induced by incident laser. In CT theory, the enhancement involves a strong charge transfer between the molecules and the substrate in the electronic resonance transition. In addition, the enhancement efficiency of EM is several magnitudes higher than that of CE. The high enhancement efficiency makes the SERS to be the most sensitive analytical technique even for the detection of a single molecule (Nie & Emory, Citation1997). In SERS-based analytical method, how to synthesise the noble metal substrates with the highest enhancement efficiency is the key issue faced by all researches. The SERS enhancement effect of the substrates are mainly dependent on the “hot spots,” which are relative to the composition, structure, shape and morphology of noble metals. Many materials made from noble metals in the form of rods, flowers, prisms, hollow, cones, etc. with sufficient “hot spots” have been produced and used in SERS-based analytical method (Zhang et al., Citation2015; Zhu et al., Citation2011).
In the last years, a novel ultrasensitive and quantitative ICA using SERS as signal readout has been developed (Deng et al., Citation2019; Kim et al., Citation2021; Li et al., Citation2014; Rong et al., Citation2018; Wang et al., Citation2021). Also, the portable SERS-ICA readers have been designed and manufactured (Xiao et al., Citation2020). The emphasis of SERS-ICA research is mainly on the synthesis of noble metal substrates with high enhancement used as the substrates for the preparation of immunoprobes. In addition, according to EM enhancement theory, when the absorption wavelength of noble metal NPs is closer to the wavelength of incident laser, the LSPR on the substrate will be further enhanced (Li et al., Citation2017; Weiss & Haran, Citation2001). As in most SERS-ICA, diode laser source with the wavelength of 785 nm is usually utilised, thus long wavelength absorption of noble metal NPs will be more desired to be used in SERS-ICA.
In this work, Au nanocubes (AuNCs) with the long wavelength absorption were synthesised, characterised and used as the substrate in SERS-ICA. The immunoprobe (DTNB-AuNCs-Ab) was prepared by respectively immobilising monoclonal antibody (Ab) against FF and Raman reporter 5,5 ′-dithiobis-(2-nitrobenzoic acid) (DTNB) on the surface of AuNCs. After the ICA procedures, on one hand, qualitative identification of FF was made by observing the colour intensity on T lines of ICA strips. On the other hand, by measuring the Raman intensities of DTNB on T lines, ultrasensitive and quantitative detection of FF was achieved.
Materials and methods
Materials, chemicals and apparatus
Hexadecyl trimethyl ammonium bromide (CTAB, 99%) was purchased from Solarbio (Shanghai, China). L-Ascorbic acid (AA) and 5,5′-dithiobis-(2-nitrobenzoic acid) (DTNB) was purchased from Sigma-Aldrich (Shanghai, China). Silver nitrate (AgNO3, 99%), sodium borohydride (NaBH4, 96%), and ethanol absolute (C2H5OH) were obtained from the Sinopharm Chemical Reagent Co., Ltd (Shanghai, China). Chloroauric acid (HAuCl4), bovine serum albumin (BSA), ovalbumin (OVA) were purchased from Sigma (St. Louis, MO, USA). All other chemicals were analytical grade. The monoclonal Ab against FF and coating antigen (FF-OVA conjugate) were prepared by our group.
Nitrocellulose (NC) membranes were purchased from Whatman (Shanghai, China). PVC sheets, adhesive tape and filter paper were purchased from Jieyi Biotechnology Co. Ltd (Shanghai, China). The deionised-RO water supply system (Dura 12FV) was purchased from THE LAB Com. (Dover, DE, USA). The UV-2300 spectrophotometer was bought from Techcom (Shanghai, China). The digital photographs of the samples were taken with a telephone (Xiaomi, China). Transmission electron microscopy (TEM) photographs were taken on a Tecnai G20 from USA FEI Company. The portable Raman Analyser RamTracer-200-HS was obtained from Opto Trace Technologies, Inc. (Suzhou, China).
Synthesis of AuNCs
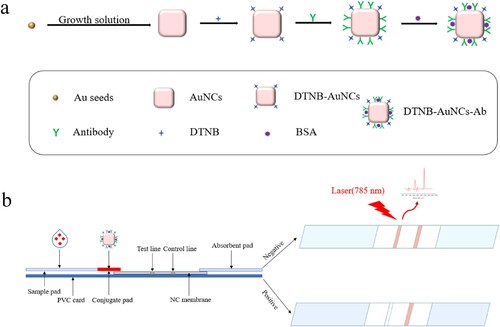
Seed-mediated method with small modification was used to synthesise AuNCs [(a)] (Li et al., Citation2013). Firstly, Au seeds were synthesised. To a 25 mL glass bottle, 250 μL of HAuCl4 (10 m mol L−1), 7.5 mL of CTAB (0.1 mol L−1) and 2.75 mL of ultrapure water were added. The solutions were mixed and the bottle was kept in a water bath at 35°C. Then 600 μL of the freshly prepared NaBH4 solution (0.01 mol L−1) was added to the bottle, and the mixture was slightly shaking for 1 min. After the colour of mixture was changed from bright yellow to the light brown, the bottle was continuously kept in a 35°C water bath for 2 h. The seed solution obtained should be diluted at 100 times before further use.
Figure 1. (a) Preparation of immunoprobe DTNB-AuNCs-Ab; (b) Assembly of ICA test strips and schematic diagram for competitive SERS-ICA detection of florfenicol.
To seven glass bottles containing 0.6 mL of AA (0.1 mol L−1), 1.6 mL of CTAB (0.1 mol L−1), 200 μL of HAuCl4 (0.01 mol L−1) and 7.6 mL of ultrapure water, different volume (4, 8, 12, 16, 20, 24, 28 μL) of diluted seed solution was added. The bottles were slightly shaking for 30 s, and kept in a 35 °C water bath overnight without stirring. On the next day, the mixtures in the bottles were centrifuged at 6000 g for 10 min. After removal of the supernatant, the residues were washed twice with ultrapure water, and finally dispersed in an appropriate volume of pure water. Seven kinds of AuNCs were obtained and stored at 4°C until use.
Preparation of immunoprobe
Th preparation processes of immunoprobe is illustrated in (a). In a glass bottle, 180 μL of above AuNCs solution was diluted to 6 mL with ultrapure water, then 12 μL of DTNB solution (1 mmol L−1) was added. The bottle was slightly shaking in the dark for 2 h. Then, 1.0∼6.0 µL of Ab against FF at the concentration of 1.12 mg mL−1 was added to 1 mL of DTNB-AuNCs solution. The mixture was slightly shaking for 30 s and then kept at 4°C overnight. Finally, 20 μL BSA (5%) was added to the mixture and incubated for 1.5 h to block the unspecific binding sites on the particles. The solution was centrifuged with a low-temperature centrifuge at 2850 g for 5 min. After removal of supernatant, the sediment was washed with pure water two times and redispersed in an appropriate volume of pure water. The prepared immunoprobe (DTNB-AuNCs-Ab) in pink-blue was stored at 4°C until use.
Assembly of ICA strip
As shown in (b), an ICA strip composes of five parts: a PVC base plate (6 cm long and 4 mm wide), a sample pad (the area on which the sample solution is dropped), a conjugate pad (the area where the immunoprobe is loaded), a NC membrane on which T line a NC membrane on which T line (5 μL of FF-OVA at concentration of 1.25 mg mL−1 was manually evenly distributed) and C line (5 μL of the second antibody, e.g. goat anti-mouse IgG diluted at 1:30, was manually evenly coated) were separately set, and a absorbent pad (100% pure cellulose fibre). The sample pad and the absorption pad are pasted on both ends of the NC membrane with an overlap of about 1–2 mm. After drying naturally at room temperature for 30 min, the ICA strip was sealed in a glass bottle containing desiccant gel and nitrogen and stored until use.
Procedures of competitive SERS-IAC
FF standard (or sample) solution (200 μL) was added to the sample pad. Due to capillary action, the solution will migrate towards the end of the absorption pad. FF solution is first mixed with the immunoprobe on the conjugate pad, then the mixture flows further through T and C lines and finally reaches the absorption pad. The whole process was completed in 15 min. When FF concentration is zero, the DTNB-AuNCs-Ab on conjugate pad will move to T line and specifically bind with coating antigen (FF-OVA) because of specific reaction between antibody and antigen. The immunoprobe will continuously flow to C line and be captured by the second antibody. In this case, two intensive pink-blue bands will be appeared on both T and C lines. In contrast, when FF concentration is high (such as 100 ng mL−1), the DTNB-AuNCs-Ab on conjugate pad will be firstly bound with high concentration of FF, leaving no free antibody binding sites for coating antigen on T line, leading to no colour on T line. But DTNB-AuNCs-Ab-FF complex can continue flow to C line and be captured by the second antibody, making the intensive pink-blue band be appeared on the C line. In other word, the colour intensity on T lines is inversely proportional to the concentration of FF. Therefore, the colour intensity on T line can be used for qualitative estimation of FF in solution. Furthermore, SERS intensities on T lines can be used for quantitative detection of FF. The SERS intensities of Raman reporter (DTNB, 1338 cm−1) in immunoprobe captured by FF-OVA were measured by portable Raman analyzer coupled with a microscope (Eplan, 40 × 0.6). The incident wavelength is 785 nm with the laser power of 50 mW. The integration time is 10 s with an average of 1 s. Average SERS intensity from 10 different spots along the T line was collected for quantification.
Detection of FF in spiked food samples
In order to verify the practicability of the proposed method, spiking experiment was carried out. Fresh swine meat, shrimp and swine liver were purchased from local market and spiked with FF. After homogenisation, to four 4 centrifuge tubes with stoppers, 1 g of sample was added, followed by 4 mL of methanol/water (1/1, V/V). After shaking violently for 20 min, the supernatant was discarded after centrifugation at 14,000 g for 10 min. Then 0, 6, 60 and 600 μL of FF standard solution (1 ng mL−1) were respectively added. The tubes were vortexed vigorously for 20 s, and kept at room temperature for 1 h. Then to each tube, 2 mL of HCl (0.1 mol L−1) solution was added. After shaking for 30 min, the tubes were kept at 4°C overnight. On next day, 800 μL of K2HPO4 (0.1 mol L−1) was added to the tubes, and the pH was adjusted to 7.0 with K2CO3 (0.1 mol L−1). The mixture was centrifuged at 14,000 g for 10 min. The supernatant was loaded onto a C18 SPE column. Washing the column with pure water, 600 μL of ethyl acetatecleaned was loaded to the column, and the eluates were collected and dried with nitrogen in a 65°C water bath. The residues were dissolved with 600 μL of phosphate-buffered saline (PBS, 0.01 mmol−1, pH 7.4), and the final concentrations of the spiked FF in these four tubes will be at 0, 0.01, 0.1 and 1 ng mL−1, respectively. 200 μL of the solution in the tubes was taken and applied to SERS-ICA procedures. For each sample, three separate extractions were performed. The recovery of FF from spiked samples was calculated as follow: recovery (%) = [(Conc. measured – blank)/Conc. spiked] × 100%.
Results and discussion
Synthesis and characterisation of AuNCs
Seed-growth method was utilised for the synthesis of AuNCs. The small-diameter Au nanospheres were firstly prepared and used as seeds. Then, using AA as reductant, HAuCl4 growth solution was reduced on the surface of the seeds, and gradually be formed to regular AuNCs by the shape-guiding effect of CTAB. In the preparation of AuNCs, seven glass bottles containing 0.6 mL of AA (0.1 mol L−1), 1.6 mL of CTAB (0.1 mol L−1), 200 μL of HAuCl4 (0.01 mol L−1) and 7.6 mL of ultrapure water, when different volume of seeds solution (4, 8 µL,12, 16, 20, 24 and 28 µL) was added, seven kinds of AuNCs with different size were obtained.
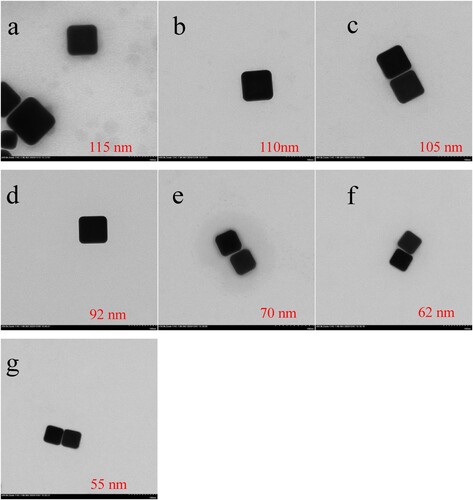
The TEM images of these AuNCs are illustrated in . It is seen from that in the experiment conditions, regular AuNCs are successfully obtained. In addition, with the volume of Au seeds solution increasing from 4 to 28 µL, the size of AuNCs decreases from 115 to 55 nm. In other word, more seeds utilised result in smaller size of AuNCs. This can be simply explained by the fact that when the same volume of HAuCl4 growth solution is used in the preparation, more seeds added will make lesser amount of Au deposited on the surface of seeds.
Figure 2. TEM images of seven kinds of AuNCs with different size: (a) 115 nm; (b) 110 nm; (c) 105 nm; (d) 92 nm; (e) 70 nm; (f) 62 nm, and (g) 55 nm, when HAuCl4 growth solution was reduced on the surface of Au seeds with the volume of 4, 8, 12, 16, 20, 24 and 28 μL, respectively.
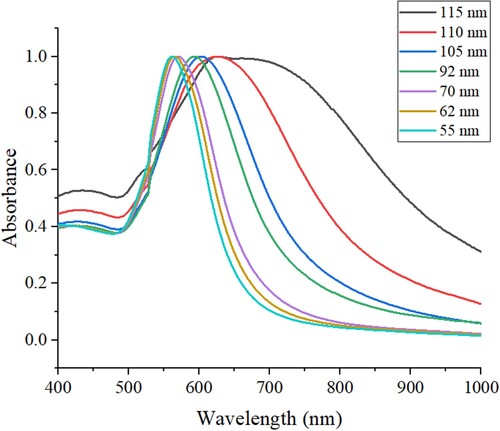
The UV-vis spectra of seven AuNCs are illustrated in . It can be seen from that for the largest AuNCs with the size of 115 nm, there is a wide absorption peak plateau with the wavelength of 620 ∼710 nm. For the second largest AuNCs with the size of 110 nm, the absorption spectrum with a peak at 627 nm is narrower than that of AuNCs with the size of 115 nm. With the size of AuNCs decreasing from 105, 92, 70, 62 nm to 55 nm, the absorption peaks are gradually blue-shift (from 604, 593, 571, 566 nm to 562 nm). All the absorption peaks of these AuNCs are much longer than that of Au colloidal nanoparticles (normally 520 nm). From , it can be also seen that with the size of AuNCs decreasing, more symmetrical spectra were obtained, indicating better monodispersity and uniformity of the AuNCs.
Figure 3. UV-vis spectra of seven AuNCs with different size.
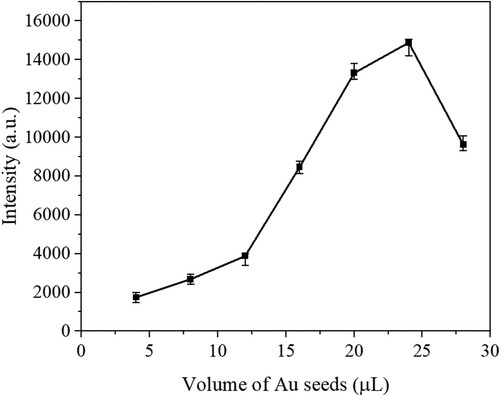
Raman reporter DTNB can be easily attached on AuNCs. Seven DTNB-AuNCs with different sizes were prepared and measured by Raman Analyzer. The Raman intensities of seven kinds of DTNB-AuNCs are shown in . It is seen from that in the AuNCs preparation, with the volume of Au seeds added increasing from 4 μL ∼ 28 μL, the size of AuNCs decreases from 115 ∼ 55 nm, the corresponding Raman intensities of DTNB-AuNCs are increased, and arrived the highest signals point when the volume of Au seeds is at 24 μL (with the size of 62 nm). Further increasing the volume of Au seeds results in signal decline. It seems that to get the highest SERS intensity, there is a compromise among some factors such as the absorption wavelength of AuNCs, the uniformity of the AuNCs, etc. Anyhow, the DTNB-AuNCs (the size of 62 nm) with the highest SERS enhancement was chosen and used in SERS-ICA.
Figure 4. The Raman intensity of the DTNB-AuNCs with different volume (4, 8, 12, 16, 20, 24 and 28 μL) of Au seeds for the AuNCs preparation.
Characterisation of immunoprobe
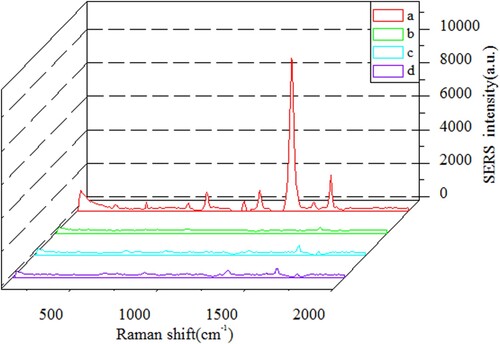
Before the detection of FF, the specific binding of immunoprobe with the coating antigen (FF-OVA) on the ICA strip should be tested. Four ICA procedures were performed at zero concentration of analyte under following four situations: (a) DTNB-AuNCs-Ab as probe, FF-OVA dispersed on the T line; (b) DTNB-AuNCs-BSA (Ab replaced by BSA) as probe, FF-OVA dispersed on the T line; (c) DTNB-AuNCs-Ab as probe, OVA coated on the T line; (d) DTNB-AuNCs-Ab as probe, Na2CO3-NaHCO3 buffer solution coated on the T line. The Raman spectra in the above four cases are illustrated in . From spectrum (a) in , it can be seen that the specific Raman scattering peak of the DTNB at 1338 cm−1 with the signal values of 8234 (a.u.) is appeared, which clearly demonstrates the immunoprobe can be specifically captured by FF-OVA at the T line. In contrast, from the Raman spectra (b–d) in , almost no SERS signals are appeared at 1338 cm−1. No SERS intensities from spectrum (b) is due to the lack of antibody on the probe, while no SERS intensities from spectrum (c) and (d) indicate that when T line is coated with OVA (or Na2CO3-NaHCO3 buffer) instead of coating antigen, the immunoprobe is not able to be appeared on T line.
Figure 5. Raman spectra of SERS-ICA on T lines at 0 ng mL−1 of analyte based on four different situations: (a) DTNB-AuNCs-Ab as probe, FF-OVA dispersed on the T line; (b) DTNB-AuNCs-BSA as probe, FF-OVA dispersed on the T line; (c) DTNB-AuNCs-Ab as probe, OVA coated on the T line; (d) DTNB-AuNCs-Ab as probe, Na2CO3-NaHCO3 buffer solution coated on the T line.
It should be addressed the stability of the immunoprobe. It was found during two-months storage, there was almost no decline of its immuno-activity and Raman signal, indicating high stability of the prepared immunoprobe.
Optimisation of experimental conditions
To improve the sensitivity of the SERS-ICA, some experimental parameters such as the amount of Ab used for the preparation of immunoprobe, the amount of the coating antigen loaded on the conjugate pad, the dosage of immunoprobe applied on the strip, etc. should be carefully optimised. Herein, the inhibition ratio (B0/B0.1) is defined and used to evaluate the optimisation, where B0 and B0.1 refer to the SERS intensities of DTNB at 1338 cm−1 when FF concentrations are at 0 ng mL−1 and 0.1 ng mL−1, respectively. The higher value of B0/B0.1, the higher sensitivity of the assay.
In the preparation of immunoprobe, 1.0∼6.0 µL of Ab against FF at the concentration of 1.12 mg mL−1 were consecutively coupled to 1.0 mL of DTNB-AuNCs solution. The effect of the amount of Ab on the inhibition ratio B0/B0.1 was examined [Figure S1(a)]. It can be seen that the highest value of the B0/B0.1 is achieved at 4.0 μL. Thus, the optimal amount of Ab for the preparation of immunoprobe was 1.0 μL at the concentration of 1.12 mg mL−1.
Other important effects on the assay sensitivity include the amount of the FF-OVA coated on the T line and the amount of immunoprobe loaded on the conjugate pad. When the volume of coating antigen was set at 5.0 μL, the effect of the concentration of FF-OVA in the range of 0.25–1.5 mg mL−1 on the assay was investigated [Figure S1(b)]. The highest value of the inhibition ratio B0/B0.1 is achieved at 1.25 mg mL−1. Similarly, when 1.0∼3.5 μL of immunoprobe is loaded on the conjugate pad, the highest value of the B0/B0.1 is achieved at 2.5 μL [Figure S1(c)].
Therefore, 1.0 μL of Ab (1.12 mg mL−1) mixed with 1.0 mL of AuNCs-DTNB for the preparation of immunoprobe, 5 μL of FF-OVA (1.25 mg mL−1) coated on the T line and 2.5 μL of immunoprobe loaded on the conjugate pad are the optimal conditions used in SERS-ICA.
Sensitivity of the SERS-ICA for FF
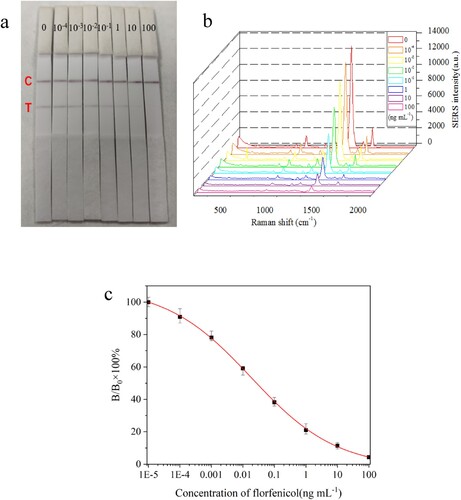
Under optimal assay conditions, FF standard solutions (0, 10−4, 10−3, 10−2, 10−1, 1.0, 10 and 100 ng mL−1) prepared by diluting FF stock solution (1 mg mL−1) with PBS were applied to SERS-ICA procedures. 200 μL of FF standards was added to sample pad which would move toward the end of absorption pad. About 15 min, the colours on T line and C line were gradually appeared and seen directly by the naked eye [ (a)]. It is found that high concentration of FF leads to low colour intensity at T line, which can be used for qualitative estimation of FF. In addition, the SERS spectra of DTNB from immunoprobe captured on the T lines were measured by SERS analyzer [(b)]. It can be seen that the SERS intensities at 1338 cm−1 generated from DTNB are gradually declined with the increasing of FF concentration. As shown in (c), the standard curve of the SERS-LFIA for FF is plotted in form of B/B0 × 100% versus log C, where B and B0 are the SERS intensity of DTNB at the standard point and zero concentration, respectively. In competitive immunoassay, the IC50 value (e.g. the concentration of analyte producing 50% signal inhibition in standard curve) can be used to represent the sensitivity of the assay. The lower the IC50 value, the higher sensitivity of the assay. From (c), the IC50 value of the SERS-ICA for FF was found to be 0.027 ng mL−1, and the LOD at three times of standard deviation (SD) is estimated to be 0.12 pg mL−1. IC50 and LOD values are very low, indicating high sensitivity of the SERS-ICA.
Figure 6. (a) Digital photograph of T lines on NC membranes after the assay procedure. The numbers above the T lines are the standard concentration of analyte (ng mL−1). (b) The Raman spectra arising from DTNB on T lines after assay procedures at optimal experimental conditions. (c) The calibration curve of the SERS-ICA for florfenicol, where B and B0 were the SERS intensities of DTNB at 1338 cm−1 when the florfenicol solutions were at the standard points and zero concentration.
Reproducibility of SERS intensities
The SERS signals from ten different spots in the centre sections of the T line at 1338 cm−1 were measured to calculate the reproducibility of SERS intensities. When FF standard solutions at concentrations of 0, 0.1 and 1.0 ng mL−1 were respectively applied SERS-ICA procedures, the measured SERS intensities at each standard were shown in Figure S2. Apparently, the higher the concentration of FF, the lower the SERS intensity. In each strip, the RSD values of the SERS intensities obtained from 10 different points are 4.2%, 5.3% and 9.2%, respectively, indicating high precision of the SERS signal.
Specificity of SERS-ICA for FF
In a competitive immunoassay, the specificity is often expressed by cross-reactivity (CR) value. Six drugs including thiamphenicol, chloramphenicol, ofloxacin, lomefloxacin, gatifloxacin and oxytetracycline () were selected to evaluate the specificity of SERS-ICA for FF. All compounds including FF were prepared in concentrations range of 10−4–103 ng mL−1 and were subjected to SERS-ICA procedures. The CR values were calculated by the equation of CR (%) = (IC50 of FF)/(IC50 of tested compound) × 100%. The obtained CR values were presented in . It is seen clearly that CR values of the assay with chloramphenicol, ofloxacin, lomefloxacin, gatifloxacin and oxytetracycline are lesser than 0.01%. But the assay displays 50.47% of CR with thiamphenicol due to very high similarity in molecular structure between FF and thiamphenicol. It may be useful for the assay to estimate the sum of FF and thiamphenicol if they are present in food samples simultaneously.
Table 1. The cross-reactivity (CR) values of the SERS-ICA with the tested compounds.
Detection of FF in spiked food samples
To demonstrate the feasibility of the SERS-ICA for FF, three samples (swine meat, shrimp and swine liver) purchased from local market were spiked with different amount of FF to form the spiked food samples. After the sample pretreatment, the extractions were applied to SERS-ICA procedures. The results of the spiking experiment are presented in . It is seen that the recoveries of the FF from spiked samples are 88.6% ∼ 102.4% with RSD in the range of 2.3% ∼ 7.4% (n = 3). These results demonstrates that the proposed SERS-ICA is able to detect FF in food samples with high accuracy and precision.
Table 2. The recoveries of the florfenicol from spiked samples measured by SERS-ICA.
Conclusions
In this study, a quantitative and ultrasensitive SERS-ICA for the detection of FF in food samples was developed. AuNCs with long wavelength absorption were synthesised, characterised and used as the substrate in the assay. The immunoprobe (DTNB-AuNCs-Ab) was prepared by directly immobilizing the Raman reporter and the Ab against FF on the surface of AuNCs. By adding FF standard (or sample) solution to sample pad, after 15 min, pink-blue bands appeared on T lines can be used for qualitative estimation of FF. More important, the specific SERS intensities of DTNB at 1338 cm−1 on the T lines can be utilised for quantitative detection. Under optimal conditions, the IC50 and LOD values of the SERS-ICA for FF were found to be 0.027 ng mL−1 and 0.12 pg mL−1, respectively. There was no CR of the assay with chloramphenicol and other four drugs. However, due to high similarity in molecular structure, the assay displayed 50.47% of CR with thiamphenicol, which may be useful for simultaneous estimation of the sum of FF and thiamphenicol. The recoveries of the FF in spiked samples were 88.5% ∼ 102.4% with RSD of 2.3% ∼ 7.4% (n = 3), demonstrating the feasibility of the SERS-ICA for FF in real food samples.
Supplemental Material
Download MS Word (148.3 KB)Disclosure statement
No potential conflict of interest was reported by the author(s).
Additional information
Funding
References
- Anadón, A., Martínez, M. A., Martínez, M., Ríos, A., Caballero, V., Ares, I., & Martínez-Larrañaga, M. R. (2008). Plasma and tissue depletion of florfenicol and Florfenicol-amine in chickens. Journal of Agricultural and Food Chemistry, 56(22), 11049–11056. https://doi.org/10.1021/jf802138y
- Bahadır, E. B., & Sezgintürk, M. (2016). Lateral flow assays: Principles, designs and labels. TrAC Trends in Analytical Chemistry, 82, 286–306. https://doi.org/10.1016/j.trac.2016.06.006
- Cannon, M., Harford, S., & Davies, J. (1990). A comparative study on the inhibitory actions of chloramphenicol, thiamphenicol and some fluorinated derivatives. Journal of Antimicrobial Chemotherapy, 26(3), 307–317. https://doi.org/10.1093/jac/26.3.307
- Deng, D., Yang, H., Liu, C., Zhao, K., Li, J., & Deng, A. (2019). Ultrasensitive detection of Sudan I in food samples by a quantitative immunochromatographic assay. Food Chemistry, 277, 595–603. https://doi.org/10.1016/j.foodchem.2018.10.129
- Fodey, T. L., George, S. E., Traynor, I. M., Delahaut, P., Kennedy, D. G., Elliott, C. T., & Crooks, S. R. H. (2013). Approaches for the simultaneous detection of thiamphenicol, florfenicol and florfenicol amine using immunochemical techniques. Journal of Immunological Methods, 393(1), 30–37. https://doi.org/10.1016/j.jim.2013.04.003
- Juntunen, E., Myyryläinen, T., Salminen, T., Soukka, T., & Pettersson, K. (2012). Performance of fluorescent europium(III) nanoparticles and colloidal gold reporters in lateral flow bioaffinity assay. Analytical Biochemistry, 428(1), 31–38. https://doi.org/10.1016/j.ab.2012.06.005
- Kim, K., Han, D. K., Choi, N., Kim, S. H., Joung, Y., Kim, K., Ho, N. T., Joo, S. W., & Choo, J. (2021). Surface-Enhanced Raman scattering-based dual-flow lateral flow assay sensor for the ultrasensitive detection of the thyroid-stimulating hormone. Analytical Chemistry, 93(17), 6673–6681. https://doi.org/10.1021/acs.analchem.0c05336
- Li, J. F., Tian, X. D., Li, S. B., Anema, J. R., Yang, Z. L., Ding, Y., Wu, Y. F., Zeng, Y. M., Chen, Q. Z., Ren, B., Wang, Z. L., & Tian, Z. Q. (2013). Surface analysis using shell-isolated nanoparticle-enhanced Raman spectroscopy. Nature Protocols, 8(1), 52–65. https://doi.org/10.1038/nprot.2012.141
- Li, M., Yang, H., Zhao, K., Li, J., Jiang, D., Sun, L., & Deng, A. (2014). Ultrasensitive and quantitative detection of a new β-agonist phenylethanolamine A by a novel immunochromatographic assay based on surface-enhanced Raman scattering (SERS). Journal of Agricultural and Food Chemistry, 62(45), 10896–10902. https://doi.org/10.1021/jf503599x
- Li, Q., Wang, J., Ding, Q., Chen, M., & Ma, F. (2017). Coupling effect on charge-transfer mechanism of surface-enhanced resonance Raman scattering. Journal of Raman Spectroscopy, 48(4), 560–569. https://doi.org/10.1002/jrs.5077
- Li, R., Lin, Z.-J., Yang, J.-Y., Xu, Z. L., Wang, H., Lei, H.-T., Sun, Y.-M., & Shen, Y.-D. (2018). An indirect competitive enzyme-linked immunosorbent assay for simultaneous determination of florfenicol and thiamphenicol in animal meat and urine. Chinese Journal of Analytical Chemistry, 46(8), 1321–1328. https://doi.org/10.1016/S1872-2040(18)61104-1
- Mak, W. C., Beni, V., & Turner, A. P. F. (2016). Lateral-flow technology: From visual to instrumental. TrAC Trends in Analytical Chemistry, 79, 297–305. https://doi.org/10.1016/j.trac.2015.10.017
- Nie, S., & Emory, S. R. (1997). Probing single molecules and single nanoparticles by surface-enhanced Raman scattering. Science, 275(5303), 1102–1106. https://doi.org/10.1126/science.275.5303.1102
- Rairat, T., Hsieh, C. Y., Thongpiam, W., Chuchird, N., & Chou, C.-C. (2020). Temperature-dependent non-linear pharmacokinetics of florfenicol in Nile tilapia (Oreochromis niloticus) and its implementation in optimal dosing regimen determination. Aquaculture, 517, 734794. https://doi.org/10.1016/j.aquaculture.2019.734794
- Rong, Z., Xiao, R., Xing, S., Xiong, G., Yu, Z., Wang, L., Jia, X., Wang, K., Cong, Y., & Wang, S. (2018). SERS-based lateral flow assay for quantitative detection of C-reactive protein as an early bioindicator of a radiation-induced inflammatory response in nonhuman primates. The Analyst, 143(9), 2115–2121. https://doi.org/10.1039/C8AN00160J
- Sadeghi, S., & Olieaei, S. (2019). Capped cadmium sulfide quantum dots with a new ionic liquid as a fluorescent probe for sensitive detection of florfenicol in meat samples. Spectrochimica Acta Part A: Molecular and Biomolecular Spectroscopy, 223, 117349. https://doi.org/10.1016/j.saa.2019.117349
- Saito-Shida, S., Shiono, K., Narushima, J., Nemoto, S., & Akiyama, H. (2019). Determination of total florfenicol residues as florfenicol amine in bovine tissues and eel by liquid chromatography–tandem mass spectrometry using external calibration. Journal of Chromatography B, 1109(2019), 37–44. https://doi.org/10.1016/j.jchromb.2019.01.018
- Schlucker, S. (2014). Surface-enhanced Raman spectroscopy: Concepts and chemical applications. Angewandte Chemie International Edition, 53(19), 4756–4795. https://doi.org/10.1002/anie.201205748
- Sharma, B., Frontiera, R. R., Henry, A. I., Ringe, E., & Van Duyne, R. P. (2012). SERS: Materials, applications, and the future. Materials Today, 15(1-2), 16–25. https://doi.org/10.1016/S1369-7021(12)70017-2
- Sichilongo, K., & Kolanyane, P. (2020). Chloride adduct tandem mass spectrometry for the quantification of thiamphenicol and florfenicol in bovine muscle. Journal of Food Composition and Analysis, 87(2020), 103428. https://doi.org/10.1016/j.jfca.2020.103428
- Tao, Y., Zhu, F., Chen, D., Wei, H., Pan, Y., Wang, X., Liu, Z., Huang, L., Wang, Y., & Yuan, Z. (2014). Evaluation of matrix solid-phase dispersion (MSPD) extraction for multi-fenicols determination in shrimp and fish by liquid chromatography–electrospray ionisation tandem mass spectrometry. Food Chemistry, 150(2014), 500–506. https://doi.org/10.1016/j.foodchem.2013.11.013
- Taranova, N. A., Berlina, A. N., Zherdev, A. V., & Dzantiev, B. B. (2015). ‘Traffic light’ immunochromatographic test based on multicolor quantum dots for the simultaneous detection of several antibiotics in milk. Biosensors and Bioelectronics, 63(2015), 255–261. https://doi.org/10.1016/j.bios.2014.07.049
- Tian, L., Bayen, S., & Yaylayan, V. (2017). Thermal degradation of five veterinary and human pharmaceuticals using pyrolysis-GC/MS. Journal of Analytical and Applied Pyrolysis, 127(2017), 120–125. https://doi.org/10.1016/j.jaap.2017.08.016
- Wang, B., Pang, M., Zhao, X., Xie, K., Zhang, P., Zhang, G., Zhang, T., Liu, X., & Dai, G. (2019). Development and comparison of liquid-liquid extraction and accelerated solvent extraction methods for quantitative analysis of chloramphenicol, thiamphenicol, florfenicol, and florfenicol amine in poultry eggs. Journal of Mass Spectrometry, 54(6), 488–494. https://doi.org/10.1002/jms.4355
- Wang, L., Wang, X., Cheng, L., Ding, S., Wang, G., Choo, J., & Chen, L. (2021). SERS-based test strips: Principles, designs and applications. Biosensors and Bioelectronics, 189(2021), 113360. https://doi.org/10.1016/j.bios.2021.113360
- Weiss, A., & Haran, G. (2001). Time-dependent single-molecule Raman scattering as a probe of surface dynamics. The Journal of Physical Chemistry B, 105(49), 12348–12354. https://doi.org/10.1021/jp0126863
- Wu, P., Cai, C., Yang, D., Zhang, Y., Hu, Z., & Wang, T. (2015). Determination of three kinds of banned drugs in milk powder by hybrid solid-phase extraction purification combined with gas chromatography and mass spectrometry. Journal of Separation Science, 38(18), 3288–3294. https://doi.org/10.1002/jssc.201500431
- Xiao, R., Lu, L., Rong, Z., Wang, C., Peng, Y., Wang, F., Wang, J., Sun, M., Dong, J., Wang, D., Wang, L., Sun, N., & Wang, S. (2020). Portable and multiplexed lateral flow immunoassay reader based on SERS for highly sensitive point-of-care testing. Biosensors and Bioelectronics, 168(2020), 112524. https://doi.org/10.1016/j.bios.2020.112524
- Xie, X., Wang, B., Pang, M., Zhao, X., Xie, K., Zhang, Y., Wang, Y. J., Guo, Y. W., Liu, C. J., Bu, X. N., Wang, R., Shi, H., Zhang, G., Zhang, T., Dai, G., Wang, J. (2018) Quantitative analysis of chloramphenicol, thiamphenicol, florfenicol and florfenicol amine in eggs via liquid chromatography-electrospray ionization tandem mass spectrometry. Food Chemistry, 269(2018), 542–548 https://doi.org/10.1016/j.foodchem.2018.07.045
- Xu, M., Qian, M., Zhang, H., Ma, J., Wang, J., & Wu, H. (2015). Simultaneous determination of florfenicol with its metabolite based on modified quick, easy, cheap, effective, rugged, and safe sample pretreatment and evaluation of their degradation behavior in agricultural soils. Journal of Separation Science, 38(2), 211–217. https://doi.org/10.1002/jssc.201400919
- Zeng, Q., Liao, C., Terhune, J., & Wang, L. (2019). Impacts of florfenicol on the microbiota landscape and resistome as revealed by metagenomic analysis. Microbiome, 7(1), 155. https://doi.org/10.1186/s40168-019-0773-8
- Zhang, G. N., Li, J. R., Shen, A. G., & Hu, J. M. (2015). Synthesis of sizetunable chitosan encapsulated gold-silver nanoflowers and their application in SERS imaging of living cells. Physical Chemistry Chemical Physics, 17(33), 21261–21267. https://doi.org/10.1039/C4CP05343E
- Zhu, Z. N., Meng, H. F., Liu, W. J., Liu, X. F., Gong, J. X., Qiu, X. H., Jiang, L., Wang, D., & Tang, Z. Y. (2011). Superstructures and SERS properties of gold nanocrystals with different shapes. Angewandte Chemie International Edition, 50(7), 1593–1596. https://doi.org/10.1002/anie.201005493