
 ?Mathematical formulae have been encoded as MathML and are displayed in this HTML version using MathJax in order to improve their display. Uncheck the box to turn MathJax off. This feature requires Javascript. Click on a formula to zoom.
ABSTRACT
The material basis and toxicity of Lithocarpus litseifolius (Hance) Chun (sweet tea), which has many health benefits, are not fully understood. In this study, total water-soluble flavonoids were extracted from sweet tea using optimised methods based on RSM. Its composition and toxicity were investigated by LC–MS and mouse models in vivo. The results showed that the optimum extraction conditions were a liquid/solid ratio of 32.98:1 ml/g, a temperature of 60.69°C, a microwave power of 633.70 W, and a microwave time of 164.08 secs. Among the 33 main components in the extract, five flavonoids constituted more than 73.80% of the total compound content. Total flavonoids were safe after oral administration and alleviated reproductive disorders but were highly toxic after intraperitoneal injection in mice. In summary, under the optimum extraction conditions, the total water-soluble flavonoids were safe after oral administration, but the complex compounds hindered their direct injection.
Abbreviations: LLHC: Lithocarpus litseifolius (Hance) Chun; SFD: single-factor design; RSM: response surface methodology; CCD: central composite design; ES: extracted solution; CS concentrated solution; LP: lyophilised powder; LC–MS: liquid chromatography–mass spectrometry; NC: negative control; PH: procaine hydrochloride; CP: cyclophosphamide group.
1. Introduction
Lithocarpus litseifolius (Hance) Chun is an important natural resource that is mainly grown in the mountainous area of South China (Shang et al., Citation2022; Zhou et al., Citation2013). Its leaves are used as a dietary and medicinal material for sweet tea and have also been identified as a new food resource in China since 2017 (Guo et al., Citation2021). According to records in the “Compendium of Materia Medica” and the “National Compilation of Chinese Herbal Medicine,” sweet tea made from L. litseifolius (Hance) Chun leaves has been used to intervene multiple chronic diseases, such as diabetes, hypertension, and hyperlipidaemia, in practice. Modern medical studies have also shown that consuming sweet tea has many health benefits, as sweet tea has antihyperglycemic, anti-inflammatory, antioxidant, and anticancer effects (He et al., Citation2022; Ozarowski et al., Citation2018; Shang et al., Citation2022; Zhou et al., Citation2013). However, some aspects of sweet tea need to be further investigated, including its safety, material basis and functional mechanism.
Recently, bioactive compounds from traditional Chinese natural herbs, such as flavonoids, polysaccharides, and triterpenes, have attracted increasing attention worldwide because of their important roles in human health and limited side effects (Shang et al., Citation2022; Wang et al., Citation2016). There are many flavonoids in L. litseifolius (Hance) Chun leaves, and it is believed that these flavonoids are the primary bioactive compounds due to their multiple functions in protecting against chronic diseases (Shang et al., Citation2022; Tian et al., Citation2022). However, samples of L. litseifolius (Hance) Chun leaves from different areas exhibit diverse secondary metabolites and pharmacological and toxicological activities (Wang et al., Citation2021). Moreover, L. litseifolius (Hance) Chun leaves from the Xuefeng Mountainous region have been promoted for folk usage and food and pharmaceutical industrialisation. However, the effects of L. litseifolius (Hance) Chun leaves remain unclear because of the lack of investigations of flavonoid composition and toxicology.
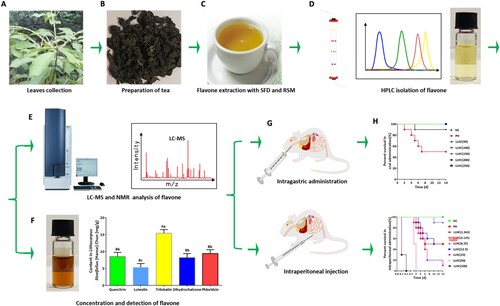
In this study, we investigated the composition and toxicity of the total water-soluble flavonoids from L. litseifolius (Hance) Chun (sweet tea). As shown in the schematic figure, the leaves of L. litseifolius (Hance) Chun (LLHC) (A) were collected and processed into sweet tea (B). Total water-soluble flavonoids were separated and extracted from sweet tea via a method optimised by single-factor design (SFD) and response surface methodology (RSM) (C). The main components in the extract were investigated through HPLC analysis (D), and the concentrations of these compounds were determined by liquid chromatography–mass spectrometry (LC–MS) and nuclear magnetic resonance (NMR) analyses (E). After concentration and detection of the total flavonoids (F), their toxicity and intervention effects were assessed using mouse models after intragastric administration and intraperitoneal injection (G). This study provides a scientific and theoretical foundation for the safe application of sweet tea in the food and pharmaceutical industry (H).
Figure 1. Schematic illustration of this study. A. Leaves were collected from Lithocarpus litseifolius (Hance) Chun (LLHC). B. Sweet tea was prepared from LLHC leaves. C. Total water-soluble flavonoids were separated from sweet tea via an optimum method determined by SFD and RSM. D. The main components in the extract were analysed by HPLC. E. The compound composition of the five flavonoids was analysed by LC–MS and NMR. F. Total water-soluble flavonoids were concentrated and detected. G. The toxicity and intervention effects were assessed using intragastrical and intraperitoneal administration in a mouse model. H. The results of the toxicological investigation.
2. Materials and methods
2.1. Extraction of the water-soluble total flavonoids
The sweet tea of L. litseifolius (Hance) Chun, a mature commodity, was produced by Hunan Aokang Biotech. Co. Ltd. (China) and provided a gift for this study. The flavonoids were extracted from sweet tea according to the following method, and the optimum extraction conditions were investigated by SFD and CCD of RSM using Design Expert® 12 software (Stat-Ease, Inc., Minneapolis, MN, USA) (Wu et al., Citation2022; Yang et al., Citation2010). The main variables used in this study were the liquid/solid (v/m) ratio (A), temperature (B), microwave power (C) and microwave extraction time (D). The dry tea was pulverised using a universal multifunctional disintegrator, and a fine powder was obtained after passing through a 100-mesh sieve.
In the SFD experiments, the basic conditions were 20.00 g of leaf powder with a liquid/solid (v/m) ratio of 20:1 ml/g, a temperature of 70°C, a microwave power of 400 W, and a microwave time of 120 s. When one condition was investigated, the other conditions remained constant. The optimum conditions were used in the following experiments.
In the RSM experiment, the conditions were set according to the SFD results. The powder was mixed with cold deionised water at liquid/solid (v/m) ratios of 20:1, 25:1, 30:1, 35:1 or 40:1 ml/g. The different mixture systems were rapidly heated to 50, 55, 60, 65°C, or 70°C, and the temperature was maintained. Extraction was performed under ultrasonic assistance at different microwave powers of 400, 500, 600, 700, and 800 W, total running time for 120, 150, 180, 210 sec, or 240 s (running for 5 sec with an interval for 5 sec).
After the extraction process, the extracted solution was filtered through a 0.45 µm filter membrane with a vacuum pump. The filtered solution was concentrated with a rotary evaporator at 40°C. The concentrated solution was dried via vacuum lyophilisation to obtain the flavonoid powder that was used in the following experiments.
2.2. Detection of the water-soluble total flavonoid content
The water-soluble total flavonoid content in each step of the sample was detected via a spectrophotometric method using the classical NaNO2-Al(NO3)3-NaOH system (Wu et al., Citation2022; Yang et al., Citation2010). To construct the standard curve and to obtain the regression equation, different volumes (0.00, 0.25, 0.50, 1.00, 2.00, and 4.00 ml) of a Rutin standard solution (0.50 mg/ml) were added to separate test tubes, followed by the addition of deionised water to a final volume of 4.00 ml. These test tubes were successively supplemented with 1.00 ml of sodium nitrite (50 mg/ml), 1.00 ml of aluminum nitrate (100 mg/ml), and 4.00 ml of sodium hydroxide (40 mg/ml). In each step, these test tubes remained quiescent for 6 min after mixing by shaking at room temperature. Subsequently, the absorbance of the solution in the test tubes was determined at a wavelength of 510 nm (OD510 nm) via an ultraviolet spectrophotometer, with the solution in the first test tube used as a blank control.
Similarly, 1 ml of each of the prepared samples, including the initial extracted solution (ES), concentrated solution (CS) diluted 50-fold, and a solution of the lyophilised powder (LP) with a concentration of 1.00 mg/ml, was added to separate test tubes to measure the flavonoid content. The measured OD510 nm was compared to the Rutin standard curve, and the total flavonoid content was calculated according to the regression equation.
2.3. Determination of the total flavonoid composition
The total flavonoid composition was identified and quantified via LC–MS methods (He et al., Citation2013; Leoni et al., Citation2021). First, 20 µl of sample was injected into a C18 column (250 mm × 5 μm) and eluted with mobile phases composed of 60% methanol (A) and 40% deionised water (B) at a constant temperature of 25°C. An Agilent 1100 Series LC/MSD SL (1100-G1946D) quadrupole mass spectrometer equipped with an ESI source and running Agilent Chem-Station software was used for LC–ESI-MS analysis. The ESI–MS conditions were as follows: positive ion mode; drying gas (N2), 10 ml/min; nebuliser (N2), 35 psi (241 kPa); drying gas temperature, 320°C; capillary voltage, 4000 V; fragmentation voltage, 100 V; and mass range (m/z), 100–1500.
NMR spectra were obtained using a Bruker Ultra shield-500 NMR spectrophotometer (1H-NMR 500 MHz, 13C-NMR 100 MHz) with MeOD as the solvent reference, and the spectroscopic data were compared with the Ichemistry database (http://www.ichemistry.cn/) and existing literature (Adeniyi et al., Citation2022; Primikyri et al., Citation2015; Wei et al., Citation2021).
2.4. Investigation of acute toxicity in model mice in vivo
The acute toxicity of the extracted flavonoids after oral administration and intraperitoneal injection was determined according to the guidelines from a toxicology textbook and the literature (Aigbe et al., Citation2019; Jahani Yazdi et al., Citation2020), which complied with traditional Chinese medicine. The animal experiments were approved by the Animal Ethical and Welfare Committee of Huaihua University (Huaihua: 2022 (A03028)). All mice, ∼10 weeks old and weighing ∼25 g, were purchased from the Center of Experimental Animals at Hunan University of Medicine and housed in a clean room with free access to food and water on a 12 h light/12 h dark cycle.
For acute toxicity determination after oral administration, 70 KM mice were randomly assigned to 3 groups via a numbered lottery method as follows.
Negative control (NC) group: This group was intragastrically administered normal saline.
Procaine hydrochloride (PH) group: This group was intragastrically administered procaine hydrochloride (Cat. No. P0270, Solarbio Life Sciences, Beijing, China) at 80 mg/(kg·d) according to the manufacturer’s instructions.
Experimental groups: This group was intragastrically administered total flavonoids of L. litseifolius (Hance) Chun (LLHC). There were 5 subgroups in this experimental group, shown as follows.
(3-1) LLHC(50) subgroup: This subgroup was administered LLHC at a dosage of 50 mg/(kg·d).
(3-2) LLHC (100) subgroup: This subgroup was administered LLHC at a dosage of 100 mg/(kg·d).
(3-3) LLHC (150) subgroup: This subgroup was administered LLHC at a dosage of 150 mg/(kg·d).
(3-4) LLHC (200) subgroup: This subgroup was administered LLHC at a dosage of 200 mg/(kg·d).
(3-5) LLHC (250) subgroup: This subgroup was administered LLHC at a dosage of 250 mg/(kg·d).
For acute toxicity determination after intraperitoneal injection, a total of 90 KM mice were randomly assigned to 3 groups via the same method as follows.
Negative control (NC) group: This group was treated with normal saline.
Procaine hydrochloride (PH) group: This group was administered procaine hydrochloride at a dosage of 60 mg/(kg·d).
Experimental groups: These groups were intraperitoneally administered LLHC. There were 7 subgroups in these experimental groups, shown as follows.
(3-1) LLHC (1.563) subgroup: This subgroup was administered LLHC at a dosage of 1.563 mg/(kg·d).
(3-2) LLHC (3.215) subgroup: This subgroup was administered LLHC at a dosage of 3.215 mg/(kg·d).
(3-3) LLHC (6.25) subgroup: This subgroup was administered LLHC at a dosage of 6.25 mg/(kg·d).
(3-4) LLHC (12.5) subgroup: This subgroup was administered LLHC at a dosage of 12.5 mg/(kg·d).
(3-5) LLHC(25) subgroup: This subgroup was administered LLHC at a dosage of 25 mg/(kg·d).
(3-6) LLHC(50) subgroup: This subgroup was administered LLHC at a dosage of 50 mg/(kg·d).
(3-7) LLHC (100) subgroup: This subgroup was administered LLHC at a dosage of 100 mg/(kg·d).
There were 10 mice in each group or experimental subgroup (5 females and 5 males). Both acute toxicity studies after oral administration and intraperitoneal injection were performed for 14 days.
All mice were observed and recorded for toxicity symptoms from 1 h of preadministration until 6 h postadministration. The disappearance of hypothermia and the needle stimulation reflex was used as the humane endpoint. Body weight and blood indices were monitored on days 0, 4, 8, and 12. At the end of the acute toxicity experiment, all of the experimental mice were immediately euthanised after anaesthesia with 2% isoflurane.
2.5. Assessing reproductive toxicity in male mice
Similarly, reproductive toxicity in male mice was assessed according to published guidelines (Li et al., Citation2016; Poojary et al., Citation2021). A total of 30 male KM mice were randomly divided into 5 groups as follows.
Negative control (NC) group: This group was intragastrically administered normal saline.
LLHC(100) group: This group was intragastrically administered a single dose of 100 mg/kg/d LLHC.
Cyclophosphamide (CP) group: This group consisted of male reproductive disorder model (MD) mice that were administered a single dose of 150 mg/kg cyclophosphamide (Cat. No. C3220, Solarbio Life Sciences, Beijing, China).
LLHC(50) group: This group consisted of MD mice that were treated with LLHC at 50 mg/(kg·d).
LLHC(100) group: This group consisted of MD mice that were treated with LLHC at 100 mg/(kg·d).
2.6. Statistical analysis
Statistical analyses were performed by one-way ANOVA with a post hoc multiple comparison (Bonferroni) test after normal distribution tests using the Statistical Package for Social Science (SPSS, Version 19.0; SPSS Inc., Chicago, IL, USA). The final data are shown as the mean ± standard deviation (SD), with differences considered significant at p < 0.05 or P < 0.01.
3. Results
3.1. The following suitable extraction conditions were used: a liquid/solid (v/m) ratio of 30:1 ml/g, a temperature of 60°C, a microwave voltage of 600 W, and a microwave time of 180 sec
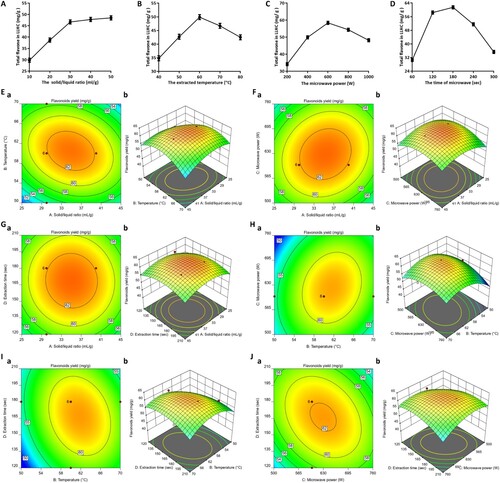
The results of the SFD experiments showed that the total extracted flavonoids increased with increasing solid/liquid (v/m) ratio. A rapid increase was observed when the solid/liquid (v/m) ratio was below 30:1 ml/g, and a slow increase was observed after this ratio was greater than 30:1 ml/g. From these data, the maximum value of total extracted flavonoids was approximately 48.5 mg/g (A). Similarly, when the temperature increased from 40 to 60°C, the total extracted flavonoid content rapidly increased. However, continuing the temperature increase from 60 to 80°C caused a rapid decrease in the total extracted flavonoid content. According to the temperature analysis, the maximum concentration of the total extracted flavonoid was approximately 49.9 mg/g (B). When the MW power was increased from 200 to 600 W, the total extracted flavonoid content rapidly increased. However, a continuous increase in the microwave power from 600 to 1000 W led to a rapid decrease in the total extracted flavonoid content. According to the microwave power analysis, the maximum concentration of the total extracted flavonoids was approximately 58.43 mg/g (C). When the microwave time was extended from 60 to 180 sec, the total extracted flavonoid content rapidly increased. However, further extension of the microwave time from 180 to 300 sec caused a rapid decrease in the total extracted flavonoid content. According to the microwave time analysis, the maximum concentration of the total extracted flavonoid was approximately 61.50 mg/g (D).
Figure 2. The extraction conditions of the total flavonoids from LLHC were optimised in the RSM experiment. A. SFD of the solid/liquid ratio. B. SFD of the temperature. C. SFD of the microwave power. D. SFD of the microwave time. Ea-Eb. 3D response surfaces and 2D contour plots of the correlation between the liquid/solid ratio (A) and the temperature (B). Fa-Fb. 3D response surfaces and 2D contour plots of the correlation between the liquid/solid ratio (A) and the microwave power (C). Ga-Gb. 3D response surfaces and 2D contour plots of the correlation between the liquid/solid ratio (A) and the microwave time (D). Ha-Hb. 3D response surfaces and 2D contour plots of the correlation between temperature (B) and microwave power (C). Ia-Ib. 3D response surfaces and 2D contour plots of the correlation between temperature (B) and microwave time (D). Ja-Jb. 3D response surfaces and 2D contour plots of the interaction relation between the microwave power (C) and the microwave time (D). RSM: response surface methodology; SFD: single-factor design; 3D: three-dimensional; 2D: two-dimensional.
3.2. The optimum extraction conditions were confirmed to be a liquid/solid (v/m) ratio of 32.98:1 ml/g, a temperature of 60.69°C, a microwave power of 633.70 W, and a microwave time of 164.08 sec
Furthermore, an analysis of the four factors and five levels of each factor was performed via RSM experiments. There were 6 core experimental points among the 30 experimental points, and the randomised experimental design and results are listed in Supplementary Table 1. The second-order polynomial stepwise equation (1) was obtained through multiple regression analysis of the data in Supplementary Table 1.
(1)
(1) A statistical summary of the significance and suitability of the models is displayed in Supplementary Table 2, in which the model F value of 19.95 (P < 0.0001) indicated high significance. There was only a 0.01% chance of a large F value occurring due to noise. The correlation coefficient (R2 = 0.9490 > 0.75) was reasonable for the proportion of variability in the explained data or accounted for by the model, indicating that this model could be accepted (C.V.% = 2.29). In this model, A, B, C, D, BC, CD, A2, B2, C2, and D2 were significant model terms (P < 0.05) that significantly influenced the extraction yield of the total flavonoids. However, AB, AC, and AD were not significant model terms (P > 0.10) and did not have significant influences on the extraction yield of the total flavonoids, and BD was a marginal model term (0.05 < P < 0.10). After correction, a second-order polynomial stepwise equation (2) was obtained as follows.
(2)
(2) According to the linear equation and coefficients, all four experimental factors had a significant effect on the flavonoid yield and the influence of the factors on the response of the total flavonoid extraction yield. According to the three-dimensional (3D) response surfaces and two-dimensional (2D) contour plots, the interaction terms AB, AC, AD, BC, BD, and CD showed convex sphere surfaces with openings facing downwards, indicating that there was a top point (central point) in the range of the experiment. The influence of the experimental factors on the response value was inferred from the steepness of the response surface, where a steeper surface correlated to a greater influence. When two of the variables were held constant, the temperature and the liquid/solid ratio had quadratic effects on the flavonoid yield (AB, AC, AD, BC, BD, and CD), in which the liquid/solid ratio (A) had a greater effect on the flavonoid yield than the temperature (B) (E1 and E2), the microwave power (C) (F1 and F2) and the microwave time (D) (G1 and G2). Moreover, temperature (B) had a smaller effect on the flavonoid yield than did microwave power (C) (H1 and 2H2) and microwave time (D) (I1 and I2). Similarly, the microwave power (C) had a smaller effect on the flavonoid yield than did the microwave time (D) (J1 and J2). In general, the four experimental factors affecting the yield ratio of total extracted flavonoids from LLHC were in the following order: liquid/solid ratio > microwave time > microwave power > temperature.
According to this model, the optimum extraction conditions were confirmed to be a liquid/solid (v/m) ratio of 32.98:1 ml/g, a temperature of 60.69°C, a microwave power of 633.70 W, and a microwave time of 164.08 sec, and the theoretical amount of total extracted flavonoids was 63.23 mg/g. To verify the reliability of the optimum conditions determined by RSM, the extraction of total flavonoids from LLHC was performed three times. Here, the practical yield was 63.62 ± 0.15 mg/g, which was consistent with the theoretical value, indicating that the model and equation effectively fit the experimental data.
3.3. The lyophilised total flavonoid powder contained approximately 33 flavonoid substances
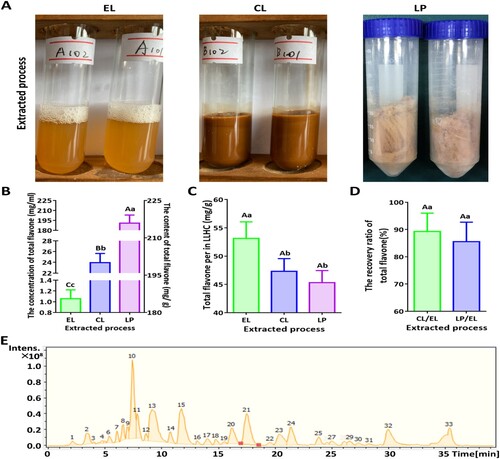
The extracted solution was faint yellow and had a total flavonoid concentration of 1.057 ± 0.1644 mg/ml after water extraction with microwave assistance. The total flavonoid concentration reached 23.94 ± 1.705 mg/ml after rotary evaporation, and the solution became the colour of the clay bank. After lyophilisation, a clay bank powder with a total flavonoid content of 191.00 ± 12.16 mg/g was obtained (A and B). Over 53.14 ± 2.928 mg of total flavonoids was obtained from 1 g of LLHC, 47.33 ± 2.240 mg of total flavonoids were obtained after rotary evaporation, with a recovery rate of 89.30 ± 6.712%, and 45.32 ± 2.141 mg of total flavonoids were obtained after rotary evaporation, with a recovery rate of 85.56 ± 7.137% (C and 3D). In the HPLC chromatogram of the extracted solution, there were approximately 33 clear peaks, indicating that there were 33 flavonoid substances (E).
Figure 3. A water-soluble extract containing approximately 33 flavonoid substances was obtained under the optimum conditions. A. The extract throughout the process, including EL, CL, and LP. B. Changes in the total flavonoid content. C. Changes in the total flavonoid extraction efficiency. D. Total flavonoid recovery ratio. E. HPLC detection of the extract. Different capital letters indicate highly significant differences (P < 0.01). Different lowercase letters indicate significant differences (p < 0.05). EL: extract liquid; CL: concentration liquid; LP: lyophilised powder.
3.4. The relatively abundant flavonoids were quercitrin, luteolin, trilobatin, dihydrochalcone, and phloridzin
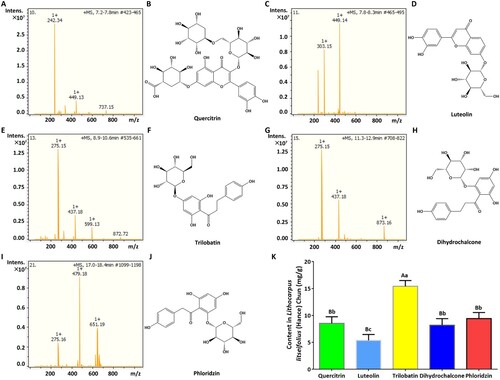
Through LC–MS and NMR investigations and analyses, five components were identified as constituting more than 73.80% of the total flavonoid content in the extract. The first compound was quercitrin, with a chemical formula of C34H40O21, a molecular weight of 784.6730, and a total energy of 54.4709 kcal/mol, which is a yellowish white powder that has a maximum UV absorption peak at approximately UV 260 nm (A and B). The second compound was luteolin, which has a chemical formula of C21H20O10, a molecular weight of 432.3810, and a total energy of 25.4063 kcal/mol; this compound is a dark yellow powder that has a maximum UV absorption peak at approximately 350 nm (C and D). The third compound was trilobatin, with a chemical formula of C21H24O10, a molecular weight of 436.4130, and a total energy of 36.4980 kcal/mol, which is a yellow powder that has a maximum UV absorption peak at approximately UV 280 nm (E and F). The fourth compound was dihydrochalcone, with a chemical formula of C21H24O10, a molecular weight of 436.4130, and a total energy of 39.5155 kcal/mol; this compound is a white powder that has a maximum UV absorption peak at approximately UV 340 nm (G and H). The fifth compound was phloridzin, with a chemical formula of C20H22O10, a molecular weight of 422.3860, and a total energy of 30.9717 kcal/mol, which is a kind of yellowish white powder that has a maximum absorption peak at approximately UV 285 nm (I and J). The contents of these five major compounds from high to low were as follows: trilobatin (15.42 ± 1.068 mg/g) > phloridzin (9.423 ± 1.125 mg/g) > quercitrin (8.533 ± 1.222 mg/g) > dihydrochalcone (8.20 ± 1.212 mg/g) > luteolin (5.373 ± 1.096 mg/g) (K).
Figure 4. The main compounds constituted more than 73.80% of the total flavonoid content and included quercitrin, luteolin, trilobatin, dihydrochalcone, and phloridzin. A. Mass spectrum of quercitrin. B. Structural formula of quercitrin. C. Mass spectrum of luteolin. D. Structure of luteolin. E. Mass spectrum of trilobatin. F. Structure of trilobatin. G. Mass spectrum of dihydrochalcone. H. Structure of dihydrochalcone. I. Mass spectrum of phloridzin. J. Structure of phloridzin. K. Contents of the five major substances.
3.5. Total flavonoids were safe after oral administration and could be used to treat male reproductive disorders and serious toxicity after intraperitoneal injection
For oral acute toxicity experiments, all mice in the NC, LLHC(50), LLHC(100), LLHC(150), LLHC(200), and LLHC(250) groups did not die during the experimental period, except one mouse that died in the LLHC(150) group on the fifth day. However, in the positive control (PH) group, five mice died (A). According to the acute toxicity experiments involving intraperitoneal injection, 5 out of 10 mice died in the positive control (PH) group, no mice died in the LLHC (1.563) and LLHC (3.125) groups, 1 out of 10 mice died in the LLHC (6.25) group, 5 out of 10 mice died in the LLHC (12.5) group, 9 out of 10 mice died in the LLHC (25) group, 10 out of 10 mice died in the LLHC (50) group within two days, and 10 out of 10 mice died in the LLHC (100) group within 5 h (B). These results indicated that the total flavonoids were safe after oral administration but caused serious toxicity after direct injection.
Figure 5. Total flavonoids were safe after oral administration and had an intervened role to male reproductive disorders but had serious toxicity after intraperitoneal injection in mice. A. Survival curves of the mice in the oral toxicity experiment. B. Survival curves of the mice in the intraperitoneal injection experiment. C. Microscopic features of mouse sperm. D. Changes in body weight during the experimental period. E. Testis indices of the experimental mice. F. Epididymis indices of the experimental mice. G. Sperm aberration ratio of the experimental mice. Different capital letters indicate highly significant differences (P < 0.01). Different lowercase letters indicate significant differences (p < 0.05). Scale bar: 20 μm; NC: negative control; PH: procaine hydrochloride; CP: cyclophosphamide group.
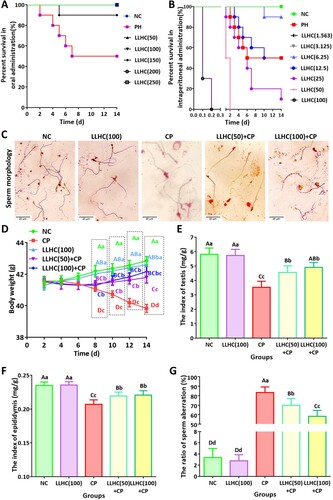
After intragastric administration of the total flavonoids, the increase in mouse body weight in the LLHC(100) group was slower than that in the NC group, but the difference was not significant. However, compared to that in the NC group, a significant weight loss trend was observed in the MD group from the eighth to fourteenth days. This trend was significantly inhibited after intragastric administration of the total flavonoids in the LLHC(50)+CP and LLHC(100)+CP groups, but the body weight had difficulty recovering to normal (D). There were no significant differences in the testis or epididymis indices between the NC and LLHC(100) groups or between the LLHC(50)+CP and LLHC(100)+CP groups. The testis and epididymis indices were significantly lower in the MD group than in the NC group. This reduction was significantly alleviated by intervention with the total flavonoids in the LLHC(50)+CP and LLHC(100)+CP groups, but these groups also experienced difficulty in recovering to normal levels (E and F). The ratio of sperm aberrations was not significantly different between the NC and LLHC(100) groups but significantly increased to 83.37% in the CP group compared to that in the NC group. When male mice with reproductive disorders were treated with total flavonoids, the ratio of sperm aberrations decreased significantly in a dose-dependent manner in the LLHC(50)+CP and LLHC(100)+CP groups compared to that in the NC group. This reduction was significantly alleviated by intervention with the total flavonoids in the LLHC(50)+CP and LLHC(100)+CP groups, but it was difficult for sperm to recover to normal levels (C and G). These results indicated that the oral administration of total flavonoids was safe for the male reproductive system and that the use of total flavonoids in a male reproductive disorder mouse model partially alleviated the disease.
4. Discussion
Different extraction methods and technological parameters have important influences on the components and the contents of total flavonoids, and RSM has been shown to be a reliable method for determining these factors with some advantages (Liu et al., Citation2022; Xu et al., Citation2013). In most previous studies, the total flavonoids were extracted using an ethanol solution, in which a higher concentration and content of total flavonoids were obtained (He et al., Citation2022; Liang et al., Citation2017; Liu et al., Citation2021). However, these extracts contained many more water-insoluble flavonoids, and their composition was relatively more complicated. Moreover, their oral bioavailability is not advantageous. All of these aspects are different from the practical application of sweet tea (Supplementary Table 3). In the present study, to obtain components with high water solubility and bioavailability, microwave-assisted water extraction based on SFD and RSM was performed. The ratio of LLHC powder to water was the most significant factor among the four factors. However, when this ratio exceeded the optimum value, the extraction efficiency neither increased nor decreased. Too much water would increase the time and power needed for further processes. The other three factors displayed a parabolic trend in terms of their effect on the extraction efficiency of the total flavonoids, with a maximum point (central point). Moreover, these factors had a binomial interaction effect on each other, and all maximum points were commonly composed of an optimum response surface. Through experiments and response analysis, the optimum total flavonoid extraction conditions were obtained.
According to previous reports, the total flavonoid content and bioactivation of LLHC from different regions were significantly different (He et al., Citation2022; Wang et al., Citation2021). This universal phenomenon also occurs with flavonoids from other dietary plants or herbs, such as vegetables, fruits, and even red wine (Billowria et al., Citation2022). Generally, flavonoid resources are abundant. However, these flavonoids in LLHC cannot be easily digested, absorbed or utilised after oral administration in practice because of their insolubility in water (Fujitaka et al., Citation2019). Therefore, in this study, microwave-assisted water extraction was used to obtain water-soluble flavonoid components for subsequent food and medical applications. There were 33 kinds of flavonoids to be detected, which was significantly less than that found in the organic solvent extract (Guo et al., Citation2021; Tian et al., Citation2022; Wang et al., Citation2021). In this study, the total flavonoid compounds extracted could have better water solubility than the ethanol extract due to the presence of hydrophilic radicals. Through LC–MS and NMR investigations, the 5 main compounds were shown to be glucose residues with multiple hydroxide radicals, which is consistent with the increasing water solubility.
Although the flavonoids in the LLHC ethanol have been determined to be safe after oral administration, with the largest oral dosage in rats being 560 mg/kg/day (Supplementary Table 3) (Liang et al., Citation2017), the toxicity of the different compounds in the water extract remains unknown. In the present study, the total flavonoids from LLHC water extract were also determined to be safe after oral administration. However, severe toxicity was detected after intraperitoneal injection. We speculated that the components of this extract are very complex. After oral administration, some of the pharmacological or nutritional ingredients are selected for utilisation or are processed into secondary metabolites in the digestive tract, and the toxicant is removed or transformed into a nontoxic substance. However, after intraperitoneal injection, the compounds are directly placed on the target organs, and the toxicant or synergistic toxicant in the total flavonoid complex can cause severe poisoning.
Drinking tea has become an increasingly prevalent practice (Carraturo et al., Citation2018), and LLHC sweet tea has always been popular in South China and is considered a long-lived sweet tea beverage. However, the male reproductive toxicity of this product is not fully known. In the present study, male reproductive toxicity was investigated, and it was found that the total flavonoids of LLHC are relatively safe. Interestingly, the total flavonoids had some alleviating effect on male reproductive disorder mice.
5. Conclusion
The total water-soluble flavonoids of LLHC sweet tea were obtained through an optimum technological process based on RSM and contained approximately 33 substances. Over 73.80% of the content was composed of five components, including quercitrin, luteolin, trilobatin, dihydrochalcone, and phloridzin. Total flavonoids were safe after oral administration and even alleviated reproductive disorders in male mice, but the complex compounds of total flavonoids hindered their direct injection.
Author contributions
Junfei Xu: conceptualisation, investigation, methodology, performance, visualisation and writing of the original draft of the manuscript. Juzuo Zhang and Xianjin Wu: conceptualisation, writing, reviewing and editing of the manuscript, study supervision, and project administration. Yingqi Zhao, Jing Wen, Ye Lin, Yangtao Li, and Yijun He: preparation of animal models, sample collection, investigation, and writing-reviewing and editing of the manuscript.
Ethics approval and consent to participate
Animal experiments were approved by the Animal Ethical and Welfare Committee of Huaihua University (Huaihua: 2022 (A03028)).
Supplemental Material
Download MS Word (24 KB)Acknowledgements
We thank all the organisations and individuals who provided generous help with this study.
Disclosure statement
No potential conflict of interest was reported by the author(s).
Data availability statement
The data that support the findings of this study are available upon reasonable request from the corresponding authors.
Additional information
Funding
References
- Adeniyi, O., Baptista, R., Bhowmick, S., Cookson, A., Nash, R. J., Winters, A., Shen, J., & Mur, L. A. J. (2022). Isolation and characterisation of quercitrin as a potent anti-sickle cell anaemia agent from Alchornea cordifolia. Journal of Clinical Medicine, 11(8), 2177. https://doi.org/10.3390/jcm11082177
- Aigbe, F. R., Sofidiya, O. M., James, A. B., Sowemimo, A. A., Akindere, O. K., Aliu, M. O., Dosunmu, A. A., Chijioke, M. C., & Adeyemi, O. O. (2019). Evaluation of the toxicity potential of acute and sub-acute exposure to the aqueous root extract of Aristolochia ringens Vahl. Journal of Ethnopharmacology, 244, 112150. https://doi.org/10.1016/j.jep.2019.112150
- Billowria, K., Ali, R., Rangra, N. K., Kumar, R., & Chawla, P. A. (2022). Bioactive flavonoids: A comprehensive review on pharmacokinetics and analytical aspects. Critical Reviews in Analytical Chemistry, 1–15. https://doi.org/10.1080/10408347.2022.2105641
- Carraturo, F., De Castro, O., Troisi, J., De Luca, A., Masucci, A., Cennamo, P., Trifuoggi, M., Aliberti, F., & Guida, M. (2018). Comparative assessment of the quality of commercial black and green tea using microbiology analyses. BMC Microbiology, 18(1), 4. https://doi.org/10.1186/s12866-017-1142-z
- Fujitaka, Y., Hamada, H., Uesugi, D., Kuboki, A., Shimoda, K., Iwaki, T., Kiriake, Y., & Saikawa, T. (2019). Synthesis of daidzein glycosides, alpha-tocopherol glycosides, hesperetin glycosides by bioconversion and their potential for anti-allergic functional-foods and cosmetics. Molecules, 24(16), 2975. https://doi.org/10.3390/molecules24162975
- Guo, H., Fu, M. X., Zhao, Y. X., Li, H., Li, H. B., Wu, D. T., & Gan, R. Y. (2021). The chemical, structural, and biological properties of crude polysaccharides from sweet tea (Lithocarpus litseifolius (Hance) Chun) based on different extraction technologies. Foods (basel, Switzerland), 10(8), 1779. https://doi.org/10.3390/foods10081779
- He, C. M., Cheng, Z. H., & Chen, D. F. (2013). Qualitative and quantitative analysis of flavonoids in Sophora tonkinensis by LC/MS and HPLC. Chinese Journal of Natural Medicines, 11(6), 690–698. https://doi.org/10.1016/S1875-5364(13)60081-3
- He, X. Q., Liu, D., Liu, H. Y., Wu, D. T., Li, H. B., Zhang, X. S., & Gan, R. Y. (2022). Prevention of ulcerative colitis in mice by sweet tea (Lithocarpus litseifolius) via the regulation of gut microbiota and butyric-acid-mediated anti-inflammatory signaling. Nutrients, 14(11), 2208. https://doi.org/10.3390/nu14112208
- Jahani Yazdi, A., Javanshir, S., Soukhtanloo, M., Jalili-Nik, M., Jafarian, A. H., Iranshahi, M., Hasanpour, M., Khatami, S.-M., Hosseini, A., Amiri, M. S., & Ghorbani, A. (2020). Acute and sub-acute toxicity evaluation of the root extract of Rheum turkestanicum Janisch. Drug and Chemical Toxicology, 43(6), 609–615. https://doi.org/10.1080/01480545.2018.1561713
- Leoni, F., Hazrati, H., Fomsgaard, I. S., Moonen, A. C., & Kudsk, P. (2021). Determination of the effect of co-cultivation on the production and root exudation of flavonoids in four legume species using LC-MS/MS analysis. Journal of Agricultural and Food Chemistry, 69(32), 9208–9219. https://doi.org/10.1021/acs.jafc.1c02821
- Li, S. G., Xu, S. Z., Niu, Q., Ding, Y. S., Pang, L. J., Ma, R. L., Feng, G. L., Liu, J. M., Zhang, X. F., Xiang, H. L., & Li, F. (2016). Lutein alleviates arsenic-induced reproductive toxicity in male mice via Nrf2 signaling. Human & Experimental Toxicology, 35(5), 491–500. https://doi.org/10.1177/0960327115595682
- Liang, J., Chen, S. X., Huang, S., Wu, Y. Y., Zhou, C. J., Jiang, D. X., Liang, C.-y., Yuan, H.-q., Hou, S.-z., & Lai, X. P. (2017). Evaluation of toxicity studies of flavonoid fraction of Lithocarpus polystachyus Rehd in rodents. Regulatory Toxicology and Pharmacology, 88, 283–290. https://doi.org/10.1016/j.yrtph.2017.07.006
- Liu, H. Y., Liu, Y., Mai, Y. H., Guo, H., He, X. Q., Xia, Y., Li, H., Zhuang, Q.-G., & Gan, R. Y. (2021). Phenolic content, main flavonoids, and antioxidant capacity of instant sweet tea (Lithocarpus litseifolius [Hance] Chun) prepared with different raw materials and drying methods. Foods (Basel, Switzerland), 10(8), 1930. https://doi.org/10.3390/foods10081930.
- Liu, Z., Zhao, M., Wang, X., Li, C., Wang, J., Liu, Z., Shen, X., & Zhou, D. (2022). Response surface methodology-optimized extraction of flavonoids with antioxidant and antimicrobial activities from the exocarp of three genera of coconut and characterization by HPLC-IT-TOF-MS/MS. Food Chemistry, 391, 132966. https://doi.org/10.1016/j.foodchem.2022.132966
- Ozarowski, M., Mikolajczak, P. L., Kujawski, R., Wielgus, K., Klejewski, A., Wolski, H., & Seremak-Mrozikiewicz, A. (2018). Pharmacological effect of quercetin in hypertension and its potential application in pregnancy-induced hypertension: Review of in vitro, in vivo, and clinical studies. Evidence-Based Complementary and Alternative Medicine, 7421489. https://doi.org/10.1155/2018/7421489
- Poojary, K. K., Nayak, G., Vasani, A., Kumari, S., Dcunha, R., Kunhiraman, J. P., Gopalan, D., Rao, R. R., Mutalik, R. R., Kalthur, S., Murari, S. G., Raghu, M. S., Adiga, S. V., Rao, S. K., & Kalthur, G. (2021). Curcumin nanocrystals attenuate cyclophosphamide-induced testicular toxicity in mice. Toxicology and Applied Pharmacology, 433, 115772. https://doi.org/10.1016/j.taap.2021.115772
- Primikyri, A., Mazzone, G., Lekka, C., Tzakos, A. G., Russo, N., & Gerothanassis, I. P. (2015). Understanding zinc(II) chelation with quercetin and luteolin: A combined NMR and theoretical study. The Journal of Physical Chemistry B, 119(1), 83–95. https://doi.org/10.1021/jp509752s
- Shang, A., Liu, H. Y., Luo, M., Xia, Y., Yang, X., Li, H. Y., Wu, D. T., Sun, Q., Geng, F., & Gan, R. Y. (2022). Sweet tea (Lithocarpus polystachyus rehd.) as a new natural source of bioactive dihydrochalcones with multiple health benefits. Critical Reviews in Food Science and Nutrition, 62(4), 917–934. https://doi.org/10.1080/10408398.2020.1830363
- Tian, Z., Tan, Z., Li, Y., & Yang, Z. (2022). Rapid monitoring of flavonoid content in sweet tea (Lithocarpus litseifolius (Hance) Chun) leaves using NIR spectroscopy. Plant Methods, 18(1), 44. https://doi.org/10.1186/s13007-022-00878-y
- Wang, M., Liu, X., Zhang, Z., Yu, J., Liu, J., & Wu, Y. (2021). Phytochemicals and bioactive analysis of different sweet tea (Lithocarpus litseifolius [Hance] Chun) varieties. Journal of Food Biochemistry, 45, e13183. https://doi.org/10.1111/jfbc.13183
- Wang, Q., Song, W., Qiao, X., Ji, S., Kuang, Y., Zhang, Z. X., Bo, T., Guo, D. A., & Ye, M. (2016). Simultaneous quantification of 50 bioactive compounds of the traditional Chinese medicine formula Gegen-Qinlian decoction using ultra-high performance liquid chromatography coupled with tandem mass spectrometry. Journal of Chromatography A, 1454, 15–25. https://doi.org/10.1016/j.chroma.2016.05.056
- Wei, W. W., Wu, P., You, X. Y., Xue, J. H., Xu, L. X., & Wei, X. Y. (2021). Dihydrochalcones from the leaves of Lithocarpus litseifolius. Journal of Asian Natural Products Research, 23(9), 819–824. https://doi.org/10.1080/10286020.2020.1786067
- Wu, E. Y., Sun, W. J., Wang, Y., Zhang, G. Y., Xu, B. C., Chen, X. G., Hao, K. Y., & Si, H. B. (2022). Optimization of ultrasonic-assisted extraction of total flavonoids from Abrus Cantoniensis (Abriherba) by response surface methodology and evaluation of its anti-inflammatory effect. Molecules, 27(7), 2036. https://doi.org/10.3390/molecules27072036
- Xu, Q., Shen, Y., Wang, H., Zhang, N., Xu, S., & Zhang, L. (2013). Application of response surface methodology to optimise extraction of flavonoids from fructus sophorae. Food Chemistry, 138(4), 2122–2129. https://doi.org/10.1016/j.foodchem.2012.11.099
- Yang, L., Cao, Y. L., Jiang, J. G., Lin, Q. S., Chen, J., & Zhu, L. (2010). Response surface optimization of ultrasound-assisted flavonoids extraction from the flower of Citrus aurantium L. Journal of Separation Science, 33(9), 1349–1355. https://doi.org/10.1002/jssc.200900776
- Zhou, C. J., Huang, S., Liu, J. Q., Qiu, S. Q., Xie, F. Y., Song, H. P., Li, Y. S., Hou, S. Z., & Lai, X. P. (2013). Sweet tea leaves extract improves leptin resistance in diet-induced obese rats. Journal of Ethnopharmacology, 145(1), 386–392. https://doi.org/10.1016/j.jep.2012.09.057