
 ?Mathematical formulae have been encoded as MathML and are displayed in this HTML version using MathJax in order to improve their display. Uncheck the box to turn MathJax off. This feature requires Javascript. Click on a formula to zoom.
ABSTRACT
Pharmacy dispensing data are useful for estimating adherence to therapy. Here, we implement multiple adherence measures to antiretroviral therapy (ART) and provide an online tool for visualising results. We conducted a cohort study for 2,042 people dispensed ART in Australia. We assessed adherence using the Proportion of Days Covered (PDC) within 360 days of follow-up as a continuous measure and dichotomised (PDC ≥80%). We defined a covered day as the 1) exposure to ≥3 antiretrovirals at the same time 2) exposure to any antiretroviral 3) lowest number of days covered per antiretroviral 4) average of days covered over all antiretrovirals 5) highest number of days covered per antiretroviral. For each method, we conducted sensitivity analyses. The median PDC ranged between 93.3%−98.3%. Between 67.0%−87.7% of individuals were classified as adherent, with higher values for measure 2 (85.5%−89.7%) and lower values for measure 3 (67.0%−70.9%). Censoring loss to follow-up had a higher impact on adherence estimates than considering a grace period. The variation in adherence estimates can be substantial, especially when dichotomising adherence. Researchers should consider operationalising multiple measures to estimate adherence bounds and identify a range of people at risk of non-adherence for targeted interventions.
Introduction
Pharmacy dispensing data can be used to evaluate adherence to pharmacotherapy. The methods compare the observed frequency and intervals between refills to the expected exposure if patients followed recommended treatment – a proxy of patient’s medicine consumption behaviour(Berg & Arnsten, Citation2006). Although a range of measures are used to estimate adherence to antiretroviral therapy (ART), dispensing data methods perform as well as self-report, pill counts and electronic monitoring in predicting HIV viral suppression(Almeida-Brasil et al., Citation2019).
Advantages of adherence based on dispensing data over other methods include: the data is readily available, lack recall and social desirability bias, have the potential to track individuals over time and the capacity to be population-wide (Berg & Arnsten, Citation2006). However, there is no gold standard definition, with a systematic review identifying over 30 variants of measures evaluating adherence to multiple medicines(Pednekar et al., Citation2019). Despite the heterogeneity in definitions, the review identified core elements to measure adherence from these data, including estimates of overlapping days of exposure for medicines of interest or exposure to each medicine component separately.
Estimating adherence to ART is more straightforward when people use single-tablet regimens, containing a complete regimen into a single tablet taken once daily. However, the use of multi-tablet regimens is still common and poses additional challenges for adherence estimation. These regimens are often associated with impaired adherence(Altice et al., Citation2019), highlighting the need for measures that adequately identify people at higher risk of non-adherence.
We have previously estimated adherence to ART in Australia using two definitions(de Oliveira Costa et al., Citation2020). Here, we expand the analyses and detail our experience in quantifying the effect of five measures of adherence to ART based on pharmacy dispensing data. We selected the most common measures in the literature and explored these differences quantitatively. We developed a web-based application to depict adherence patterns and allow the interactive visualisation of results obtained.
Methods
This study was approved by the New South Wales Population and Health Services Research Ethics Committee (2013/11/494), and data access was granted by the Services Australia External Request Evaluation Committee (MI10477).
Data and cohort selection
We published details of the cohort selection elsewhere(de Oliveira Costa et al., Citation2020). Briefly, we used a 10% random sample of people eligible for the Pharmaceutical Benefits Scheme (PBS) to identify all people aged ≥18 years dispensed antiretroviral agents between January 2016 and December 2017. As the PBS dataset does not contain the indication for prescribing, we restricted our cohort to people dispensed at least three antiretroviral agents in a 30-day window as a proxy of ART for HIV treatment (e.g., Abacavir + lamivudine + dolutegravir, tenofovir + emtricitabine + elvitegravir/cobicistat)(World Health Organization, Citation2016). We defined the ART index date as the date of dispensing of the last medicine of the regimen occurring within this 30-day period and followed patients for 360 days after the index date.
Outcome measures
We calculated the adherence to ART using the Proportion of Days Covered (PDC), assessed by the total number of days a patient was exposed to antiretrovirals (days covered), divided by the total time period(Leslie et al., Citation2008). For ART in single-tablet regimens, we assumed individuals were taken pills once daily. For multi-tablet regimens, we considered the size of the antiretroviral dispensed packs, the quantity dispensed, and the recommended doses from the Australian guidelines(Medicine Australasian Society for HIV Viral Hepatitis and Sexual Health, Citation2017) to determine the duration of treatment(de Oliveira Costa et al., Citation2020).
We implemented five definitions of days covered, described in (Alfian et al., Citation2019; Pednekar et al., Citation2019). We also performed two mutually exclusive sensitivity analyses. First, we allowed a 3-day window between refills (grace period) across adherence measures since people do not always fill all their prescriptions on the same day. Second, we censored people after the end of supply days of their last antiretroviral dispensing within 360 days to evaluate the impact of loss to follow-up.
Box 1. Definitions for different methods to estimate adherence to multiple antiretrovirals.
Statistical analyses
For each measure, we report the mean and median PDC and the proportion of individuals achieving PDC ≥80% [defined as adherent](Bezabhe et al., Citation2016). We report results by scenario tested (base case, grace period or censoring) and stratified by selected characteristics at index date (age range, sex and ART regimen).
We conducted statistical analyses using SAS® software version 9.4 (SAS Institute Inc., Cary, NC, USA) and we used R Foundation for Statistical Computing Program 4.1.1 version (R Core Team 2017, Vienna, Austria) to develop an online web application (https://adherencehiv.shinyapps.io/Application) for visualisation of adherence results.
Results
We included 2,042 people (57% between 18–50 years or age, 88.6% male, 56.4% on single-tablet regimen). Overall, we observed up to 20% difference in the mean PDC across measures, with lower variation in median values (5%). However, we observed a larger variation when adherence was dichotomised, with 67.0%−87.7% of people classified as adherent. Using the definition of adherence to any antiretroviral yielded the highest adherence estimates, with the median PDC between 96.9%−98.3% and proportion of people classified as adherent between 85.5%−89.7% across scenarios evaluated ().
Table 1. Descriptive statistics of the measures of adherence estimated from pharmacy dispensing claims (N = 2,042).
Adding a 3-day grace period had little impact on adherence estimates obtained without this criterion (increased base estimates of the median PDC by less than 1.5%). Censoring people to their last antiretroviral dispensing or the end of follow-up increased median PDC estimates by 1.5%−2.0%, identifying as adherents an extra 80–90 individuals ().
Across all measures tested, people on multi-tablet regimens presented a greater variation in their PDC measures, lower median PDC and were less likely to be classified as adherent, particularly for measures 1, 3 and 4 (). Similarly, comparisons of adherence by age and sex may vary between measures implemented (See online web application for details).
Table 2. Descriptive statistics of the measures of adherence estimated from pharmacy dispensing claims according to antiretroviral regimen in their first dispensing (N = 2,042).
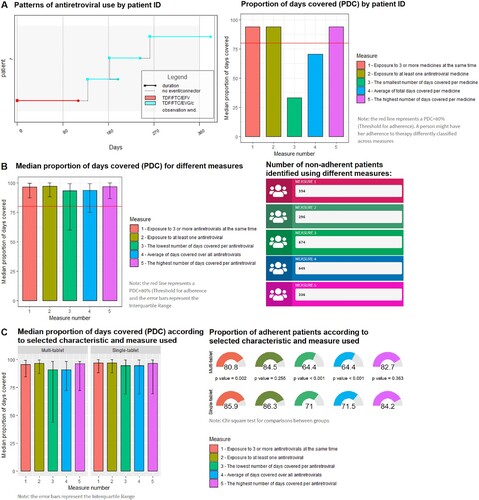
Using the web application, researchers can explore patterns of antiretroviral use for six hypothetical individuals and the adherence results for the entire cohort according to each measure used and by selected characteristics ().
Figure 1. Example of results provided in the three tabs of the web application to visualise patterns of medicine use and adherence estimates at the individual and populational level (Interactive tool available at https://adherencehiv.shinyapps.io/Application). A: Patterns of medicine use by patient ID: This tab enables identifying gaps in refills, changes in treatment and the results for adherence calculations for individual people based on each measure (Example for Patient ID 1). B: Cohort adherence results by different measures: This tab allows evaluating the impact of each measure and the implemented scenario on adherence estimates for the entire cohort. The tool also shows the absolute number of people identified as non-adherents to assist in selecting the appropriate measure (Example for base case scenario). C: Cohort adherence results by measure used and selected characteristics: This tab presents adherence results stratified by selected characteristics at index date according to each measure (Example for regimen type).
Discussion
This study quantified the impact of implementing five measures of adherence for ART from pharmacy dispensing data. The variation in the median PDC was small, but the mean PDC and proportion of individuals meeting a dichotomised threshold of adherence were more greatly influenced by different measures, especially among people using multi-tablet regimens. Across the board, allowing a short grace period for dispensings had little impact on adherence estimates while considering potential loss to follow-up increased adherence rates.
One of the essential purposes of monitoring adherence is to target populations at high risk of low adherence, and consequently, treatment failure. Most studies on adherence to ART classify people based on a threshold rather than using the PDC as a continuous variable (Almeida-Brasil et al., Citation2019; Pednekar et al., Citation2019). Considering the skewed distribution of PDC, reporting median values should be preferrable than mean values. Also, using at least two measures to report adherence should be considered due to the susceptibility of a PDC threshold to different definitions.
There are several reasons why adherence measures may differ between methods. More restrictive measures of adherence are often used to define a covered day when using claims data, including the use of all antiretrovirals prescribed(Chakraborty et al., Citation2020) or the use of a complete ART regimen (generally at least three antiretrovirals at the same time)(Cheng et al., Citation2018; Sutton et al., Citation2017; Taneja et al., Citation2012). As a result, more people are classified as non-adherent, identifying a broad population for targeted interventions compared to less restrictive measures. The average of antiretrovirals is also commonly used(Braithwaite et al., Citation2007; Kangethe et al., Citation2019), and can reflect the central adherence value of the entire regimen. However, this method might be adversely influenced by outliers and therapy switches, which can lead to an under or over-estimation of adherence estimates. For example, in our study we used the patient follow-up as the denominator (i.e., 360 days or the censor date for the follow-up). Consequently, each antiretroviral’s coverage days are divided by the same denominator even if the patient had switched therapy, underestimating overall adherence rates (See A). The same drawbacks can occur when using the “lowest” and “highest” covered days, limiting the clinical relevance of those measures in HIV adherence monitoring unless more sophisticated analyses are implemented. In contrast to the previous measures, exposure to any antiretroviral is relatively simple to operationalise and is the most sensitive to non-adherent people. This measure is useful to identify high-risk populations or to provide the upper estimate of adherence to ART(Alfian et al., Citation2019; de Oliveira Costa et al., Citation2020). Reporting this measure together with exposure to at least three antiretrovirals at the same time could provide the lower and upper bound of adherence to identify a suitable population for targeted interventions. Especially when people are using various ART regimens and multi-tablet regimens, which are more susceptible to different definitions.
A limitation of our adherence measures from pharmacy dispensing data is the assumption that people ingest all of their medicines if they fill a prescription. Another limitation of this study is the lack of indication or duration of dispensed treatment in PBS data, possibly leading to misclassification. PBS data also do not capture private and inpatient prescriptions in public hospitals, possibly underestimating adherence rates.(de Oliveira Costa et al., Citation2020; Mellish et al., Citation2015) Finally, we focused on adherence to prescribed doses and intervals; we did not assess persistence on prescribed therapy.
While measuring and monitoring adherence to antiretroviral treatment using routinely collected data is common, the choice of the measure used can substantially impact estimates. Visualisation of patterns of dispensing and adherence results by measure can assist in the selection of the most appropriate measures to be used, particularly when people use various ART regimens.
Conflicts of interest
SAP is a member of the Drug Utilisation Sub Committee of the Pharmaceutical Benefits Advisory Committee. The views expressed in this paper do not represent those of the Committee. In 2020, the Centre for Big Data Research in Health, UNSW Sydney has received funding from AbbVie Australia to conduct post-market surveillance research. AbbVie did not have any knowledge of, or involvement in, the current study.
Acknowledgments
We thank the Australian Government Services Australia for supplying the data.
Disclosure statement
No potential conflict of interest was reported by the author(s).
Additional information
Funding
References
- Alfian, S. D., Pradipta, I. S., Hak, E., & Denig, P. (2019). A systematic review finds inconsistency in the measures used to estimate adherence and persistence to multiple cardiometabolic medications. Journal of Clinical Epidemiology, 108, 44–53. https://doi.org/10.1016/j.jclinepi.2018.12.003
- Almeida-Brasil, C. C., Moodie, E. E. M., Cardoso, T. S., Nascimento, E. D., & Ceccato, M. (2019). Comparison of the predictive performance of adherence measures for virologic failure detection in people living with HIV: A systematic review and pairwise meta-analysis. AIDS Care, 31(6), 647–659. https://doi.org/10.1080/09540121.2018.1554241
- Altice, F., Evuarherhe, O., Shina, S., Carter, G., & Beaubrun, A. C. (2019). Adherence to HIV treatment regimens: Systematic literature review and meta-analysis. Patient Preference and Adherence, 13, 475–490. https://doi.org/10.2147/PPA.S192735
- Berg, K. M., & Arnsten, J. H. (2006). Practical and conceptual challenges in measuring antiretroviral adherence. JAIDS Journal of Acquired Immune Deficiency Syndromes, 43(Suppl 1), S79–S87. https://doi.org/10.1097/01.qai.0000248337.97814.66
- Bezabhe, W. M., Chalmers, L., Bereznicki, L. R., & Peterson, G. M. (2016). Adherence to antiretroviral therapy and virologic failure: A meta-analysis. Medicine, 95(15), e3361. https://doi.org/10.1097/MD.0000000000003361
- Braithwaite, R. S., Kozal, M. J., Chang, C. C., Roberts, M. S., Fultz, S. L., Goetz, M. B., … Justice, A. C. (2007). Adherence, virological and immunological outcomes for HIV-infected veterans starting combination antiretroviral therapies. Aids, 21(12), 1579–1589. https://doi.org/10.1097/QAD.0b013e3281532b31
- Chakraborty, A., Qato, D. M., Awadalla, S. S., Hershow, R. C., & Dworkin, M. S. (2020). Antiretroviral therapy adherence among treatment-naive HIV-infected patients. AIDS, 34(1), 127–137. https://doi.org/10.1097/QAD.0000000000002384
- Cheng, Y., Nickman, N. A., Jamjian, C., Stevens, V., Zhang, Y., Sauer, B., & LaFleur, J. (2018). Predicting poor adherence to antiretroviral therapy among treatment-naïve veterans infected with human immunodeficiency virus. Medicine, 97(2), e9495. https://doi.org/10.1097/md.0000000000009495
- de Oliveira Costa, J., Schaffer, A. L., Medland, N. A., Litchfield, M., Narayan, S. W., Guy, R., … Pearson, S. A. (2020). Adherence to antiretroviral regimens in Australia: A nationwide cohort study. AIDS Patient Care and STDs, 34(2), 81–91. https://doi.org/10.1089/apc.2019.0278
- Kangethe, A., Polson, M., Lord, T. C., Evangelatos, T., & Oglesby, A. (2019). Real-World Health plan data analysis: Key trends in Medication Adherence and Overall costs in patients with HIV. Journal of Managed Care & Specialty Pharmacy, 25(1), 88–93. https://doi.org/10.18553/jmcp.2019.25.1.088
- Leslie, S. R., Gwadry-Sridhar, F., Thiebaud, P., & Patel, B. V. (2008). Calculating medication compliance, adherence and persistence in administrative pharmacy claims databases. Pharmaceutical Programming, 1(1), 13–19. https://doi.org/10.1179/175709208X334614
- Medicine Australasian Society for HIV Viral Hepatitis and Sexual Health. (2017). Australian Commentary on the US Department of Health and Human Services (DHHS) Guidelines for the use of Antiretroviral Agents in HIV-1-Infected Adults and Adolescents.
- Mellish, L., Karanges, E. A., Litchfield, M. J., Schaffer, A. L., Blanch, B., Daniels, B. J., … Pearson, S. A. (2015). The Australian Pharmaceutical Benefits Scheme data collection: A practical guide for researchers. BMC Research Notes, 8(1), 634. https://doi.org/10.1186/s13104-015-1616-8
- Pednekar, P. P., Agh, T., Malmenas, M., Raval, A. D., Bennett, B. M., Borah, B. J., … Peterson, A. M. (2019). Methods for measuring multiple Medication adherence: A systematic review-report of the ISPOR Medication adherence and persistence special interest group. Value in Health, 22(2), 139–156. https://doi.org/10.1016/j.jval.2018.08.006
- Sutton, S. S., Magagnoli, J., & Hardin, J. W. (2017). Odds of viral suppression by single-tablet regimens, multiple-tablet regimens, and adherence Level in HIV/AIDS patients receiving antiretroviral therapy. Pharmacotherapy, 37(2), 204–213. https://doi.org/10.1002/phar.1889
- Taneja, C., Juday, T., Gertzog, L., Edelsberg, J., Correll, T., Hebden, T., & Oster, G. (2012). Adherence and persistence with non-nucleoside reverse transcriptase inhibitor-based antiretroviral regimens. Expert Opinion on Pharmacotherapy, 13(15), 2111–2118. https://doi.org/10.1517/14656566.2012.719875
- World Health Organization. (2016). Consolidated guidelines on the use of antiretroviral drugs for treating and preventing HIV infection: Recommendations for a public health approach.