
Abstract
Management by objectives requires selecting the appropriate number of indicators to measure objectives and then defining high-priority indicators. Failing to address these two issues often results in the so-called ‘performance paradox’. This paper describes an algorithm applied in the healthcare sector in the Italian regions. The resulting performance evaluation system is able to detect priority indicators in the target-setting phase, improving management and saving costs.
Governance based on planning and control systems with performance indicators (PIs) and targets is a form of indirect control that is widely deemed necessary to administer any complex system (Beer, Citation1966; Pollitt, Citation1986; Carter et al., Citation1992; Bird et al., Citation2005). However, managing by objectives requires tackling at least two difficult issues:
Defining the appropriate number of indicators.
Choosing a rigorous principle to define which indicators should be considered as high priorities.
The process of governance by PIs and targets relies on the assumption that available indicators are both representative and accurate. The so-called ‘synecdoche’ principle assumes that the measurable part will satisfy both these conditions, by accurately representing the whole object (Carter et al., Citation1992). However, measurement systems almost never comply with the synecdoche principle, because the set of selected indicators is rarely able to portray the complexity of the evaluated processes (Bevan and Hood, Citation2006) and may cause distortions and stimulate undesired behaviours on the part of the agents who are controlled by the system.
Studies on the distorting effects of control systems are extensive (Birnberg et al., Citation1983; Briers and Hirst, Citation1990; Le Grand and Bartlett, Citation1993). The basic point is that, in order to make the planning and control scheme meaningful, the measures used should be consistent with the performance targets (which should, in turn, be representations of organizational objectives) so that the behavioural responses of the agents are matched to the requirements of the principal (Smith, Citation1995). The selection of the indicators and the consequent target-setting phase are therefore crucial, since they can potentially generate incoherent behaviours in the system and lead the organizations towards undesired goals (Ferreira and Otley, Citation2009; Locke and Latham, Citation2013).
Since the 1950s, scholars have been studying the dysfunctional consequences of measurement; many of them have looked at ‘output distortions’, i.e. attempts to achieve single targets at the cost of significant but unmeasured aspects of performance (Ridgway, Citation1956; Nove, Citation1958; Miller, Citation1993; Kornai, Citation1994; Smith, Citation1995; Heinrich, Citation2002; Hood, Citation2002; Propper and Wilson, Citation2003; Bird et al., Citation2005; Bevan and Hood, Citation2006).
In 1991, Bouckaert and Balk described ‘13 diseases’ of public productivity measurement, which resulted from wrong assumptions and problems concerning the content, position and amount of measures (Bouckaert and Balk, Citation1991). Similarly, Smith wrote about eight potential and unintended behavioural consequences of performance data use (Smith, Citation1995). These problems are all the result ignoring the synecdoche principle, which causes an inconsistency between agents’ goals and the actual goals wanted by the principal: ‘tunnel vision’, ‘suboptimization’, ‘myopia’, ‘measure fixation’, ‘misrepresentation’, ‘misinterpretation’, ‘gaming’, and ‘ossification’ (Hopwood, Citation1973; Smith, Citation1993, Citation1995; NHS Executive, Citation1999, Citation2000; Goddard et al., Citation2000; Citation2002). Tunnel vision is when management emphasizes quantifiable phenomena in a performance measurement scheme, at the expense of unquantifiable or unmeasured aspects of the performance.
Since the 2000s, many scholars have been investigating the reasons behind failures of results-based management, with a particular focus on the public sector (Hofstede, Citation1981; Eden and Hyndman, Citation1999; Van Thiel and Leeuw, Citation2002).
Managing by objectives requires tackling two issues: first, defining the appropriate number of indicators that work as objectives; second, choosing a correct principle to define which indicators should be considered as high priorities. Regarding the second point, some recent studies have found that public managers prioritize competing performance goals according to political control mechanisms (Rutherford and Meier, Citation2015). This means that the determinants of managerial priorities are not always to improve performance or produce better value for money, but are the result of bureaucratic control/hierarchical pressure.
The result of all these limitations is the so-called ‘performance paradox’, which is a weak correlation between PIs and performance (Meyer and O’Shaughnessy, Citation1993; Meyer and Gupta, Citation1994). Certain characteristics of public sector organizations can increase the chance of a performance paradox occurring (Le Grand, Citation1991; Torenvlied, Citation2000; Fountain, Citation2003). Performance measurement systems in the public sector can degenerate into formal ceremonies that have little impact on behaviours and do not contribute to improve the efficiency, effectiveness and accountability of an organization (Sharifi and Bovaird, Citation1995).
In countries that have adopted universal healthcare coverage financed by general taxation (Morton and Cornwell, Citation2009), profit is not significant while the concept of ‘value for money’ is very important. Performance evaluation systems in these cases need to include a wide range of indicators (Taylor and Taylor, Citation2015). Process, efficiency and productivity indicators should be included in the performance evaluation systems (Murray and Frenk, Citation2000; Arah et al., Citation2003; Citation2006). A key issue is the choice of the appropriate number of indicators to use—too many targets and indicators might disorient and generate confusion and then priority actions can be ignored (Van der Stede, Citation2009). On the other hand, the fewer the number of PIs, the more difficult it is to obtain an accurate performance overview (Meyer and Gupta, Citation1994). Indicators also need to change over time (Van Thiel and Leeuw, Citation2002, p. 276).
Van Thiel and Leeuw (Citation2002) point out the need to find a balance between an expansion of the number of performance measures on the one hand, and a reduction of the measure pressure on the other. The target-setting phase should, therefore, include a number of targets large enough to limit the synecdoche and ‘output distortion’ problems and, at the same time, sufficiently small to keep the controlled actors focused on the priority issues.
Goddard proposed selecting some ‘headline’ indicators—focused on priority issues that are published and used to hold organizations to account. Other indicators would be used for internal benchmarking purposes only (Goddard et al., Citation2002). Smith suggests developing a dynamic performance evaluation system that would adapt the choice of the ‘right’ indicators to the situation (Scriven, Citation1973; Smith, Citation1993, p. 141).
The methodology we describe in this paper reflects both proposals, by combining the completeness of a wide performance evaluation system (PES) with a rigorous and iterative selection of a few headline indicators. The algorithm we describe sets regional priorities and selects a subset of indicators for the target-setting phase that will reflect the complexity of the healthcare systems without creating confusion with too many indicators.
We developed our PES to support Italian regional policy-makers in the target-setting phase and it is being used by the Italian regions. Our system provides regions with about 200 indicators (see, for details, Nuti et al., Citation2015). The Laboratorio MeS developed the performance evaluation framework as an independent research unit and co-ordinates and manages information-sharing and data acquisition. The 14 regions in the network have agreed on the criteria to calculate the indicators. Each region is responsible for processing its own data in order to increase the awareness and expertise of regional managers and their staff. The PES measures the results with a multidimensional approach in quantitative terms and then assesses the performance of 100 indicators out of 200: excellent, good, sufficient, poor, or very poor. These five evaluation tiers are associated with different colours, from dark green (excellent performance), to red (poor performance). Regions use the same reference standards for their evaluation, based on academic literature, national standards or, when these are lacking, on the median of the 150 health authorities (HAs).
At the start of the project, the regions agreed that they wanted increased transparency for public accountability. An annual performance report is published and the web platform where the data are stored is public (performance.sssup.it/netval). The report includes all measures for the regions and their HAs.
Method
Regional priorities are identified by jointly evaluating three different issues that should be relevant to them: performance; capacity for improvement; and reduction of geographical disparities. Geographical differences are important in terms of equal access: when variations that cannot be explained by population needs are found, there clearly is a problem with fairness (Wennberg et al., Citation2003; Barsanti and Nuti, Citation2014; Nuti and Vainieri, Citation2014).
For each indicator in the PES, the method evaluates:
Regional performance, measured by benchmarking against the other regions.
Trend, measured in comparison with the other regions’ trends.
Internal variability, i.e. the measurement of the differences between local health authorities (LHAs) in the region.
The algorithm first selects, from a total of 200 indicators, the indicators whose performance, trend and variability are universally available. It then excludes the indicators that regions consider to be ‘observational’ (indicators with questionable accuracy or that are not relevant by themselves but are important to be able to understand the dynamics of other indicators). This process assures that the remaining indicators are sufficiently relevant and accurate.
Second, the procedure excludes the indicators that depict the epidemiological status of the regions (for example infant mortality or suicides): these indicators portray the healthcare need of each region. Each LHA and every regional healthcare system aims at their improvement; however, these are measured with a two-year delay and the phenomena they monitor cannot be modified in the short term by the regional healthcare governance on its own.
Once these exclusions are made, about 85 indicators (with small fluctuations among regions) are left: these indicators provide the quantitative basis for detecting regional priorities. In order to do this, the regional performance of each indicator, its trend and its geographical (intra-regional) variability are computed as follows.
First, each indicator is evaluated against the performance of the other regions or— when available—against a national or an international standard. Each region is therefore assigned a discrete score for each indicator, ranging from ‘1′ (‘poor performance’) to ‘5′ (‘excellent performance’). The score is assigned to a colour: red for ‘1′, orange for ‘2′, then yellow (score equal to ‘3′), green (‘4′) and dark green (‘5′). The same colours are associated with the trend and the variability score, described below. Colour-coding is very effective because it immediately depicts how the indicators are performing.
Second, the algorithm identifies regional priorities by considering the annual trend that each indicator shows. The annual trend of each indicator is computed for each region and compared to the trend of all the other regions. More precisely, the difference between each regional indicator trend and the median regional trend is computed; this difference is then divided by the inter-regional standard deviation of the trends, according to the following formula:
![]()
The resulting coefficient measures how far each regional indicator’s trend deviates from the network median. Each indicator is therefore assigned a second score for each region (the ‘trend score’), ranging again from ‘1′ (‘strong worsening’) to ‘5′ (‘strong improvement’). This score reflects each regional trend compared to the trends of the other regions: see . An example is the changes in the percentage of femur fractures operated on within two days of being admitted to hospital from 2012 to 2013 in the different regions in the network (see ). The percentage increased by nearly 26% in the autonomous province of Trento, while it did not change very much in Tuscany; therefore, considering the median and the standard deviation, the autonomous province of Trento is given a score equal to ‘5′ and Tuscany equal to ‘2′.
Figure 1. Femur fractures operated on within two days after hospital admission: 2012–2013 trend.
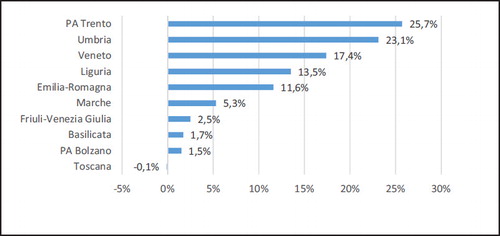
Table 1. Trend score.
Geographical performance variability among LHAs (within each region) is the third criterion the algorithm uses to identify regional criticalities. The inter-LHAs coefficients of variation are computed for each region and each indicator. The quintile distribution is subsequently calculated for each region. Equally, the coefficients of variation are not included for those indicators that refer to only one LHA in the region. A ‘variability score’ that ranges from 1 to 5 is attributed to each indicator, according to the quintile occupied by the indicator (see ).
Table 2. Variability score.
As an example, the coefficients of variation of Tuscany can be computed for 88 indicators in 2013. A variability score, based on quintile, assigns 5 to the first quintile, 4 to the second and so on: see .
Figure 2. Marche: coefficients of variation in 2013.
Finally, three different scores are available for each indicator and for each region: performance, trend and variability scores, each of them ranging from 1 to 5. It is therefore possible to sort the indicators for each region: first based on the performance score, second on the trend score, and finally, on the variability score.
Next, we added a fourth column to give policy-makers information about the financial impact each indicator might have in the short and medium term. The fourth column had a simple X next to the indicators where an improvement would result in financial savings within a year. The fourth element was added to the methodology to provide information on the relevance each indicator has in terms of resource re-allocation strategies (Nuti et al., Citation2010). See for an example.
Table 3. Example of the final output for region α.
Use of the methodology
provides a way of detecting regional problems, by jointly considering the performance of each region (benchmarked against the other regions), the trend of each indicator and intra-regional variability. Each region should start its analysis by examining the first column—benchmarked performance. In , a region should first take into consideration indicators C11a.3.1 and C18.6, which show a very poor performance, and subsequently move to indicators with a poor performance. An indicator requires a lot of attention if low performances are associated with worsening trends. The inclusion of the ‘variability score’ provides policy-makers with the information they need to design strategies that are tailored to single issues. If the third column warns of a strong intra-regional variability, each LHA should be assigned a specific target, based on the LHA’s previous performance. Under-performing LHAs should be required to show more improvement. However, if internal variability is low, the problem applies to the region as a whole and a structural answer should be designed, involving all of the actors of the healthcare system with uniform targets for providers.
Our technique has triggered discussions between regional managers on the priorities to be considered when setting HAs’ targets. In some cases, the tool has been used to link financial rewards, while in others it has been used to define the HA managers’ ‘mandated goals’, i.e. the results that chief executives are expected to meet in a three-year period.
The tool for setting priorities relies on information from the network’s performance evaluation system and it does not consider regional peculiarities. Therefore, it is up to regional policy-makers to decide how to weigh the three aspects (performance, trend and variability) in the priority-setting process and how to integrate the regional governance mechanisms with the evidence provided by the evaluation system.
Discussion and conclusions
This paper provides policy-makers and managers with a new method for selecting targets. The method overcomes some of the adverse effects found in large performance measurement systems. Regarding the synecdoche effect, our selection of indicators (85 were chosen out of 200) assured accuracy and relevance (accuracy and relevance are preconditions of the synecdoche principle). Second, we understood that neither the adoption of a limited set of indicators, nor the use of a wide range of measures automatically leads to distortion-free results (Holmstrom and Milgrom, Citation1991). However, our algorithm helps policy-makers select an appropriate number of indicators, without neglecting any important aspects of healthcare and—at the same time—without confusing anyone about priorities.
Our procedure systematically analyses all the available indicators, including all the indicators monitored by the PES in the criticalities detection process. However, the selection of the problematic indicators gives policy-makers the opportunity to set up an incentive system on a limited number of indicators, which keeps the controlled actors focused on the priorities. The mechanism we describe helps administrators set targets on ‘a part’ of the indicators, selected because of their relevance to the ‘whole’ system. Therefore, it solves the problem of using an excessive number of indicators.
Regarding output distortions, the iterative nature of our procedure—the selection of the priorities is repeated each year—limits opportunistic behaviours. Professionals cannot neglect the indicators that are not incentivized (‘suboptimization’). It detects worsening indicators (or their increase in variability) and these are automatically selected as priorities in the following year.
Bevan and Hood suggest a solution for limiting opportunistic behaviours by introducing some uncertainty in target specification. Their thesis is that excessive predictability could undermine the control itself, by facilitating opportunistic reactions (Bevan and Hood, Citation2004). The methodology we describe reverses their hypothesis: opportunistic behaviours are limited not by the inclusion of a degree of uncertainty but by the certainty that they will be detected the following year, when the algorithm includes all the indicators and not only the incentivized ones. The algorithm is designed to monitor a large number of indicators—and to account for the different viewpoints and goals stakeholders might have—but at the same time, it focuses the attention of the managers and the policy-makers on the indicators that are more critical in terms of performance, trends and variability.
To prevent the performance paradox, Meyer and Gupta (Citation1994) recommend that organizations adopt a ‘paradoxical model of performance assessment’ with multiple, uncorrelated, varying, but comparable, PIs. The method we describe does exactly that. This method is particularly appropriate for use at a regional (or macro) level. In transferring this approach to a micro-level (for instance hospitals or health authorities) internal differences must be taken into account. However, if the micro-level is responsible for a large territory or a large number of providers, as in the Italian regions, this approach could be used at the micro-level. In this case, further analyses are needed to better understand the typology of indicators to be included, the effectiveness of the use of this approach at micro-level and its results.
The method presented in this paper was developed as a governance tool for regional healthcare systems. It is the first step to follow in setting targets: identifying priorities. Other techniques can be useful to help managers define what is challenging and how to conduct a fair evaluation to motivate employees (see Vainieri et al., Citation2016). We believe that a similar approach could be applied also in other parts of the public sector that are managed by strong professional bureaucracies (Mintzberg, Citation1983; Mintzberg et al., Citation2003), and have information asymmetry and high complexity. We think that the method would be particularly useful in the education sector (Micheli and Kennerley, Citation2005; Bevan and Fasolo, Citation2013; Bevan and Wilson, Citation2013; Taylor and Taylor, Citation2015). Further research is needed to evaluate how our methodology should be fine-tuned to be used in other sectors.
Additional information
Notes on contributors
Sabina Nuti
Sabina Nuti is a Full Professor of Management, Laboratorio Management e Sanità, Institute of Management, Scuola Superiore Sant’Anna of Pisa, Italy.
Milena Vainieri
Milena Vainieri is an Associate Professor in Management, Laboratorio Management e Sanità, Institute of Management, Scuola Superiore Sant’Anna of Pisa, Italy.
Federico Vola
Federico Vola is a Research Fellow, Laboratorio Management e Sanità, Institute of Management, Scuola Superiore Sant’Anna of Pisa, Italy.
Related Research Data
References
- Arah, O. A. et al. (2003), Conceptual frameworks for health systems performance. International Journal for Quality in Health Care, 15, 5, pp. 377–398. doi: 10.1093/intqhc/mzg049
- Arah, O. A. et al. (2006), A conceptual framework for the OECD Health Care Quality Indicators Project. International Journal for Quality in Health Care (September).
- Barsanti, S. and Nuti, S. (2014), The equity lens in the health care performance evaluation system. International Journal of Health Planning and Management, 29, 3, pp. 233–246. doi: 10.1002/hpm.2195
- Beer, S. (1966), Decision and Control (Wiley).
- Bevan, G. and Fasolo, B. (2013), Models of governance of public services: empirical and behavioural analysis of ‘econs’ and ‘humans’. In Oliver, A. (Ed), Behavioural Public Policy (Cambridge University Press), pp. 28–62.
- Bevan, G. and Hood, C. (2004), Targets, inspections, and transparency. BMJ (Clinical Research), 328, p. 598. doi: 10.1136/bmj.328.7440.598
- Bevan, G. and Hood, C. (2006), What’s measured is what matters: targets and gaming in the English public health care system. Public Administration, 84, 3, pp. 517–538. doi: 10.1111/j.1467-9299.2006.00600.x
- Bevan, G. and Wilson, D. (2013), Does ‘naming and shaming’ work for schools and hospitals? Lessons from natural experiments following devolution in England and Wales. Public Money and Management, 33, 4, pp. 245–252. doi: 10.1080/09540962.2013.799801
- Bird, S. et al. (2005), Performance indicators: good, bad, and ugly. Journal of the Royal Statistical Society, 168, pp. 1–27. doi: 10.1111/j.1467-985X.2004.00333.x
- Birnberg, J. G., Turopolec, L. and Young, S. M. (1983), The organizational context of accounting. Accounting, Organizations and Society, 8, 2–3, pp. 111–129. doi: 10.1016/0361-3682(83)90018-1
- Bouckaert, G. and Balk, W. (1991), Public productivity measurement: diseases and cures. Public Productivity and Management Review, 15, 2, pp. 229–235. doi: 10.2307/3380763
- Briers, M. and Hirst, M. (1990), The role of budgetary information in performance evaluation. Accounting, Organizations and Society, 15, 4, pp. 373–398. doi: 10.1016/0361-3682(90)90024-O
- Carter, N., Klein, R. and Day, P. (1992), How Organisations Measure Success: The Use of Performance Indicators in Government (Routledge.)
- Eden, R. and Hyndman, N. (1999), Performance measurement in the UK public sector: poisoned chalice or holy grail? Optimum, 29, 1, pp. 9–15.
- Ferreira, A. and Otley, D. (2009), The design and use of performance management systems. Management Accounting Research, 20, 4, pp. 263–282. doi: 10.1016/j.mar.2009.07.003
- Forrester, J. W. (1968), Principles of Systems: Text and Workbook (MIT Press).
- Fountain, J. E. (2003), Paradoxes of public sector customer service. Governance, 14 (January), pp. 55–73. doi: 10.1111/0952-1895.00151
- Goddard, M. et al. (2002), Clinical performance measurement: part 2—avoiding the pitfalls. Journal of the Royal Society of Medicine, 95 (November), pp. 549–551. doi: 10.1258/jrsm.95.11.549
- Goddard, M., Mannion, R. and Smith, P. (2000), Enhancing performance in health care. Health Economics, 9, pp. 95–107. doi: 10.1002/(SICI)1099-1050(200003)9:2<95::AID-HEC488>3.0.CO;2-A
- Heinrich, C. J. (2002), Outcomes-based performance management in the public sector. Public Administration Review, 62, 6, pp. 712–725. doi: 10.1111/1540-6210.00253
- Hofstede, G. H. (1981), Management control of public and not-for-profit activities. Accounting, Organizations and Society, 6, 3, pp. 193–211. doi: 10.1016/0361-3682(81)90026-X
- Holmstrom, B. and Milgrom, P. (1991), Multitask principal-agent analyses. Journal of Law, Economics and Organization, 7 (January), pp. 24–52. doi: 10.1093/jleo/7.special_issue.24
- Hood, C. (2002), Control, bargains, and cheating: the politics of public-service reform. Journal of Public Administration Research and Theory, 12, 3, pp. 309–332. doi: 10.1093/oxfordjournals.jpart.a003536
- Hopwood, A. G. (1973), An Accounting System and Managerial Behaviour (Saxon House).
- Kaplan, R. S. and Norton, D. P. (1992), The balanced scorecard: measures that drive performance. Harvard Business Review, 70, pp. 71–79.
- Kornai, J. (1994), Overcentralization in Economic Administration: A Critical Analysis Based on Experience in Hungarian Light Industry (Oxford University Press).
- Le Grand, J. (1991), The theory of government failure. British Journal of Political Science, 21, 4, pp. 423–442. doi: 10.1017/S0007123400006244
- Le Grand, J. and Bartlett, W. (Eds) (1993), Quasi-Markets and Social Policy (Macmillan).
- Locke, E. A. and Latham, G. P. (Eds) (2013), New Developments in Goal Setting and Task Performance (Routledge).
- Mannion, R. and Braithwaite, J. (2012), Unintended consequences of performance measurement in healthcare: 20 salutary lessons from the English National Health Service. Internal Medicine Journal, 42, 5, pp. 569–574. doi: 10.1111/j.1445-5994.2012.02766.x
- Meyer, M. W. and Gupta, V. (1994), The performance paradox. Research in Organizational Behavior, 16, pp. 309–369.
- Meyer, M. W. and O’Shaughnessy, K. C. (1993), Organizational design and the performance paradox. In Swedberg, R. (Ed), Explorations in Economic Sociology (Russell Sage Foundation), pp. 249–278).
- Micheli, P. and Kennerley, M. (2005), Performance measurement frameworks in public and non-profit sectors. Production Planning and Control, 16, 2, pp. 125–134. doi: 10.1080/09537280512331333039
- Miller, G. J. (1993), Managerial Dilemmas. The Political Economy of Hierarchy (Cambridge University Press).
- Mintzberg, H. (1983), Structure in Five: Designing Effective Organizations (Prentice-Hall).
- Mintzberg, H. et al. (2003), The Strategic Process: Concepts, Contexts, Cases (Pearson Education).
- Morton, A. and Cornwell, J. (2009), What’s the difference between a hospital and a bottling factory? BMJ (Clinical Research Ed.), 339, p. 2727.
- Murray, C. J. L. and Frenk, J. (2000), A framework for assessing the performance of health systems. Bulletin of the World Health Organization, 78, 6, pp. 717–731.
- NHS Executive (1999), The NHS Performance Assessment Framework.
- NHS Executive (2000), The NHS Plan— Implementing the Performance Improvement Agenda.
- Nove, A. (1958), The problem of ‘success indicators’ in Soviet industry. Economica, 25, p. 97.
- Nuti, S., Vainieri, M. and Bonini, A. (2010), Disinvestment for re-allocation: a process to identify priorities in healthcare. Health Policy, 95, 2–3, pp. 137–143. doi: 10.1016/j.healthpol.2009.11.011
- Nuti, S. and Vainieri, M. (2014), Strategies and tools to manage variation in regional governance systems. In Johnson, A. and Stukel, T. (Eds), Medical Practice Variations (Springer Science).
- Nuti, S., Vola, F., Bonini, A. and Vainieri, M. (2015), Making governance work in the health care sector: evidence from a ‘natural experiment’ in Italy. Health Economics, Policy and Law, 11, 1, pp. 17–38. doi: 10.1017/S1744133115000067
- Pollitt, C. (1986), Beyond the managerial model: the case for broadening performance assessment in public services. Financial Accountability & Management, 2, 3, pp. 155–170. doi: 10.1111/j.1468-0408.1986.tb00033.x
- Propper, C. and Wilson, D. (2003), The use and usefulness of performance measures in the public sector. Oxford Review of Economic Policy, 19, 2, pp. 250–267. doi: 10.1093/oxrep/19.2.250
- Ridgway, V. F. (1956), Dysfunctional consequences of performance measurements. Administrative Science Quarterly, 1, pp. 240–247. doi: 10.2307/2390989
- Rutherford, A. and Meier, K. J. (2015), Managerial goals in a performance-driven system. Public Administration, 93, 1, pp. 17–33. doi: 10.1111/padm.12124
- Scriven, M. (1973), Goal-free evaluation. In House, E. R. (Ed), School Evaluation. The Politics and Process (McCutchan).
- Sharifi, S. and Bovaird, T. (1995), The financial management initiative in the UK public sector. International Journal of Public Administration, 18, 2–3, pp. 467–490. doi: 10.1080/01900699508525017
- Smith, P. (1993), Outcome-related performance indicators and organizational control in the public sector. British Journal of Management, 4, 3, pp. 135–151. doi: 10.1111/j.1467-8551.1993.tb00054.x
- Smith, P. (1995), On the unintended consequences of publishing performance data in the public sector. International Journal of Public Administration, 18, 2, pp. 277–310. doi: 10.1080/01900699508525011
- Taylor, M. and Taylor, A. (2015), The challenges of performance measurement in third sector organizations. In Radnor, Z. J. (Eds), Public Service Operations Management: A Research Handbook (Routledge).
- Torenvlied, R. (2000), Political Decisions and Agency Performances (Kluwer).
- Vainieri, M. (2016), How to set challenging goals and conduct fair evaluation in regional health systems: insights from Valencia and Tuscany regions. Health Policy. http://dx.doi.org/10.1016/j.healthpol.2016.09.011
- Van der Stede, W. A. (2009), Designing effective rewards systems. Finance and Management, 44, 170, pp. 6–9.
- Van Thiel, S. and Leeuw, F. L. (2002), The performance paradox in the public sector. Public Performance and Management Review, 25, 3, pp. 267–281. doi: 10.1080/15309576.2002.11643661
- Wennberg, J. E., Fisher, E. S. and Skinner, J. S. (2003), Geography and the debate over Medicare reform. Health Affairs, 22 (suppl.).