
ABSTRACT
New ways of voting in elections are being sought by electoral administrations worldwide who want to reverse declining voter turnouts without increasing electoral budgets. This paper presents a novel approach to cost accounting for multi-channel elections based on local elections in Estonia. By doing so, it addresses an important gap in the academic literature in this field. The authors confirm that internet voting was most cost-efficient voting channel offered to Estonian voters.
IMPACT
This paper presents a new, proven methodology for calculating the cost-efficiencies of various ways of voting. The authors provide rare data on electoral costs, including costs ranging from stationery to depreciation costs and provide a detailed cost breakdown of activities. The findings will have direct practical implications for electoral management bodies and policy-makers around the world.
Introduction
In order to deal with the tendency towards declining turnouts in democratic elections (Barrat Esteve et al., Citation2018; Lijphart, Citation1998; López Pintor & Gratschew, Citation2002), a number of governments and electoral management bodies (EMBs) are proposing, testing and/or implementing improvements to traditional voting systems (Kersting & Baldersheim, Citation2004; Krimmer, Triessnig, & Volkamer, Citation2007). These improvements include adapting administrative rules and procedures to allow citizens to cast their vote at different times during the voting period (Gronke, Galanes-Rosenbaum, & Miller, Citation2007), or employing different voting channels that increase ease and convenience of use for voters (Buckley, Citation2003; De Araújo, Citation2001; Krimmer, Citation2012). Adopting convenient and multi-channel electoral systems poses a set of new challenges for public administrations: for example an increased workload for the electoral administration, the risk of double voting, and the need to extend voting periods or manage overlapping voting periods (Xenakis & Macintosh, Citation2004a). Previous research on multi-channel elections (Krimmer et al., Citation2007; Xenakis & Macintosh, Citation2004b) has produced three main areas of concern:
Multi-channel elections increase complexity for electoral administrations.
Increased complexity requires business process re-engineering of electoral processes.
New voting channels impact the costs of elections.
We propose a methodology based on a case study of the 2017 Estonian local elections. There were significant variations in the costs of different voting channels, with internet voting being relatively inexpensive in comparison to other ways of voting. This finding emphasizes the importance of our new methodology, because no other reliable method is available to attribute costs to voting channels—so cost comparison has not been possible up to now. Our paper provides important insights for other administrations who need a benchmark for the cost-efficiency of various technologies, and internet voting in particular, in the electoral process (James & Jervier, Citation2017). We provide rare data on electoral costs, including costs ranging from stationery to depreciation costs and provide a detailed cost breakdown of activities.
We begin with some background on how electoral costs have been measured in the past and the disadvantages of those methodologies. Then we present our new methodology for electoral cost accounting, which we developed based on the time-driven activity-based costing (TD-ABC) and business process re-engineering (BPR) frameworks. Next we describe our case study; we conclude with a discussion of our findings and suggestions for further research.
Background
While the issue of the cost of voting has been relatively well researched (Downs, Citation1957; Niemi, Citation1976; Haspel & Gibbs Knotts, Citation2005; Li, Pomante, & Schraufnagel, Citation2018), with a significant number of publications on voter transaction costs in relation to internet voting (Goodman & Stokes, Citation2016; Oostveen & Van den Besselaar, Citation2004; Solvak & Vassil, Citation2016), there has been no research published on the costs that internet voting implementation places on an electoral administration. The main reason for this is the ‘methodological challenges’ (James & Jervier, Citation2017) in the way the administrative costs of elections are measured. An effective methodology for calculating costs will have an impact on researching democracy and voting processes by addressing a gap in the analysis of elections. It will also have a practical impact by helping governments to make more informed decisions on whether to introduce/keep internet voting.
Traditional approaches to analysing the costs incurred in holding elections were generally directed towards candidates and campaigns (Harada & Smith, Citation2014; Johnston & Pattie, Citation2008; Petithomme, Citation2012), voters (Colomer, Citation1991; Downs, Citation1957; Haspel & Gibbs Knotts, Citation2005; Niemi, Citation1976), or the costs of public information systems (Codagnone, Citation2007; Codagnone & Boccardelli, Citation2006; Codagnone & Cilli, Citation2006; Lau, Citation2006). Some useful general assumptions can be drawn from the literature:
The costs of elections have increased all over the world (Montjoy, Citation2010).
The different kinds of electoral costs and methodological scopes need to be defined for cost analysis (López-Pintor & Fisher, Citation2005).
Costs incurred by the addition of new voting channels must be included, either high one-off costs (for example introducing internet voting) or transaction costs (postal voting) (Krimmer & Wendt, Citation2010).
Reduced levels of transparency (Clark, Citation2019) and the limited possibilities for scrutiny offered by some voting modalities need to be considered (Electoral Reform Society, Citation2002).
Until now, no method of calculating costs has produced successful results for multi-channel elections (Xenakis & Macintosh, Citation2006). Since the seminal approach of Ernst & Ernst (Citation1979) to the management of electoral processes, consisting of a description on how to check and analyse costs based on the calculation of total costs through budgets and dividing this by the number of voters participating, no-one has put forward a methodology that has generated any kind of consensus about its suitability. The International Foundation for Electoral Systems (IFES) and the United Nations Development Programme (UNDP) ran an ambitious research programme based on a budget analysis of nine case studies, but encountered difficulties when trying to discover important hidden costs. Moreover, they struggled to put together different accounting systems and governance structures to make comparisons (López-Pintor & Fisher, Citation2005). Chowdhury (Citation2017) ran a similar analysis for the UK, based on a set of questionnaires sent to local authorities asking about the costs of a set of identified processes, but received such a limited number of replies (56 out of 400) that the final numbers were too small to draw valid conclusions. Similar concerns were expressed by James and Jervier (Citation2017) who also used a survey approach to establish electoral costs. Therefore survey- and budget-based approaches are unlikely to provide a way forward.
Methodologies for calculating election costs have faced difficulties that have prevented them from obtaining accurate results:
Difficulties accessing trustworthy data (Clark, Citation2014; James & Jervier, Citation2017), as many governments are not obliged to share information on electoral costs.
Difficulty in obtaining hidden costs.
The difficulties of allocating the costs of using public infrastructure.
Therefore we decided to develop new method for calculating the cost of elections.
Designing the methodology and research
This research has been designed as a critical case study (Flyvbjerg, Citation2006; Yin, Citation2014) and adapts TD-ABC methodology to the electoral field. Our case study was the Estonian 2017 local elections. The reasons we chose Estonia as a critical case were:
Estonia provides a diversity of voting channels, including internet voting which was implemented in 2005. Adopting internet voting raised a number of questions regarding impacts and the convenience of the system (Drechsler, Citation2004), which have been answered over the years. The only question that remains unanswered relates to the costs that internet voting involves for the Estonian budget (Krimmer et al., Citation2007; Krimmer & Volkamer, Citation2006; Xenakis & Macintosh, Citation2004b).
Estonia is constantly experimenting with voting innovations (for example the recent introduction of ‘supermarket voting’), making the voting system rich and diverse but, at the same time, complex and challenging to manage and to apply traditional approaches to cost analysis.
Multiple public sector organizations are involved in the financing and management of delivering elections in Estonia, such as the National Electoral Commission, State Electoral Office, the Estonian Information System Authority, local administrations, 28 county centres and 577 polling stations.
The Estonian administration of elections relies strongly on public infrastructure, for instance by running elections in schools with computers and printers borrowed from public institutions, which complicates the assessment of real costs.
Estonia is considering moving to activity-based costing (ABC) and budgeting from 2020, with some pilots already running, which increases the usefulness of our research results.
To develop our model, we used business-oriented methodologies, which have already been applied successfully in the public sector to calculate the administrative costs of public services, to develop our model (Mitchell, Citation2002). Our approach combined BPR (Attaran, Citation2004; Grover, Jeong, Kettinger, & Teng, Citation1995) with TD-ABC (Kaplan & Anderson, Citation2007).
BPR is a business strategy directed towards rethinking the way an organization functions by analysing its internal workflows and business processes (O’Neill & Sohal, Citation1999); in the private sector it is a good tool for helping to increase organizational efficiency and competitiveness (Attaran, Citation2004). BPR was considered by Gunasekaran and Nath (Citation1997) to improve quality, costs, services, lead time, outcomes, flexibility and innovation. BPR has had a limited implementation in electoral services so far (Uygur, Citation2009; Xenakis & Macintosh, Citation2006; Xenakis, Macintosh, & Centre, Citation2005).
At the same time, ABC, one of the most prominent and advanced methodologies in governmental cost accounting (Mohr, Citation2017), is also a good way of merging complexity, processes and costs (Brown, Myring, & Gard, Citation1999; Olshagen, Citation1991). ABC allows direct and indirect costs to be traced to a product, linking the costs of performing organizational activities directly to the products and customers for which these activities are performed (Cooper & Kaplan, Citation1992), allowing calculations of the actual costs per product/service unit. A key concept in ABC is the ‘cost driver’—an event, associated with an activity, which results in the consumption of a firm’s resources (Babad & Balachandran, Citation1993). The main cost driver in our TD-ABC approach was time (Kaplan & Anderson, Citation2007). This model has already been successfully applied in the healthcare field (Garcia et al., Citation2017; Laviana et al., Citation2016; Stouthuysen, Schierhout, Roodhooft, & Reusen, Citation2014) and has provided useful results on the cost-efficiency of various policies.
We consulted the electoral legislation, the internal instructions available for electoral administrations, national and local electoral budgets, procurement contracts, and time stamps in internet voting systems for data collection. We also monitored electoral administrations’ activities at different levels and across various periods of time throughout the electoral process. The information collected was cross-checked through interviews with the city officials responsible for organizing elections, members of EMBs, and members of the Estonian National Electoral Commission. In exceptional cases, estimates derived from statistical data concerning average salaries and distances travelled between constituencies were utilized.
Case study: Development of our cost analysis for the 2017 Estonian local elections
Our methodology can be broken down as follows:
Narrowing the electoral cycle.
Conducting process mapping, business process modelling and data collection.
Creating a list of activities and identifying resource pools.
Attributing costs to activities and adopting confidence measures: practical capacities and confidence intervals.
Transferring costs per activity to cost per ballot.
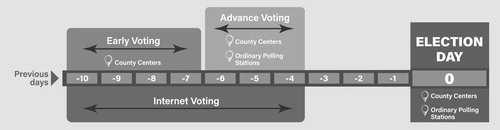
In the Estonian 2017 local elections, the following four major voting channels were available to voters: early voting from the 10th day up to the seventh day before the election day; advance voting from the fourth to sixth day before election day; internet voting from the 10th day to the fourth day before election day; and election day voting (see ). These four voting channels were organized in three different settings: county centres, ordinary polling stations, or via the internet. This gave us six units of analysis: early voting in county centres; advance voting in county centres; advance voting in ordinary polling stations; internet voting; election day voting in county centres; election day voting in ordinary polling stations.
Figure 1. Voting channels in the 2017 Estonian local elections.
Step 1: Narrowing the electoral cycle
Due to the ‘inordinate complexity’ of an electoral process and our interest on research rooted in the variation of cost between voting channels and their cost-efficiency, we took a selective approach to analysing the electoral process (Mozaffar & Schedler, Citation2002), which allowed us to focus on specific processes and to make comparisons. We did not focus on the overall costs of organizing elections, but restricted our research to a particular period of the electoral cycle—the electoral period (Krimmer et al., Citation2007); see . This was because the differences in allocating costs between different voting channels occur during the electoral period. Activities occurring at other periods of the electoral cycle are the same for every channel, and their inclusion would not affect our cost comparisons.
Figure 2. The electoral cycle (from Krimmer et al., Citation2007).
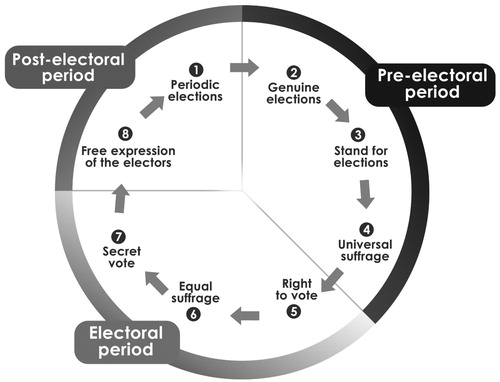
The election period in Estonia starts 90 days before election day, with ‘Informing citizens of their right to vote’ and finishes three days after election day with ‘Resolving complaints about electoral management’.
Step 2: Conducting process mapping, business process modelling and data collection
A list of activities occurring during the electoral period was compiled, involving the preparation and development of local elections in Estonia. Sources of information were the Local Government Council Election Act 2018 and publicly-available internal instructions for members of local electoral committees.
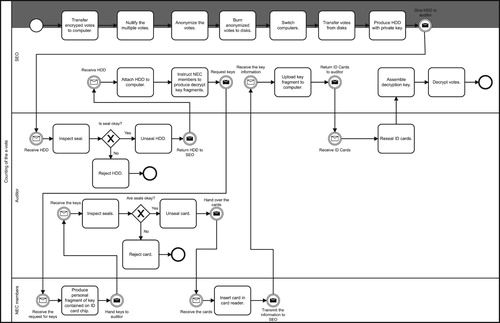
Using these sources of information, we used the business process model and notation (BPMN)—a language for modelling business processes (Becker, Algermissen, Niehaves, & Delfmann, Citation2005; Van Der Aalst, La Rosa, & Santoro, Citation2016). Modelling electoral activities allowed us to detect the potential sources of expenses connected with the activities required to run the different electoral channels, as well as to understand the internal dynamics and behavioural effects of these expenses in the various voting channels; see .
Figure 3. Model of the process involved in counting internet votes.
Multiple interviews were also conducted with staff from the State Electoral Office, the internet voting system auditor, members of city administrations and city electoral committees, and with the members and chairs of local polling stations. Interviews were complemented by onsite observations during advance voting days and on election day at different locations in Estonia. The aim was to obtain real data on the duration of certain activities (given the central role that ‘time’ plays as a cost driver) and to reduce the use of cost estimates by improving the information available. The onsite observation process was designed to understand the diversity of voting realities occurring throughout the country. The observation strategy was based on twin criteria: observing the voting process in different types of polling stations (in big cities, small villages, rural locations); and observing the voting process during the different periods into which the voting system is divided—early voting, advance voting and election day voting—covering different activities occurring on these occasions: onsite voting, home voting, voter identification, processing votes, physical vote counting and counting internet votes.
Step 3: Creating a list of activities and identifying resource pools
The activities involved in the administration of internet voting were auditing the internet voting system; organizing seminars and training sessions for official observers, the media and other parties interested in internet voting (activities aimed towards building trust); conducting a penetration test for the internet voting system; network monitoring; activities concerning harmonization between internet voting and paper-based voting; counting and recounting votes; storing and destroying internet votes, voting ID cards and hard drives.
The activities involved in the administration of paper-based voting, including early, advance and election day voting are: delivery of equipment; setting up a voting location; stamping ballot papers prior to voting; voter identification and issuing ballot papers; processing advance votes from outside the voting district; counting ballot papers; transporting ballot papers for recounting; and recounting.
Creating different lists of activities for each voting channel meant we were able to allocate costs to each of them. The list of resource pools consists of labour, depreciation, transportation, rentals, printing and stationery costs. Software depreciation costs for internet voting were calculated taking the expected lifespan and considering the costs since the initial acquisition contract (2003), the cost of updates and replacements.
For example, the costs of transportation for county centre voting (see ) involve delivery and collection of equipment for establishing the polling stations; transporting home votes; and the final transportation of votes for counting.
Table 1. Transportation costs in euro.
Step 4: Attributing costs to activities and adopting confidence measures—practical capacities and confidence intervals
Certain costs were directly attributed to activities when the availability of precise data made this possible via budget allocation. In cases where direct attribution was not possible, the ‘time’ variable acted as a cost driver by multiplying the time that a certain activity involved (in minutes) by the wage cost per minute of those in charge of this activity (see ).
Table 2. Calculating the labour costs for county centre voting.
For a more realistic approach, assuming that the level of output which one random, individual person can produce is governed by a certain amount of inefficiency, we set the practical capacity at 80% of theoretical full capacity. Similarly, given the number of assumptions included in our calculation, we introduced a theoretical confidence interval to integrate the possible variability of costs and time taken involved in the different processes analysed. The strategy followed involved ranging the data that was not directly accountable (estimations) using an 80% level of confidence. By doing this, we had a loss in precision, but we were able to ensure a more accurate the final result. This confidence interval affected our price estimates (for example printers, laptops, voting booths and privacy screens) and time estimates (for example the time to set up the voting location or for voter identification).
Step 5: Transferring costs per activity to cost per ballot
After the cost per activity was calculated, the cost per minute per activity was calculated by dividing the cost per activity by capacity. At this point, differences started to become visible in terms of resources, including human resources (see ).
Table 3. Comparison of costs per minute for early, advance and election day voting (costs per ballot per voting channel).
For the conversion, we needed to calculate:
The time required to ‘produce’ a single ballot in each voting channel by dividing the time spent on every activity by the number of ballots cast in a certain voting channel.
The cost per activity per ballot in each voting channel by multiplying the time that each activity involves by the cost per minute of each activity previously calculated.
The final range of costs by adding up the costs of every activity involved in the ‘production’ of a ballot by voting channel.
Findings
The results we obtained are shown in .
Table 4. Costs for the different voting channels used in the 2017 Estonian local elections.
Internet voting appears to be the most cost-effective and cheapest (in terms of cost per voter) voting channel due to the number of people choosing to use it (see ) and its lower costs. The cost of casting a vote over the internet was lower than traditional election day voting—the second cheapest option. Early and advance voting in county centres were more expensive due to their lengthier duration and the comparatively low numbers of participants that used these channels. Advance voting in ordinary polling stations was by far the least cost-effective of the channels considered.
Table 5. Turnout distribution by voting channel in the 2017 Estonian local elections.
Our costs per vote relate to two main elements: the resources consumed in each channel and how many people used a voting channel. As a general conclusion when trying to increase the voting convenience, internet voting seems to be a good bet in terms of cost-efficiency and successful take-up by voters in comparison to the other non-traditional channels of convenient voting. The tendency towards the use of internet voting by the Estonian electoral administration has resulted in improved cost-efficiency, in contrast with other new channels (early voting and advance voting in county centres and, especially, advance voting in ordinary voting stations) that, not having very high user ratios, consumed more resources.
Discussion and conclusions
This paper has examined two important issues that have not been successfully addressed in previous literature: finding an effective methodology for calculating the cost of elections and comparing the costs of traditional voting with newer forms, such as internet voting.
Our findings indicate that internet voting was the most cost-efficient voting channel, followed by election day voting in the 2017 Estonian local elections. Other voting channels were more expensive due to the length of deployment and the lower usage rates, advance voting in ordinary polling stations being the less cost-efficient channel.
The methodology we built on the basis of TD-ABC and BPR frameworks allowed us to: consider the direct and indirect costs and different cost pools, including wages, depreciation, transportation, renting, printing and stationery costs; trace the electoral expenses incurred by the many different actors involved in organizing elections; and attribute those costs to voting channels, which allowed us to compare cost-effectiveness. The use of TD-ABC allowed us to expose the most resource-demanding activities and present new data on electoral costs, collected through multiple sources of information, including onsite electoral observation, interviews, analysis of electoral legislation and the internal instructions for electoral administration, national and local electoral budgets, procurement contracts, and time stamps in internet voting systems.
The use of BPMN models and allocation of resources to voting channels allowed us to analysing how electoral processes have been redesigned since the introduction of new voting channels (for example internet voting). By calculating costs per ballot per voting channel, we have shed new light on electoral administration and on the use of resources. For instance, the introduction of internet voting as an additional voting channel (provided that there is a take-up by voters) can result in unused capacities and reduced cost-effectiveness for other voting channels, because their usage will decrease.
Using observation as one of the main methods for collecting data helped us to overcome the methodological challenges which exist in the field of electoral costs: principally limited access to data on election costs and the lack of clear expenditure tracking. Therefore our research can be replicated in many countries and contexts where observation at different stages of the electoral process is not prohibited by law. In the same vein, the proposed methodology and model could be applied to different case studies with minor adjustments to the context, taking into consideration that the results of case studies in terms of cost per ballot will be context-dependent and should only be generalized with caution.
We need to point out some limitations. First, even though the case study took place in a small country, a much larger number of researchers/observers would have been required for election day monitoring and observation in order to reassure us that we were not missing any local or contextual specificity that might involve unusual costs (Krimmer & Volkamer, Citation2006). The differences in local contexts might not have big repercussions in the final calculation of costs but, in pursuit of precision and accuracy, wider observational fieldwork would be useful.
Second, we encountered a few problems regarding the availability of data. Some costs related to internet voting were not available publicly due to security issues. Therefore the willingness of the authorities responsible to provide researchers access to original documents, such as time stamps for internet voting systems, acquisition contracts and procurement contracts covered by other institutions besides the National Electoral Commission (as was the case with Estonia), was of critical importance for this research. Due to the co-operation with the National Electoral Commission of Estonia and other actors involved we managed to overcome this difficulty. However, this issue should be taken into consideration before embarking on similar research in other administrations.
Further research
Future lines of research would usefully include, first, the use and refinement of our method in different elections and contexts to compare the results. Second, extending our method to cover wider time periods of the electoral cycle and to calculate electoral costs as a whole; the goal being to create a standardized calculation system that could be implemented internationally. Third, it would be useful to the reflection on the impact that cost distribution can have for the administration of elections, for example how to increase cost-efficiency without losing voters, or how electoral modernization impacts costs.
Acknowledgements
This research was funded by the Estonian Research Council (PUT 1361), by Tallinn University of Technology Startup Funding for DigiGovLab (BVH2), and by the European Commission (OpenGovIntelligence H2020 Grant 693849). We would like to thank to the State Electoral Office of Estonia for supporting our project, Wolfgang Drechsler for his valuable feedback, Breck Shuyler and Radu Antonio Serrano for their collaboration in the BPMN modelling, Jorge Lheureux de Freitas for his support in the collection of data and David Jiménez Guillemat for his support with graphic design. Finally, we are grateful to Public Money & Management’s reviewers for their helpful comments.
Disclosure statement
No potential conflict of interest was reported by the author(s).
References
- Attaran, M. (2004). Exploring the relationship between information technology and business process re-engineering. Information & Management, 41(5), 585–596. https://doi.org/10.1016/S0378-7206(03)00098-3
- Babad, Y. M., & Balachandran, B. V. (1993). Cost driver optimization in activity-based costing. The Accounting Review, 68(3), 563–575. https://doi.org/10.2307/248201
- Barrat Esteve, J., Castellà Roca, J., Gascó, M., Duenas-Cid, D., Ariño, L., & Martínez, R. (2018). In J. Barrat Esteve (Ed.), Votacions electròniques: Una eina de gestió pública per a la millora de la qualitat democràtica i la participació política. Barcelona: Escola d’Administració Pública de Catalunya. https://doi.org/10.2436/10.8030.03.13
- Becker, J., Algermissen, L., Niehaves, B., & Delfmann, P. (2005). Business process reference models for reorganizing public administrations - A case study. In K. Andersen, A. Grönlund, R. Traunmüller, & M. Wimmer (Eds.), Workshop and poster proceedings of the fourth international EGOV conference 2005 (pp. 134–142). Copenhagen: Universitätsverlag Rudolf Trauner.
- Brown, R., Myring, M., & Gard, C. (1999). Activity-Based costing in government: Possibilities and pitfalls. Public Budgeting & Finance, 19(2), 3–21. https://doi.org/10.1046/j.0275-1100.1999.01160.x
- Buckley, J. (2003). E-service quality and the public sector. Managing Service Quality, 13(6), 453–462. https://doi.org/10.1108/09604520310506513
- Chowdhury, A. (2017). Cost of voting: Estimating the impact of online voting on public finances. London.
- Clark, A. (2014). The cost of elections: Money well spent? Political Insight, 5(3), 16–19. https://doi.org/10.1111/2041-9066.12069
- Clark, A. (2019). The cost of democracy: The determinants of spending on the public administration of elections. International Political Science Review, 40(3), 354–369. https://doi.org/10.1177/0192512118824787
- Codagnone, C. (2007). ‘Measuring E-Government: Reflections from eGEP measurement framework experience. European Review of Political Technologies, 4, 89–106.
- Codagnone, C., & Boccardelli, P. (2006). Measurement framework: Final version, e-government economics project. Brussels.
- Codagnone, C., & Cilli, V. (2006). No expenditure study final version, eGEP project for the european commission. Brussels.
- Colomer, J. M. (1991). Benefits and costs of voting. Electoral Studies, 10(4), 313–325. https://doi.org/10.1016/0261-3794(91)90023-L
- Cooper, R., & Kaplan, R. S. R. S. (1992). Activity-Based systems: Measuring the costs of resource usage. Harvard Business Review, 6(3), 96–103. Retrieved from http://search.proquest.com/openview/8040ad6739806645ffcbf8977e7bb6bf/1?pq-origsite=gscholar.
- De Araújo, J. (2001). Improving public service delivery: The crossroads between NPM and traditional bureaucracy. Public Administration, 79(4), 915–932. https://doi.org/10.1111/1467-9299.00286
- Downs, A. (1957). An economic theory of political action in a democracy. The Journal of Political Economy, 65(2), 135–150. https://doi.org/10.1017/CBO9781107415324.004 doi: 10.1086/257897
- Drechsler, W. (2004). The Estonian E-voting laws discourse : Paradigmatic benchmarking for central and eastern Europe. NISPAcee Occasional Papers in Public Administration and Public Policy, V(2), 11–17.
- Electoral Reform Society. (2002). Elections in the 21st century: from paper ballot to e-voting the independent commission on alternative voting methods. London. https://doi.org/0 903291 22 3.
- Ernst & Ernst. (1979). Election administration Volume III: Costing Elections, III.
- Flyvbjerg, B. (2006). Five misunderstandings about case-study research. Qualitative Inquiry, 12(2), 219–245. https://doi.org/10.1177/1077800405284363
- Garcia, J. A., Mistry, B., Hardy, S., Fracchia, M. S., Hersh, C., Wentland, C., … Hartnick, C. J. (2017). Time-driven activity-based costing to estimate cost of care at multidisciplinary aerodigestive centres. Laryngoscope, 127(9), 2152–2158. https://doi.org/10.1002/lary.26354
- Goodman, N., & Stokes, L. C. (2016). Reducing the cost of voting: An empirical evaluation of internet voting’s effect on turnout. SSRN Electronic Journal, https://doi.org/10.2139/ssrn.2849167
- Gronke, P., Galanes-Rosenbaum, E., & Miller, P. A. (2007). Early voting and turnout. PS - Political Science and Politics, 40(4), 639–645. https://doi.org/10.1017/S1049096507071028
- Grover, V., Jeong, S. R., Kettinger, W. J., & Teng, J. T. C. (1995). The implementation of business process re-engineering. Journal of Management Information Systems, 12(1), 109–144. https://doi.org/10.1080/07421222.1995.11518072
- Gunasekaran, A., & Nath, B. (1997). The role of information technology in business process re-engineering. International Journal of Production Economics, 50(2–3), 91–104. doi: 10.1016/S0925-5273(97)00035-2
- Harada, M., & Smith, D. M. (2014). You have to pay to play: Candidate and party responses to the high cost of elections in Japan. Electoral Studies, 36, 51–64. https://doi.org/10.1016/j.electstud.2014.06.011
- Haspel, M., & Gibbs Knotts, H. (2005). Location, location, location: Precinct placement and the costs of voting. Journal of Politics, 67(2), 560–573. https://doi.org/10.1111/j.1468-2508.2005.00329.x
- James, T. S., & Jervier, T. (2017). The cost of elections: The effects of public sector austerity on electoral integrity and voter engagement. Public Money and Management, 37(7), 461–468. https://doi.org/10.1080/09540962.2017.1351834
- Johnston, R., & Pattie, C. (2008). How much does a vote cost? Incumbency and the impact of campaign spending at English general elections. Journal of Elections, Public Opinion and Parties, 18(2), 129–152. https://doi.org/10.1080/17457280801987868
- Kaplan, R. S., & Anderson, S. R. (2007). Time-driven activity-based costing: A simpler and more powerful path to higher profits. Harvard Business School Press Books, 82, 266. https://doi.org/10.1080/09638180701814171
- Kersting, N., & Baldersheim, H. (2004). Electronic voting and democracy. New York: Palgrave - MacMillan. https://doi.org/10.1057/9780230523531
- Krimmer, R. (2012). The evolution of e-voting: Why voting technology is used and how it affects democracy. Tallinn: TUT Press.
- Krimmer, R., Triessnig, S., & Volkamer, M. (2007). The development of remote e-voting around the world: A review of roads and directions. In A. Alkassar, & M. Volkamer (Eds.), E-Voting and identity (pp. 1–15). Bochum: Springer. https://doi.org/10.1007/978-3-540-77493-8_1
- Krimmer, R., & Volkamer, M. (2006). Observing Threats to Voter’s Anonymity: Election Observation of Electronic Voting (Working Paper Series on Electronic Voting and Participation No. 01/2006). Vienna. Retrieved from https://www.e-voting.cc/en/expertise/publications/working-paper-studies/.
- Krimmer, R., & Wendt, F. (2010). Costs of Electronic Voting: An Overview. (Working Paper Series on Electronic Voting and Participation). Vienna.
- Lau, E. (2006). E-Government and the drive for growth and equity. Cambridge. Retrieved from https://www.belfercentre.org/sites/default/files/legacy/files/lau-wp.pdf.
- Laviana, A. A., Ilg, A. M., Veruttipong, D., Tan, H. J., Burke, M. A., Niedzwiecki, D. R., … Saigal, C. S. (2016). Utilizing time-driven activity-based costing to understand the short- and long-term costs of treating localized, low-risk prostate cancer. Cancer, 122(3), 447–455. https://doi.org/10.1002/cncr.29743
- Li, Q., Pomante, M. J., & Schraufnagel, S. (2018). Cost of voting in the American states. Election Law Journal: Rules, Politics, and Policy, 17(3), 234–247. https://doi.org/10.1089/elj.2017.0478
- Lijphart, A. (1998). The Problem of Low and Unequal Voter Turnout – and What We Can Do About It (Political Science Series No. 54). Vienna.
- López Pintor, R., & Gratschew, M. (2002). Voter turnout since 1945: A Global Report. Stockholm: IDEA Institute for Democracy and Electoral Assistance.
- López-Pintor, R., & Fisher, J. (2005). Getting to the core. A global survey on the cost of registration and elections. New York: United Nations Development Programme.
- Mitchell, F. (2002). Implementing management innovations, lessons learned from activity based costing in the US automobile industry (Book). European Accounting Review. Retrieved from http://0-search.ebscohost.com.cataleg.uoc.edu/login.aspx?direct=true&AuthType=ip,cookie,url,uid&db=bth&AN=9344784&lang=es&site=ehost-live
- Mohr, Z. (2017). Cost accounting in government: Theory and applications. New York: Routledge.
- Montjoy, R. S. (2010). The changing nature. and costs. of election administration. Public Administration Review, 70(6), 867–875. https://doi.org/10.1111/j.1540-6210.2010.02218.x
- Mozaffar, S., & Schedler, A. (2002). The comparative study of electoral governance—introduction. International Political Science Review, 23(1), 5–27. https://doi.org/10.1177/0192512102023001001
- Niemi, R. G. (1976). Costs of voting and nonvoting. Public Choice, 27(1), 115–119. https://doi.org/10.1007/BF01718955
- Olshagen, C. (1991). Prozeßkostenrechnung, aufbau und einsatz. Wiesbaden: Springer.
- O’Neill, P., & Sohal, A. S. (1999). Business process re-engineering a review of recent literature. Technovation, 19(9), 571–581. https://doi.org/10.1016/S0166-4972(99)00059-0
- Oostveen, A.-M., & Van den Besselaar, P. (2004). Internet voting technologies and civic participation: The users’ perspective. Javnost/The Public Journal of the European Institute for Communication and Culture, XI(1), 61–78. https://doi.org/10.1080/13183222.2004.11008847
- Petithomme, M. (2012). Second-order elections, but also ‘low-cost’ campaigns? National parties and campaign spending in european elections: A comparative analysis. Perspectives on European Politics and Society, 13(2), 149–168. https://doi.org/10.1080/15705854.2012.675650
- Solvak, M., & Vassil, K. (2016). E-voting in estonia: Technological diffusion and other developments over ten years. Tartu: Johan Skytte Institute of Political Studies.
- Stouthuysen, K., Schierhout, K., Roodhooft, F., & Reusen, E. (2014). Time-driven activity-based costing for public services. Public Money and Management, 34(4), 289–296. https://doi.org/10.1080/09540962.2014.920202
- Uygur, S. (2009). Prozessmodellierung und -analyse der Hochschülerinnen- und Hochschülerschaftswahlen. WU Vienna University of Economics and Business.
- Van Der Aalst, W. M. P., La Rosa, M., & Santoro, F. M. (2016). Business process management: Don’t forget to improve the process!. Business and Information Systems Engineering, 58(1), 1–6. https://doi.org/10.1007/s12599-015-0409-x
- Xenakis, A., & Macintosh, A. (2004a). Levels of difficulty in introducing e-voting. In R. Traunmüller (Ed.), Electronic government: Third international conference, EGOV 2004 zaragoza, spain, august 30 - september 3, 2004 proceedings (pp. 116–121). Berlin: Springer-Verlag. Retrieved from https://link.springer.com/content/pdf/10.1007%2Fb99836.pdf.
- Xenakis, A., & Macintosh, A. (2004b). Procedural security analysis of electronic voting. In Proceedings of the 6th international conference on electronic commerce (pp. 541–546). New York, NY, USA: ACM. https://doi.org/10.1145/1052220.1052288
- Xenakis, A., & Macintosh, A. (2006). A generic re-engineering methodology for the organized redesign of the electoral process to an e-electoral process. In R. Krimmer (Ed.), EVOTE’06, 2nd international workshop on electronic voting (pp. 119–130). Bregenz: Gesellschaft für Informatik. https://doi.org/978-3-88579-180-3
- Xenakis, A., Macintosh, A., & Centre, I. T. (2005). Using business process re-engineering (BPR) for the effective administration of electronic voting. Business, 3(2), 91–98.
- Yin, R. K. (2014). Cast study research: Design and methods. books.google.fr. https://doi.org/10.1017/CBO9780511803123.001