
 ?Mathematical formulae have been encoded as MathML and are displayed in this HTML version using MathJax in order to improve their display. Uncheck the box to turn MathJax off. This feature requires Javascript. Click on a formula to zoom.
ABSTRACT
The effect of biochar (BC) addition on NOx gas emissions was investigated from a calcareous soil. Application rates of zero (BC0), 1 (BC1), 2 (BC2), 5 (BC5), and 10 (BC10) percent weight/weight were used. The NOx emission flux was measured in a dynamic flux chamber. The flux was generally higher in BC0 than in the amended plots. The total NOx emission from BC1, BC2, BC5, and BC10 fell by 50.3, 75.3, 80.4, and 79.6%, respectively, relative to BC0. The emission flux from the BC5 showed a minimum average of 21.1 ± 13.5 μg N/(m2•h) for NO, −0.81 ± 1.31 μg N/(m2•h) for NO2, and 20.6 ± 13.8 μg N/(m2•h) for NOx. By comparison, the measured maximum average emission flux from the BC0 was 107.2 ± 30.98 μg N/(m2•h) for NO, −2.31 ± 2.56 μg N/(m2•h) for NO2, and 105.3 ± 45.3 μg N/(m2•h) for NOx. The results indicate that biochar amendment can potentially reduce NOx emissions.
Introduction
The application of nitrogen fertilizer to soil is key to promoting and sustaining agricultural production [Citation1]. A significant portion of fertilizer N is lost by leaching [Citation2], gas emissions [Citation3,Citation4] and soil erosion [Citation5]. Such losses have a negative effect on farmers’ income as well as on the immediate environment.
Gaseous N, in the form of NH3, NO, N2O and dinitrogen (N2) can be lost by volatilization, nitrification, and denitrification. Nitrogen oxides (NOx) gas, comprising NO and NO2, play a key role in the photochemical synthesis of tropospheric ozone (O3) [Citation6]. Since the emission of NOx from soil is largely mediated by soil microbes, the process is subject to such environmental variables as soil pH, soil water content, temperature, and the availability of inorganic nitrogen [Citation7,Citation8].
Recent studies indicate that the soil NOx flux can be on a par with that from fossil fuel combustion [Citation9–Citation11]. This is especially the case in rural areas, where the agricultural soils emission often dominates the total flux [Citation12–Citation14]. Therefore, it is imperative to find a low-cost and high-efficiency method for reducing soil N loss.
Biochar is produced by heating carbonaceous organic matter under oxygen-limited conditions [Citation15,Citation16]. Because of its great surface area, high microporosity and other physiochemical properties depending on the biomass feedstock and the pyrolysis conditions [Citation17–Citation20], biochar is very effective in sorption nutrient elements in soil. Biochar amendment to soil increases N retention [Citation21], enhances N use efficiency [Citation22] and promotes agricultural production [Citation23,Citation24], recovers excess N [Citation25], and reduces N leaching [Citation26,Citation27]. Furthermore, the addition of biochar input to the soil would be expected to affect soil nitrification and denitrification process controlling the release of soil nitrogen gas [Citation28,Citation29].
Biochar application to soil for carbon sequestration as well as agricultural and environmental sustainability has attracted much interest [Citation30–Citation33]. Little is known, however, about the effects of biochar addition on NOx emission [Citation26]. Furthermore, the focus of research has been directed on highly weathered soils of the humid tropics, acidic forest soils [Citation34,Citation35], mollisol [Citation36], temperate soil [Citation37] and agricultural soil [Citation38]. On the other hand, the emission of greenhouse gases, such as CO2, CH4, N2O and NH3 under both laboratory and field conditions is well documented although the results have not always been consistent [Citation28,Citation29,Citation39–Citation43]. However, the factors controlling trace gas emissions from biochar-amended soils are not well understood, especially with respect to calcareous agricultural soils [Citation44–Citation46]. Therefore, understanding the impact of biochar addition on the flux of trace gases in agricultural soils is of great significance for the application of biochar. To test the hypothesis that biochar addition to calcite-rich soils can reduce NOx emission, we have measured the fluxes of NOx from a calcareous sandy loam in Southwest China. By varying the rate of biochar application, we would obtain an insight into the factors controlling NOx emissions, and deduce an optimum rate of amendment.
Materials and methods
Field experiments site and biochar preparation
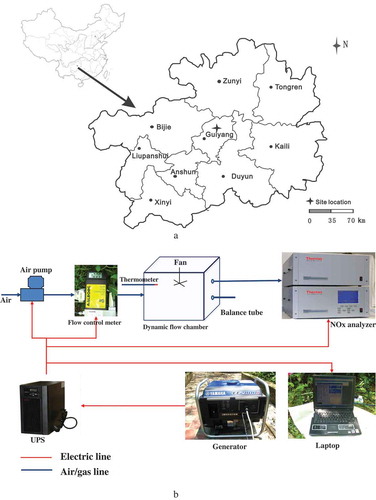
The field experiments were carried out on a calcareous sandy loam (N 27°0ʹ40.20”, E 107°2ʹ46.95”, 1118°m) located in the karst region of Kaiyang County, Guiyang City, Guizhou Province, Southwest China ()). The upland site has a mean annual rainfall of 926–1419 mm and a mean annual temperature of 10.6–15.3°C for the last 30 years. Some properties of the soil are listed in .
Table 1. Some soil properties before and after biochar addition.
Figure 1. Map of the location of the study (a) and field observation experimental design (b).
The biochar was obtained by pyrolysis at 550°C of crop stalks, mainly composed of rapeseed (Brassica campestris L.) and maize (Zea mays L.) straw. The biochar produced has a pH of 10.3 ± 0.2, and its C, N, NH4+ and NO3− contents are 80% ± 3%, 1.2% ± 0.05%, 1.0 ± 0.02 mg°kg−1 and 8.6 ± 0.3 mg°kg−1, respectively. The calcareous sandy loam has a pH of 8.23 ± 0.21, while its C, N, NO3− and NH4+ contents are 4.3% ± 0.1, 0.2% ± 0.01, 5.26 ± 0.43 mg°kg−1 and 3.67 ± 0.17 mg°kg−1, respectively.
Experimental design
The area of each experimental plot was 2 × 4 m2. A total of five treatments were used, each of which had three replicates: (1), plot without biochar (control plot); (2), plot amended with biochar at a rate of 1% (w/w); (3); plot amended with biochar at a rate of 2% (w/w); (4), plot amended with biochar at a rate of 5% (w/w); and (5), plot amended with biochar at a rate of 10% (w/w).
The selected field plots have been planted with maize (Zea mays L.), rapeseed (Brassica napus. L.), and vegetables for more than 10 years, being cultivated and managed by local farmers using traditional methods. Water is supplied by atmospheric precipitation, while the cropping system is one of rotating rapeseed and maize (rapeseed-maize).
The field experiment was done by mixing the top 10 cm soil with biochar at an application rate of 1, 2, 5, and 10% w/w in July 2010 prior to planting maize. The NOx emission flux was monitored from 14 September, 2010 to 7 September, 2011. The field gas sampling was performed once every 7 or 20 days depending on the season. NOx flux was measured from 11:00 a.m. to 6:00 p.m. The sampling time was chosen because fluxes at the stated times approached the average of five diurnal measurements (from 7:00 a.m. to 7:00 p.m.). shows specific crops, fertilizer types and amounts applied.
Table 2. Specific field crops, types and fertilization events according to the local cultivation habits.
Determination of soil variables
Soil samples were taken from the top 10 cm of the soil profile near the chamber using a cylinder ring sampler (100 cm3). Soil bulk density for the 0−10cm depth (n = 10) was determined using the core method. Soil pH was obtained by mixing air-dried soil with deionized water at a 1:5 (w/w) ratio, and measuring with a pH meter. Soil water content was calculated from the difference in weight between the fresh and oven-dried (105°C) soil, divided by the oven-dried soil weight. The contents of ammonium (NH4+) and nitrate (NO3−) were obtained by extracting the soil with 2 mol L−1 KCl, and measuring the extracts by colorimetry [Citation47]. The determination of soil organic matter was based on the Walkley-Black chromic acid wet oxidation method [Citation48]. Total carbon (TC) and total nitrogen (TN) contents of the soil were determined with an elemental analyzer (PE2400-II, Perkin, American).
Measurements of NOx fluxes
NOx fluxes were measured using a dynamic flux chamber (DFC) method similar to that used previously by Wang et al [Citation8] ()). Net fluxes from the soils were obtained by comparing the flux in the sampling chamber with that in the reference chamber. NOx fluxes (F), expressed as μg N/(m2· h), were calculated using the following equation:
where C (μg/m3) is the NOx concentration in the outflow air of the chamber, C0 is the NOx concentration in the inflow air (μg/m3), which is drawn at the height 1.5 m above the ground, Q is the flow rate of the inflow air (m3/h), and A (m2) is the area covered by the chamber. C was determined using the average concentration measured during a 20-min period after the NOx concentration had reached a dynamic equilibrium in the chamber.
Statistical analysis
The statistical software package SPSS 19.0 (Chicago, IL, USA) was used for descriptive statistics, One-way ANOVA, linear regression, correlation analysis and paired sample T-test of NOx fluxes in different treatments. Descriptive statistics were used to describe the basic features of the soil properties after biochar addition. One-way ANOVA was used to test the difference between multiple means, and determine whether the different rates of biochar application have a significant influence on the release of NOx gas. Linear regression and correlation analysis were used to correlate different treatments with soil properties. Paired sample T-test was used to analyze the difference between BC0 and BC1, BC2, BC5 and BC10 in terms of NO and NOx emission fluxes. The statistical software package SigmaPlot 12.5 (SAS, Cary, NC) was used for creating statistical graphs.
Results and discussion
Biochar effect on soil properties
In agreement with previous measurements [Citation8], the correlation between NOx fluxes and soil temperature was significant (P < 0.05) for all five plots (). This finding may be explained in terms of the effect of biochar addition on nitrification, denitrification, and NOx gas emissions [Citation42,Citation49,Citation50]. These microbially-controlled processes are influenced by many factors, including soil water content, temperature, ammonium and nitrate concentrations and pH [Citation51]. Among them, soil temperature is considered to be of major importance because of its effect on microbial activity and gas diffusion rates [Citation8,Citation11]. With an increase in biochar application rate, the soil pH is not significantly different between BC0, BC1 and BC2 treatment. However, there is a significant difference when biochar addition ratio is high in BC5 and BC10 (). On the other hand, soil bulk density decreases as the biochar application rate increases. As a result, we would expect soil compactness to decrease and soil aeration to increase. also shows that the total carbon and total nitrogen contents of the soil increase with biochar application rate.
Table 3. Spearman correlation coefficients between soil NOx gas fluxes and soil temperature (in 5 cm depth), soil water content, NO3− and NH4+.
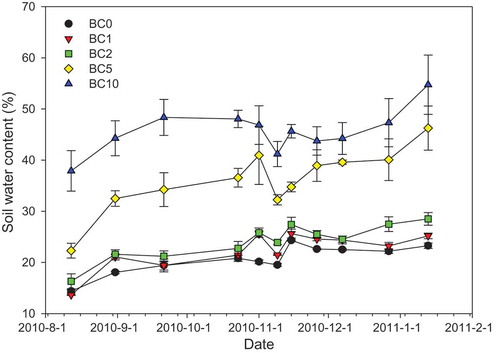
As shown in , soil water content changes from 22.3% for the BC0 (control) plot in August to 54.7% for the BC10 plot in December. Although water content can fluctuate greatly between seasons, the addition of biochar leads to a significant (P < 0.01) increase in water holding capacity (WHC). This observation is related to the high capacity of biochar for retaining water in its microporous structure [Citation40]. Furthermore, the presence of hydrophilic groups in, and the extensive surface area of, biochar are conducive to water uptake and retention [Citation52]. Because of its small particle size, biochar may further cause the partial or total blockage of soil pores, decreasing water infiltration while increasing WHC [Citation53].
Figure 2. Soil water contents at varying biochar application rates. Paired sample T-test statistical analysis of different treatments revealed that there was a significant difference in each category (P < 0.01).
shows the fluctuation in atmospheric precipitation and temperature in soil (to 5cm depth), surface, chamber, and atmosphere over the experimental period. The variation in soil NO3− and NH4+ concentrations for the different plots during the same period shows a similar trend (). These observations indicate that temperature is the key factor since temperatures in summer are higher than those measured in other seasons. Biochar addition increased the average soil NO3−-N content by 43.7, 50.2, 71.9 and 186 in the BC1, BC2, BC5, and BC10 plots, respectively. On the other hand, soil NH4+ concentrations first increased and then decreased as the rate of biochar application increased. The correlation between biochar addition and NH4+ concentration, however, was not significant (P > 0.05). Furthermore, there was a significant increase (P < 0.01) in soil water content with a rise in the rate of biochar application ().
Figure 3. Fluctuation of temperature and rainfall during the observation period.
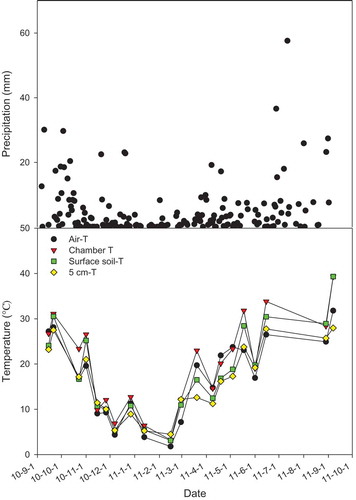
Figure 4. Variations of soil NO3− (a) and NH4+ (b) at different plots during the whole measurement period. Symbols may cover error bars. Paired sample T-test statistical analysis revealed that there was a significant difference between BC0 and any other treatment in NO3− (P < 0.01), but there was no significant difference between BC0 and other treatment in NH4+.
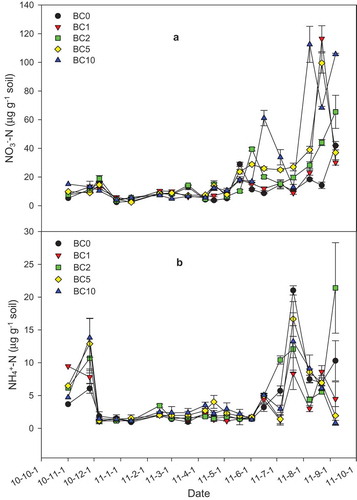
There is also a good correspondence between mineral N concentration and urea application ( and ). The highest NH4+-N content (27.7 mg°kg−1 soil) in the control plot was measured in July 2011 following maize planting and urea application, presumably as a result of urea hydrolysis. Earlier, Rochette et al have reported that subsurface banding of urea can greatly enhance ammonia (NH3) emission due to a localized increase in soil NH4+ concentration and pH [Citation54]. The maximum NO3− concentration (116.5°μg g−1 soil) was measured for the BC10 plot in August 2011 indicating a lag with respect to soil ammonium nitrogen. This observation suggests biochar addition promotes nitrification.
The capacity of biochar for sorbing soil mineral nitrogen while reducing nitrogen dissolution and migration, in dependence of feedstock and pyrolysis conditions, has been the subject of many investigations [Citation23,Citation55–Citation60]. Besides improving soil aeration, biochar application reduces anaerobic microbial activity and inhibits denitrification [Citation61]. By increasing soil pH, biochar addition also enhances the activity of NO-reducing enzymes as well as N2 formation and ammonia volatilization [Citation62].
Effects of biochar and n fertilizer on NOx emissions
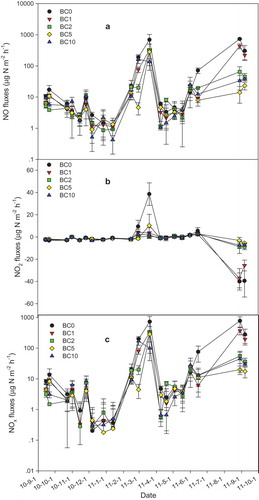
The variation in NO, NO2, and NOx emission fluxes from different plots were illustrated in , while the range and average value of these emissions are tabulated in . The minimum average emission of NO (21.1 ± 13.5°μg N/(m2•h)), NO2 (−0.81 ± 1.31°μg N/(m2•h)), and NOx (20.6 ± 13.8°μg N/(m2•h)) was measured in the BC5 plot. The maximum average emission of NO (107.2 ± 30.98°μg N/(m2•h)), NO2 (−2.31 ± 2.56°μg N/(m2•h)), and NOx (105.3 ± 45.3°μg N/(m2•h)) was measured in the BC0 (control) plot following N fertilization. Addition of biochar decreased NOx emissions compared to the BC0 plot (). Biochar addition depressed NOx emissions by 50.3% to 80.4%, depending on annual application rate. One-way ANOVA analysis (LSD) indicates a significant difference (P < 0.05) in NO and NOx emission fluxes between BC0 and the treated plots except for BC1.
Table 4. Variations of NO/NO2/NOx emission fluxes in different treatments.
Figure 5. Variations in NO (a), NO2 (b) and NOx (c) fluxes at different plots during the whole measurement period. Symbols may cover error bars. Paired sample T-test statistical analysis indicated that there was a significant difference between BC0 and BC1, BC2, BC5 and BC10 in NO and NOx emission fluxes (P < 0.05).
The interactions between biochar, N fertilizer, greenhouse gas emissions, and soil type have been reported by several investigators [Citation39,Citation63,Citation64]. Application of N fertilizer causes an initial sharp increase in NO3− and NH4+ as well as NOx emissions [Citation63]. Higher nitrogen oxide gas emissions have been reported with urea- and ammonium-based fertilizers than with nitrate-based counterparts under unsaturated soil conditions [Citation65]. To elucidate the influence of NO3− and NH4+ on NOx emissions, the correlations between NOx fluxes and NO3− and NH4+ were assessed for all plots. In the present investigation the correlation between NOx fluxes and soil NO3− was significant (P < 0.05) but no significant difference was observed between NOx fluxes and NH4+ (). Although NOx emission flux peaked during the fertilization in February 2011, there was no change in soil mineral nitrogen content. This finding may be ascribed to NOx emission or NH3 volatilization [Citation66,Citation67]. Because the soil is alkaline soil (pH > 8.0), most of the fertilizer N may not enter into the soil after application and probably emission to the atmosphere as a gaseous loss in a short period. At pH levels of 8.0 or above, volatilization of ammonia gas can cause large losses of nitrogen. Several studies have reported the short-lived peaks in NOx flux following fertilization [Citation63,Citation68]. In an early study, Fenn and Kissel found that ammonia was rapidly volatilized from NH4-N salts applied to the surface of a calcareous soil [Citation69]. An increase in pH at the soil surface following biochar addition would also induce NH3 volatilization. Such a process is consistent with the finding that significant NOx emission occurred after fertilizer application although there was no change in soil mineral nitrogen.
The process of nitrogen transformation in the soil can be expressed in terms of the hydrolysis of urea (step 1; Equation (2)) followed by ammonification (step 2; Equation (3)) and nitrification (step3; Equations (4) and (5)):
The appearance of two NOx emission peaks in March and September 2011 is apparently related to two fertilization events during this period (). This observation accords with previous findings [Citation63,Citation69–Citation71] that nitrogen fertilizer (urea) addition promotes rapid but short-lived emissions of NOx [Citation72]. The NOx flux emission was high for the control plot and low for the BC5 plot, indicating that biochar can immobilize soil mineral nitrogen [Citation42] and suppress N2O emissions [Citation73].
The following mechanisms have been proposed to account for the decrease of NOx emissions: (1), the addition of biochar adsorbs NH4+ and NO3− which leads to a reduction of the soil inorganic-N pool [Citation74]; (2), The electron-accepting sites on the surface of biochar can increase the redox potential of the soil while reducing the NO source capacity of the soil, and (3), The microorganisms immobilize the available soil N while inhibiting denitrification, thereby reducing the NO source capacity of the soil., and (4), sorption of soil NO, N2O, and CH4 by biochar
Correlation between biochar application rate and NOx emissions
Different application rates of biochar could result in different aerobic and/or anaerobic conditions. Increased soil aeration from biochar addition could reduce denitrification. Dry aerobic conditions are conducive to nitrification, while anaerobic conditions promote denitrification [Citation75]. However, there is a noted shortage of data about the dose-response of biochar application to soil lacks systematic assessment [Citation45,Citation76,Citation77]. Within a certain range of application rates, a change in soil properties can mitigate NOx emissions by increasing nitrogen immobilization. Spokas et al have reported that the addition of 2–10% w/w biochar to soil at field capacity can suppress net N2O production but the data were not a statistically significant [Citation19]. In the present instance, the addition of 2, 5, and 10% w/w biochar led to a significant reduction (P < 0.05) in NOx emission rates. In this regard, the BC5 plot gave the optimum (P < 0.05) cost-effective result from economic point of view.
For calcareous soils, a lower or higher application rate is therefore not recommendable. Application rates higher than 5% w/w would increase soil pH and NH3 gas emission, while a lower rate would not provide enough biochar to immobilize soil mineral nitrogen. This suggestion accords with the observation that the curves relating application rates to average NOx emission fluxes show a declining trend (). In addition, the priming effect of fertilizer application without biochar would be more pronounced than in the presence of biochar [Citation78,Citation79]. That the application of 5% w/w biochar to agricultural calcareous soils could significantly reduce NOx emission fluxes is in keeping with the results of studies regarding the biological response of, and N2O emissions from, sandy soils treated with biochar [Citation61,Citation80].
Conclusions
The present investigation indicates that biochar addition to subtropical calcareous soils can reduce NOx emissions, and increase soil pH, nitrate N, and water holding capacity but decrease soil bulk density. Fertilization is the main factors affecting the NOx emissions, overwhelming the effects of temperature and biochar application rates. Consider the application of biochar from economic point of view, applying of 5% w/w biochar is optimum for the calcareous agricultural soil in Southwest China. Because of its alkaline reaction, the soil can lose some of the applied fertilizer N through gaseous NH3 emission. Biochar addition can potentially mitigate N losses within agroecosystems. Future studies should focus on the relationship between microbial activity and NOx gas emission in a range of soils.
Disclosure statement
No potential conflict of interest was reported by the authors.
Additional information
Funding
Related Research Data
References
- Tilman D, Cassman KG, Matson PA, et al. Agricultural sustainability and intensive production practices. Nature. 2002;418(6898):671–677.
- Raun WR, Johnson GV. Improving nitrogen use efficiency for cereal production. Agron J. 1999;91(3):357–363.
- Li D. Emissions of NO and NH3 from a typical vegetable-land soil after the application of chemical N fertilizers in the Pearl river delta. PloS one. 2013;8(3):e59360.
- Zhang YY, Liu JF, Mu YJ, et al. Emissions of nitrous oxide, nitrogen oxides and ammonia from a maize field in the North China plain. Atmos Environ. 2011;45(17):2956–2961.
- Fu B, Meng Q, Qiu Y, et al. Effects of land use on soil erosion and nitrogen loss in the hilly area of the Loess Plateau, China. Land Degrad Dev. 2004;15(1):87–96.
- Atkinson R. Atmospheric chemistry of VOCs and NOx. Atmos Environ. 2000;34(12–14):2063–2101.
- Ludwig J, Meixner FX, Vogel B, et al. Soil-air exchange of nitric oxide: an overview of processes, environmental factors, and modeling studies. Biogeochemistry. 2001;52(3):225–257.
- Wang B, Lee X, Theng BK, et al. Diurnal and spatial variations of soil NOx fluxes in the northern steppe of China. J Environ Sci. 2015;32:54–61.
- Delmas R, Serça D, Jambert C. Global inventory of NOx sources. Nutr Cycl Agroecosys. 1997;48(1):51–60.
- Zheng XH, Huang Y, Wang YS, et al. Effects of soil temperature on nitric oxide emission from a typical Chinese rice-wheat rotation during the non-waterlogged period. Global Change Biol. 2003;9(4):601–611.
- Passianoto CC, Ahrens T, Feigl BJ, et al. Diurnal changes in nitric oxide emissions from conventional tillage and pasture sites in the Amazon basin: influence of soil temperature. Plant Soil. 2004;258(1–2):21–29.
- Yienger JJ, Levy H. Empirical model of global soil-biogenic NOx emissions. J Geophys Res-Atmos. 1995;100(D6):11447–11464.
- Atkins DHF, Lee DS. Spatial and temporal variation of rural nitrogen dioxide concentrations across the United Kingdom. Atmos Environ. 1995;29(2):223–239.
- Hall SJ, Huber D, Grimm NB. Soil N2O and NO emissions from an arid, urban ecosystem. J Geophys Res. 2008;113(G1):1–11.
- Laird DA. The charcoal vision: A win-win-win scenario for simultaneously producing bioenergy, permanently sequestering carbon, while improving soil and water quality. Agron J. 2008;100(1):178–181.
- Cheng CH, Lehmann J. Ageing of black carbon along a temperature gradient. Chemosphere. 2009;75(8):1021–1027.
- Yu X-Y, Ying -G-G, Kookana RS. Reduced plant uptake of pesticides with biochar additions to soil. Chemosphere. 2009;76(5):665–671.
- Lehmann J, Pereira Da Silva J, Steiner C, et al. Nutrient availability and leaching in an archaeological Anthrosol and a Ferralsol of the Central Amazon basin: fertilizer, manure and charcoal amendments. Plant Soil. 2003;249(2):343–357.
- Spokas K, Koskinen W, Baker J, et al. Impacts of woodchip biochar additions on greenhouse gas production and sorption/degradation of two herbicides in a Minnesota soil. Chemosphere. 2009;77(4):574–581.
- Lehmann J, Joseph S. Biochar for environmental management:science, technology and implementation. London, UK: Routledge; 2015.
- Steiner C, Glaser B, Geraldes Teixeira W, et al. Nitrogen retention and plant uptake on a highly weathered central Amazonian ferralsol amended with compost and charcoal. J Plant Nutr Soil Sci. 2008;171(6):893–899.
- Zwieten LV, Kimber S, Downie A, et al. A glasshouse study on the interaction of low mineral ash biochar with nitrogen in a sandy soil. Aust J Soil Res. 2010;48(6–7):569–576.
- Hale SE, Alling V, Martinsen V, et al. The sorption and desorption of phosphate-P, ammonium-N and nitrate-N in cacao shell and corn cob biochars. Chemosphere. 2013;91(11):1612–1619.
- Yu X, Tian X, Lu Y, et al. Combined effects of straw-derived biochar and bio-based polymer-coated urea on nitrogen use efficiency and cotton yield. Chem Spec Bioavailab. 2018. DOI:10.1080/09542299.2018.1518730.
- Sarkhot D, Ghezzehei T, Berhe A. Effectiveness of biochar for sorption of ammonium and phosphate from dairy effluent. J Environ Qual. 2013;42(5):1545–1554.
- Güereña D, Lehmann J, Hanley K, et al. Nitrogen dynamics following field application of biochar in a temperate North American maize-based production system. Plant Soil. 2013;365(1–2):239–254.
- Yuan S, Tan Z, Huang Q. Migration and transformation mechanism of nitrogen in the biomass–biochar–plant transport process. Renew Sust Energ Rev. 2018;85:1–13.
- Saarnio S, Heimonen K, Kettunen R. Biochar addition indirectly affects N2O emissions via soil moisture and plant N uptake. Soil Biol Biochem. 2013;58:99–106.
- Cayuela ML, Sanchez-Monedero MA, Roig A, et al. Biochar and denitrification in soils: when, how much and why does biochar reduce N2O emissions? Sci Rep-UK. 2013;3. DOI:10.1038/srep01732
- Lehmann J, Gaunt J, Rondon M. Bio-char sequestration in terrestrial ecosystems–a review. Mitig Adapt Strat Gl. 2006;11(2):395–419.
- Lehmann J. A handful of carbon. Nature. 2007;447(7141):143–144.
- Inyang MI, Gao B, Yao Y, et al. A review of biochar as a low-cost adsorbent for aqueous heavy metal removal. Crit Rev Env Sci Technol. 2016;46(4):406–433.
- Steiner C, Teixeira WG, Lehmann J, et al. Long term effects of manure, charcoal and mineral fertilization on crop production and fertility on a highly weathered Central Amazonian upland soil. Plant Soil. 2007;291(1):275–290.
- Lehmann J, Rondon M. Bio-char soil management on highly weathered soils in the humid tropics. Biological approaches to sustainable soil systems. Boca Raton (FL): CRC Press; 2006:517–530.
- DeLuca T, MacKenzie M, Gundale M, et al. Wildfire-produced charcoal directly influences nitrogen cycling in ponderosa pine forests. Soil Sci Soc Am J. 2006;70(2):448–453.
- Rogovska N, Laird DA, Rathke SJ, et al. Biochar impact on Midwestern Mollisols and maize nutrient availability. Geoderma. 2014;230:340–347.
- Rajkovich S, Enders A, Hanley K, et al. Corn growth and nitrogen nutrition after additions of biochars with varying properties to a temperate soil. Biol Fertil Soils. 2012;48(3):271–284.
- Laird DA, Fleming P, Davis DD, et al. Impact of biochar amendments on the quality of a typical Midwestern agricultural soil. Geoderma. 2010;158(3):443–449.
- Wang J, Zhang M, Xiong Z, et al. Effects of biochar addition on N2O and CO2 emissions from two paddy soils. Biol Fertil Soils. 2011;47(8):887–896.
- Karhu K, Mattila T, Bergström I, et al. Biochar addition to agricultural soil increased CH4 uptake and water holding capacity - results from a short-term pilot field study. Agr Ecosyst Environ. 2011;140(1–2):309–313.
- Spokas KA. Impact of biochar field aging on laboratory greenhouse gas production potentials. Glob Change Biol Bioenergy. 2013;5(2):165–176.
- Case SD, McNamara NP, Reay DS, et al. The effect of biochar addition on N2O and CO2 emissions from a sandy loam soil–the role of soil aeration. Soil Biol Biochem. 2012;51:125–134.
- Thangarajan R, Bolan NS, Kunhikrishnan A, et al. The potential value of biochar in the mitigation of gaseous emission of nitrogen. Sci Total Environ. 2018;612:257–268.
- Jeffery S, Verheijen FGA, van der Velde M, et al. A quantitative review of the effects of biochar application to soils on crop productivity using meta-analysis. Agr Ecosyst Environ. 2011;144(1):175–187.
- Quilliam RS, Marsden KA, Gertler C, et al. Nutrient dynamics, microbial growth and weed emergence in biochar amended soil are influenced by time since application and reapplication rate. Agr Ecosyst Environ. 2012;158:192–199.
- Lentz R, Ippolito J. Biochar and manure affect calcareous soil and corn silage nutrient concentrations and uptake. J Environ Qual. 2012;41(4):1033–1043.
- Page AL. Methods of soil analysis. Part 2. Chemical and microbiological properties. Madison (WI): American Society of Agronomy, Soil Science Society of America; 1982.
- Black CA, Evans DD, Dinauer R. Methods of soil analysis. Madison (WI): American Society of Agronomy; 1965.
- Breuer L, Kiese R, Butterbach-Bahl K. Temperature and moisture effects on nitrification rates in tropical rain-forest soils. Soil Sci Soc Am J. 2002;66(3):834–844.
- Joseph SD, Camps-Arbestain M, Lin Y, et al. An investigation into the reactions of biochar in soil. Aust J Soil Res. 2010;48(6–7):501–515.
- Smith K, Thomson P, Clayton H, et al. Effects of temperature, water content and nitrogen fertilisation on emissions of nitrous oxide by soils. Atmos Environ. 1998;32(19):3301–3309.
- Ahmad M, Rajapaksha AU, Lim JE, et al. Biochar as a sorbent for contaminant management in soil and water: A review. Chemosphere. 2014;99:19–33.
- Doerr SH, Shakesby RA, Walsh RPD. Soil water repellency: its causes, characteristics and hydro-geomorphological significance. Earth-Sci Rev. 2000;51(1):33–65.
- Rochette P, Angers DA, Chantigny MH, et al. NH3 volatilization, soil concentration and soil pH following subsurface banding of urea at increasing rates. Can J Soil Sci. 2013;93(2):261–268.
- Clough TJ, Condron LM, Kammann C, et al. A review of biochar and soil nitrogen dynamics. Agronomy. 2013;3(2):275–293.
- Wang B, Lehmann J, Hanley K, et al. Adsorption and desorption of ammonium by maple wood biochar as a function of oxidation and pH. Chemosphere. 2015;138:120–126.
- Yao Y, Gao B, Zhang M, et al. Effect of biochar amendment on sorption and leaching of nitrate, ammonium, and phosphate in a sandy soil. Chemosphere. 2012;89(11):1467–1471.
- Wang B, Lehmann J, Hanley K, et al. Ammonium retention by oxidized biochars produced at different pyrolysis temperatures and residence times. Rsc Adv. 2016;6(48):41907–41913.
- Hollister CC, Bisogni JJ, Lehmann J. Ammonium, nitrate, and phosphate sorption to and solute leaching from biochars prepared from corn stover (L.) and oak wood (spp.). J Environ Qual. 2012;42(1):137–144.
- Angst TE, Patterson CJ, Reay DS, et al. Biochar diminishes nitrous oxide and nitrate leaching from diverse nutrient sources. J Environ Qual. 2013;42(3):672–682.
- Van Zwieten L, Kimber S, Morris S, et al. Influence of biochars on flux of N2O and CO2 from ferrosol. Soil Res. 2010;48(7):555–568.
- Schomberg HH, Gaskin JW, Harris K, et al. Influence of biochar on nitrogen fractions in a coastal plain soil. J Environ Qual. 2012;41(4):1087–1095.
- Veldkamp E, Keller M. Fertilizer-induced nitric oxide emissions from agricultural soils. Nutr Cycl Agroecosys. 1997;48(1–2):69–77.
- Hawthorne I, Johnson MS, Jassal RS, et al. Application of biochar and nitrogen influences fluxes of CO2, CH4 and N2O in a forest soil. J Environ Manage. 2017;192:203–214.
- Liu XJ, Mosier AR, Halvorson AD, et al. Dinitrogen and N2O emissions in arable soils: effect of tillage, N source and soil moisture. Soil Biol Biochem. 2007;39(9):2362–2370.
- Spokas KA, Novak JM, Venterea RT. Biochar’s role as an alternative N-fertilizer: ammonia capture. Plant Soil. 2012;350(1–2):35–42.
- Harrison R, Webb J. A review of the effect of N fertilizer type on gaseous emissions. Adv Agron. 2001;73:65–108.
- Thornton FC, Valente RJ. Soil emissions of nitric oxide and nitrous oxide from no-till corn. Soil Sci Soc Am J. 1996;60(4):1127–1133.
- Fenn L, Kissel D. Ammonia volatilization from surface applications of ammonium compounds on calcareous soils: I General Theory 1. Soil Sci Soc Am J. 1973;37(6):855–859.
- Dobbie K, McTaggart I, Smith K. Nitrous oxide emissions from intensive agricultural systems: variations between crops and seasons, key driving variables, and mean emission factors. J Geophys Res-Atmos. 1999;104(D21):26891–26899.
- Mosier AR, Parton WJ, Phongpan S. Long-term large N and immediate small N addition effects on trace gas fluxes in the colorado shortgrass steppe. Biol Fert Soils. 1998;28(1):44–50.
- Bouwman AF. Direct emission of nitrous oxide from agricultural soils. Nutr Cycl Agroecosys. 1996;46(1):53–70.
- Yanai Y, Toyota K, Okazaki M. Effects of charcoal addition on N2O emissions from soil resulting from rewetting air-dried soil in short-term laboratory experiments. Soil Sci Plant Nutr. 2007;53(2):181–188.
- Hu X, Xue Y, Long L, et al. Characteristics and batch experiments of acid-and alkali-modified corncob biomass for nitrate removal from aqueous solution. Environ Sci Pollut R. 2018;25(20):19932–19940.
- Yang F, Lee X, Theng BK, et al. Effect of biochar addition on short-term N2O and CO2 emissions during repeated drying and wetting of an anthropogenic alluvial soil. Environ Geochem Health. 2016;39(3):634–647.
- Major J, Rondon M, Molina D, et al. Maize yield and nutrition during 4 years after biochar application to a Colombian savanna oxisol. Plant Soil. 2010;333(1–2):117–128.
- Chan K, Van Zwieten L, Meszaros I, et al. Agronomic values of greenwaste biochar as a soil amendment. Aust J Soil Res. 2008;45(8):629–634.
- Zimmerman AR, Gao B, Ahn M-Y. Positive and negative carbon mineralization priming effects among a variety of biochar-amended soils. Soil Biol Biochem. 2011;43(6):1169–1179.
- Kuzyakov Y, Friedel J, Stahr K. Review of mechanisms and quantification of priming effects. Soil Biol Biochem. 2000;32(11–12):1485–1498.
- Al Marzooqi F, Yousef LF. Biological response of a sandy soil treated with biochar derived from a halophyte (Salicornia bigelovii). Appl Soil Ecol. 2017;114:9–15.