
 ?Mathematical formulae have been encoded as MathML and are displayed in this HTML version using MathJax in order to improve their display. Uncheck the box to turn MathJax off. This feature requires Javascript. Click on a formula to zoom.
ABSTRACT
The concept of novelty in terms of ‘uncommonness’ of ideas is one of the most considered in design studies. Accordingly, the metric developed by Shah, Vargas-Hernandez and Smith in 2003 (SNM) is still one of the most largely used. Nonetheless, it presents non-negligible and still unsolved problems when applied to realistic sets of ideas implementing heterogeneous numbers of attributes. This paper aims at identifying the roots of these problems and at proposing a refined assessment approach, capable to extend the applicability of SNM to any set of ideas. Generic boundary cases have been used to demonstrate the validity of the proposal, while its potential impact on the final novelty values has been estimated by assessing a real set of 100 ideas.
1. Introduction
Novelty is a fundamental parameter for both innovation and creativity assessments, whose concept, however, can assume different meanings (e.g. technological novelty (Verhoeven, Bakker, and Veugelers Citation2016), historical novelty, psychological novelty (Boden Citation2004), unexpectedness (Vargas-Hernandez, Okudan, and Schmidt Citation2012), etc.). According to Shah, Vargas-Hernandez, and Smith (Citation2003), two distinct families of novelty assessment approaches can be identified, i.e. the ‘a-priori’ and the ‘a-posteriori’ ones. In the ‘a-priori’, it is necessary to identify a reference solution (or a reference set of solutions) to discover whether the examined ideas are more or less novel (e.g. Jagtap, Citation2019; Sarkar and Chakrabarti Citation2011). Differently, in the ‘a-posteriori’ approaches, the set of ideas to be assessed constitutes the reference itself, to count the occurrences of the similar solutions generated in the same design or idea generation session. In this way, according to Shah, Vargas-Hernandez, and Smith (Citation2003), novelty is intended as a measure of the unusualness or ‘uncommonness' of a specific idea in relation to the set it belongs to (e.g. from the same experiment). Therefore, this concept of novelty is relative to a specific set and cannot compare ideas with those of past idea generation sessions or with marketed products (Srivathsavai et al. Citation2010). Consequently, according to the definitions provided by Boden (Citation2004), a-posteriori metrics implement the concept of psychological novelty (i.e. what is novel for the individual or groups of individuals that generated the idea), while cannot assess historical novelty (i.e. something never occurred in history before (Boden Citation2009)).
In this context, the a-posteriori metric of Shah, Vargas-Hernandez, and Smith (Citation2003) (hereinafter called SNM) is commonly used and acknowledged by engineering design scholars (Kershaw et al. Citation2019), even if it is not exempt from some problems (Brown Citation2014). In particular, a recently highlighted issue refers to misleading results when SNM is applied to sets of ideas implementing heterogeneous numbers of attributes and/or functions (Fiorineschi, Frillici, and Rotini Citation2018; Sluis-Thiescheffer et al. Citation2016). More precisely, Shah and colleagues originally applied SNM to ideas implementing the same number of attributes and/or functions, but some problems arise if this condition is not satisfied. However, this condition can be limitative and not representative of real design outcomes. Indeed, there are many possible reasons that can lead designers to add or miss some attributes in their ideas (e.g. distractions, misunderstandings, personal convictions about the usefulness of an additional attribute, etc.). Unfortunately, although highlighted in the literature, the problem is still unsolved (See section 2).
Here arises the objective of this paper: ‘extending the applicability of SNM to sets of ideas implementing heterogeneous numbers of attributes’.
According to this target, it is worth to put beforehand that this work focuses on a particular concept of novelty (i.e. unusualness or uncommonness) and a particular metric to assess it, which is based on the occurrences of ideas (Vargas-Hernandez, Shah, and Smith Citation2010 ). Discussions about the suitability of SNM (or a-posteriori metrics) for specific experiments fall out of the scope of this paper. Indeed, the main intent is to refine/improve the well-known SNM, to allow a broader and more comprehensive use of the metric,
The reader can find a short description of SNM in Section 2, together with a review of the previous contributions that somehow attempt to overcome the metric’s problem about missing (or extra) attributes. In the same section, a comprehensive explanation of the problem to be solved is also provided, by means of generic and illustrative examples. Then, Section 3 introduces a new assessment approach that solves the criticalities expressed in Section 2 for SNM and subsequent upgrades available in the literature. To evaluate the impact of the new proposal, Section 4 shows the application of the metric to a set of 100 ideas generated by both engineering and industrial design students. In particular, the differences are evaluated among the results obtained by three evaluators, who applied both the original SNM and the upgraded version. Section 5 reports discussions about the obtained results, together with an introduction to the impact expected for this work. Eventually, Conclusions are reported in the last section.
2. Background, description of the problem and state of the art
2.1. The metric of Shah, Vargas-Hernandez and Smith
SNM requires the identification of recurring ‘key-attributes’ or functions among the examined ideas, and to find the solutions adopted to implement them. More specifically, the novelty of an idea ‘I’ in SNM is relative to a set of ideas I, where each idea ‘I’ is composed by the solutions that implement each of the related attributes and/or functions (i.e. one solution for each attribute). However, Shah et al. did not provide a comprehensive definition about what actually can be identified as attributes or functions, but stated that their identification depends on the specific design problems and objectives. Furthermore, they provide few attributes/functions examples from a particular case study, i.e. ‘Propulsion/thrust method', ‘Medium of travel', ‘Motion of device' and ‘Number of parts' (Shah, Vargas-Hernandez, and Smith Citation2003). It is important to notice that the two terms (attribute and function) were used indistinctly, in a quite ambiguous way. Therefore, any possible concept of attribute can be included (not necessarily functions), as long as considered important by the evaluators who are applying the metric.
Additionally, Shah, Vargas-Hernandez, and Smith (Citation2003) also consider that different design stages (e.g. conceptual design, embodiment design, and detail design stages (Pahl et al. Citation2007)) could differently contribute to novelty. Then, for each design stage, novelty is assessed by scoring the solutions generated for each key attribute, and the values are summed together by multiplying them for the related weight, which indicates the relative importance according to the evaluators’ opinion. More precisely, the novelty value for each attribute is calculated by Equation (1):
(1)
(1) where
is the total number of solutions (or ideas) conceived for the key attribute
, and design stage
;
is the count of the current solution for the attribute
, and design stage
.
Then, the overall novelty of each idea M is calculated through Equation (2):
(2)
(2) where
is the weight of the attribute
,
is the number of attributes,
is the number of design stages and
is the weight assigned to the design stage
.
Concerning the parameter ‘n’, it is important to notice that the work described in this paper focuses on a single design stage, thus neglecting examples where multiple design stages are involved. Nevertheless, the proposal presented in the next sections preserves the applicability of the original version of SNM metric to multiples design stages.
As mentioned in the introductory section, SNM was originally applied to ideas implementing the same number of attributes and/or functions, but unfortunately, no instruction or guideline is available about how to apply it in presence of ideas implementing heterogeneous numbers of attributes. Therefore, the authors believe that a contribution to extend the applicability of SNM to sets of ideas that have different numbers of attributes could result useful for scholars, especially because it is one of the most used metrics.
2.2. The problem of assessing novelty with SNM in presence of missing and/or extra attributes and previous attempts to overcome it
What identifies an attribute as ‘missing’ or ‘extra’ strictly depends on the reference considered by evaluators. In particular, to better explain this concept, it is important to consider the two possible cases, which can characterise the design experiments (please note that in the following points, the use of the terms ‘a priori’ and ‘a posteriori’ is not related to the different assessment approaches mentioned by Shah et al.):
Experiments where the required attributes/functions are assigned a priori by the experimenter. For example, design tasks identified by a specific set of requirements (Pahl et al. Citation2007; Ullman Citation2010; Ulrich and Eppinger Citation2012).
Experiments where the attributes/functions are identified a-posteriori by analysing the generated set of ideas. For example, generic idea generation tasks (e.g. the conceptual design of a ‘time machine’) where only few indications are given to designers, who are intentionally left free to conceive and implement different attributes/functions.
In the case ‘a’, it is quite simple to understand whether an attribute for a certain idea is missing or additional, in relation to the imposed set of attributes. In the case ‘b’, the distinction is subjective and depends on the evaluators’ decision. Indeed, one can consider the set ‘union’ of all attributes implemented by the considered ideas. In this way, the ideas that do not implement all the attributes, necessarily present missing attributes. Conversely, if the evaluators consider the set ‘intersection’ of the attributes implemented by the assessed ideas, some ideas have extra attributes. However, the considerations made in this subsection are valid in both the mentioned experimental conditions (‘a’ and ‘b’).
At the best of the authors’ knowledge, the first scholars that explicitly faced the problems of missing/extra attributes were Sluis-Thiescheffer et al. (Citation2016). In particular, they pointed out that, in presence of a large set of ideas, SNM can lead to high novelty values, even if similar solutions appear quite often. In their experiment, they stressed that an idea appearing 160 times on a set of 816, gets a value higher than those appearing only 4 times (on a set of 13 ideas). Considering the presence of 62 participants, they argued that in the first case, an idea generated 2–3 times for each participant is getting a quite higher value than an idea generated 1 time every 16 participants. By analysing their discussion, however, it is possible to observe that they were examining two different attributes in the same design task. While one attribute is used very frequently (816 times), the other one is used only for 13 ideas.
In other words, Sluis-Thiescheffer et al. (Citation2016) somehow highlighted the problem (i.e. attributes that are not implemented for some ideas), but their proposal does not allow to comprehensively face it. Indeed, they proposed to assess novelty with a binary metric (novel or not novel), where an arbitrary ‘expectedness’ threshold is used to identify less frequent (novel) solutions. The threshold suggested by the cited authors is the 75th percentile for the frequencies of solutions generated for each attribute (i.e. the 25% of ideas having lower concurrencies are novel). Then, for each idea, they suggest to calculate the sum of the novelty values calculated for each attribute in order to obtain the overall novelty. However, for comparing design spaces on the basis of complete ideas, or for comparing ideas, the proposal of Sluis-Thiescheffer et al. (Citation2016) is not ideal, since the novelty s of large parts of individual ideas (composed of multiple attributes) are discarded due to the threshold.
A further attempt to deal with the problem of missing attributes has been recently suggested by Fiorineschi, Frillici, and Rotini (Citation2018), where they observed that, when an idea misses to implement a specific attribute, Equation (1) cannot be applied as there is not any solution to be counted in the parameter. Accordingly, the same authors assert that it is equivalent to assign the value of ‘zero’ in place of the missing
values in Equation (2). However, in this way, the obtained novelty value results unbalanced, mainly because the sum of the weights of the solutions that actually constitute the overall ideas is not longer equal to one. Therefore, for a single design stage (the conceptual one) they proposed the modified
shown in Equation (3):
(3)
(3) where
is the number of attributes actually involved in the assessed idea, while the other terms are the same used in Equation (2). Since the numerator is the sum of the normalised weights of all attributes (i.e. 1),
becomes equal to
for concepts or ideas implementing all attributes (i.e. when also the denominator is equal to 1). However, as explained in the following, also this metric can lead to doubtful results.
In order to better understand the reason for which is not a comprehensive solution to the problem, Table shows an illustrative and generic set where five different types of ideas (C1, C2, C3, C4, C5) constitute the reference universe of solutions (for a single design stage). In particular, only C1 implements all the three attributes (A1, A2, A3), while the others miss one or two of them.
Table 1. Generic set of ideas with ‘missing attributes'. Different ideas for each attribute (A1, A2, A3) are coded with a different symbol.
By applying Equations (1–3) on this set, under the hypothesis that the three attributes share the same normalised weight of , the novelty values listed in Table show how the presence of missing attributes can affect SNM, and how
is not sufficient to solve the problem. It is worth to notice that SNM has been applied by considering the assumption made by Fiorineschi, Frillici, and Rotini (Citation2018), i.e. to assign ‘zero’ to the S parameter when in presence of missing attributes.
Table 2. Individual novelty values calculated by applying and
on the generic set of Table .
In particular, since C1 is composed by solutions that appear only one time in their related sets for each attribute, it should get the highest value (i.e. near to ten). Indeed, the solutions implementing each attribute appear just one time in the set of 100 ideas. This is in line with the concept of novelty considered by SNM (i.e. uncommonness), where uniqueness (intended here as the condition where a specific solution appears only one time in the considered set) is the related upper boundary condition. However, according to Equation (1), is the total number of ideas for ‘the key attribute
in the design stage
’. It means that for attribute A3, in this case
=
=1, thus leading to a S value of zero for the solution ‘Δ’ (i.e. the unique solution present for the attribute A3, appearing only one time in the whole set). However, ‘Δ’ is part of the overall idea C1, and then should not be neglected in the assessment of uncommonness. In particular, ‘Δ’ can be considered a solution for the ‘uncommon attribute’ A3, which for the specific example appears only one time in the entire set of ideas. Therefore, in terms of uncommonness, it appears quite weird to assign an S value of zero for a solution that appears only one time in the whole set of ideas. However, SNM needs a reference set of solutions for each attribute, but in this extreme case, the reference set does not exist (i.e. the reference is the solution itself).
Besides the particular problem derived from the boundary condition represented by C1, Table also shows that the differences between and
can be quite high in other circumstances. However, the actual reliability of certain
values is doubtful. For example, ideas C3, C4, and C5 share the same solution (Γ) for the attribute A1 and appear the same number of times (two each). These ideas all miss the attribute A3 but differ in the implementation of the attribute A2. In particular, C3 misses such attribute while C4 implements it with the solution ‘Y’ and C5 with the solution ‘Z’. According to Equation (3), the novelty value of C3 jumps from a quite low 3.13 (obtained with the original SNM) to a very high 9.40, only because it is missing two attributes. Differently, the other two ideas (C4 and C5) get values which take into consideration the uncommonness of the solutions implemented for attribute A2 (very frequent for Y, and very rare for Z) but are still affected by the absence of solutions for attribute A3. In other words, Equation (3) privileges the partial S values of implemented attributes. However, in this way, the actual uncommonness of the overall idea is not correctly assessed.
An additional boundary example can be used to better understand the latter problem. Considering the two different types of ideas A and B in Figure , they can be reasonably decomposed with two attributes or functions: ‘how to contain water’ and ‘how to dispense water’. Idea A implements both the attributes (a container with a tap), while the idea B missed that of ‘dispensing water’. Considering a boundary case where the idea A appears 99 times and B only one time, the novelty values according to both and
are equal to zero for both the assessed ideas.
Figure 1. Additional example to demonstrate how both SNM and SNM’ cannot correctly deal with missing attributes. Idea A appears 99 times, while Idea B only one time.
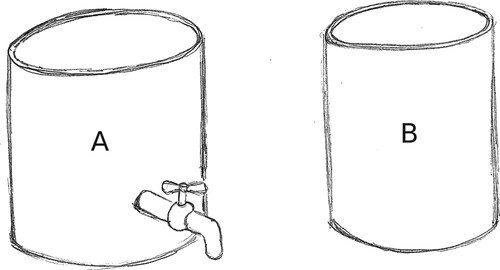
However, although Idea B uses the same solution for the first attribute (used 100 times on a set of 100, and thus leading Equation (1) to zero), it is the only one that does not present any solution about how to dispense the water. In terms of creativity assessment, the absence of a part of the idea could be a problem affecting the ‘quality’ parameter of the conceived idea, but according to the set of metrics proposed by Shah, Vargas-Hernandez, and Smith (Citation2003), novelty does not depend on quality. Therefore, strictly in terms of uncommonness (thus neglecting any consideration about the quality of the idea), the overall Idea B appears uncommon if compared to the overall Idea A. In light of this observation, it is weird to assign the same novelty value of zero for both the assessed ideas. Consequently, it is possible to assert that Equation (3) () does not solve the problem highlighted for SNM.
In conclusion, the above considerations lead to assert that the problems associated to the presence of missing or extra attributes swivel around the ‘’ parameter of Equation (1). Indeed, according to what explicitly mentioned by Shah, Vargas-Hernandez, and Smith (Citation2003), it represents the total number of solutions generated ‘for the specific attribute’. Consequently, the presence of ideas with missing or extra attributes implies necessarily the presence of different
values. This leads to unbalanced
assessments that affect the overall novelty value calculated through Equation (2). Therefore, the above considerations show that the currently available assumptions and/or solutions proposed for SNM, do not allow to assess evident manifestations of uncommonness when they originate from ideas that implement different numbers of attributes (like in the case of the dispenser shown in Figure ). This lack could lead to misleading evaluations, thus hindering comprehensive analysis of the actual idea generation effectiveness.
Accordingly, the following problem is still open for SNM and needs to be solved:
If Equation 1 is applied to ideas implementing different numbers of attributes, the value of changes according to the number of ideas actually implementing each specific attribute. The value of the final novelty from Equation 2 is affected by this variation, but there is not any acknowledged approach to compensate it.
3. Refined approach to extend the applicability of SNM
One can argue that to avoid the problem introduced in the previous section, it would be possible to simply opt for the a-priori approach. However, as reported in Section 2, a-priori and a-posteriori approaches refer to two different novelty concepts (i.e. historical novelty for the a-priori approach and psychological novelty for the a-posteriori one), which should be carefully selected in relation to the experiment’s objectives. According to Sarkar and Chakrabarti (Citation2011), to assess the actual novelty of an idea, historical novelty is needed. However, metrics based on idea infrequency (i.e. the measure of unusualness) are used in design studies (e.g. Jansson and Smith (Citation1991), Linsey et al. (Citation2011)), to evaluate the creative performances of designers (for instance when the experimenters want to evaluate the impact of different design methods, tools and/or stimuli). Therefore, the selection of the novelty concept and the related assessment approach is strictly under the responsibility of the scholars performing the experiment.
Furthermore, one can also argue that the a-posteriori metric of Jansson and Smith (Citation1991) could be used as an alternative to SNM. Indeed, according to Linsey et al. (Citation2011), different bins can be created to identify different ideas. In such a way, novelty is calculated in terms of frequency of similar ideas (i.e. ideas in a certain bin / total number of ideas). Although this metric allows only a more generic assessment if compared with the attribute-based approach of SNM, it shares the need to count the occurrences of ideas in relation to the set of ideas generated in the same experiment. In standard conditions, (i.e. when also SNM works correctly), the suitability of an approach in place of the other strictly depends on the specific experiment to be performed and the related analysis type. However, the bin-based approach of Linsey et al. (Citation2011), if applied to the example of Figure , probably would lead to two different bins (i.e. ideas with dispenser and ideas without dispenser). It means that the absence of a solution for a specific attribute, can reasonably be worthy of consideration in a-posteriori novelty assessment procedures based on the count of idea occurrences. Therefore, following the same logic, it could be the same also for the more detailed attribute-based SNM approach. What is currently hindering the application of SNM to these sets of ideas, is the need to have the same ‘’ (see Equation (1)) for all the considered attributes. However, if also the absences of solutions are counted, the
would be the same across all the attributes. Consequently, the following fundamental question arises:
is the absence of solutions, for one or more attributes or functions, worthy of being counted in the parameter?
The example of Figure , however, faces the question from another point of view. Indeed, in this example, is the absence of the solution for the ‘dispenser’ attribute that actually makes Idea B apparently uncommon. It could appear strange that missing a part of an idea (assuming that it was actually required) can contribute to uncommonness. However, the same experiment of Sluis-Thiescheffer et al. (Citation2016) confirms that the different numbers of implemented attributes are an issue worthy of having an impact on novelty assessment. Moreover, according to the set of metrics proposed by Shah, Vargas-Hernandez, and Smith (Citation2003), the uncommonness of ideas is independent from their quality (e.g. how many ‘expected’ attributes are implemented). An additional illustrative example can be used to better explain this concept. Suppose to perform an experiment where the participants are asked to conceive a ‘time-traveling machine’, without any specific set of requirements (i.e. without an imposed set of attributes to be implemented). Suppose, for example, that while almost all the participants conceive a device with different ways to host the time-traveller (then implementing the hypothetical attribute ‘how to host the traveller’), one or few of them conceive ideas where the time-traveller wears the device (e.g. a bracelet). In this (intentionally extreme) example, the lack of a device to contain the traveller in some ideas does not justify a withdrawn of those ideas from the analysis. Differently, a time machine that can be worn surely appears as worthy of consideration in terms of ideation effectiveness. Moreover, any consideration about the quality of the idea can be performed independently on novelty, by using ad-hoc metrics, not necessarily limited to the feasibility of the design outcome (Berthelsdorf et al. Citation2016; Choo et al. Citation2014).
Therefore, starting from these observations, the following proposal potentially allows the application of SNM to sets of ideas implementing different numbers of attributes:
The absence of solutions for a specific attribute contributes to the uncommonness of the overall idea, in relation to the same set of ideas to which the assessed idea belongs. Therefore, absences of solution for the attributes considered in the assessment are included in the count of the parameter in Equation 1.
To perform a first demonstration of the effects of this proposal (hereinafter called ), it has been applied on the set represented in Figure . In this case, Idea A has a novelty value of 0.05, while the novelty of Idea B is 4.95 (under the hypothesis of equal normalised weights of 0.5). The effect of the proposal is better explained by the following equations. More precisely, Equations (4–6) show how the proposal affects the calculations of the S values, and Equations (7) and (8) show the related effect on the final novelty value (i.e. the application of Equation (2)).
(4)
(4)
(5)
(5)
(6)
(6)
Where is the S value of the solution used to implement the ‘container’ attribute (then equal to zero for both Idea A and Idea B).
and
are the S values of the solutions used to implement the ‘dispenser’ attribute for Idea A and Idea B respectively.
is the T value of the attribute ‘container’, while
is the T value of the attribute ‘dispenser’ (now equal to
).
is the C value of the solution used to implement the attribute ‘container’ (equal for both the concepts), while
and
are the C values of the solutions used by Idea A and Idea B respectively, for implementing the attribute ‘dispenser’ (absence of solutions for the Idea B).
Then, Equation (2) can be applied by considering the S values obtained by Equations (4)–(6), and the same weight distribution considered in the previous section (0.5 for each attribute):
(7)
(7)
(8)
(8) A further confirmation of the validity of
can be obtained by applying it on the same generic set of ideas of Table , and comparing the results with the novelty values obtained with Equation (2) (Table ). The weights of attributes are still assumed all equal to
. With
, Idea C1 correctly gets the highest possible value. Indeed, the Δ solution of A3 (see Table ) appears one time (thus representing the upper bound of uncommonness) but Equation (1) is applied by considering also the 99 ‘absences of solution’, thus leading again to T = 100. It is worth to notice that also in this case,
has been calculated by considering the assumption made by Fiorineschi, Frillici, and Rotini (Citation2018), i.e. to assign ‘zero' to the S parameter when in presence of missing attributes.
Table 3. Individual novelty values calculated by applying on the generic set of Table . The values from
are also reported for a direct comparison.
Idea C2 correctly remains at a very low value, while more balanced values are obtained for ideas C3, C4 and C5. In particular, C3 and C5 now get the same novelty value because for Attribute A2, both the ‘absence of solution’ and the solution Z appear only two times (see Table ). However, their novelty value also takes into consideration that the ‘absence of solutions’ for attribute A3 is extremely common (differently than what happened with Equation (3)).
4. First estimate of the potential differences between MSNM and M′SNM
To provide a first estimate of the entity of the potential differences between and
, both metrics have been used to calculate novelty values starting from a set of data already used in a previous work (Fiorineschi, Frillici, and Rotini Citation2020b). More specifically, this set of data originated from the analyses of a sample of ideas generated by students during a didactical exercise that is usually performed in two academic courses. The reader can find a comprehensive description of the assigned design task in Appendix A1.1, while Subsection A1.2 reports ethical notes about the work described in this paper.
The dataset used in this paper was obtained in a precedent work of the authors (Fiorineschi, Frillici, and Rotini Citation2020b), by three different evaluators (EV1, EV2 and EV3). When they performed the codification of the ideas, they independently followed the procedure suggested by Shah, Vargas-Hernandez, and Smith (Citation2003), which has not been modified by the proposal described in this paper. The extracted dataset is constituted by:
the attributes defined by the three evaluators (Table );
the weights assigned to each attribute by the three evaluators (Table );
the alphanumeric codes used to label (and thus to identify) the solution variants found in the sample (doi:10.17632/x982xwwhmr.1).
Table 4. Attributes (Att.) identified by the evaluators and related weights (W). From Fiorineschi, Frillici, and Rotini (Citation2020b).
As it is possible to observe in Table , number and type of attributes are quite different among the three evaluators, and this is coherent with what observed by Brown (Citation2014), i.e. that the identification of attributes and related weights in SNM can be quite subjective.
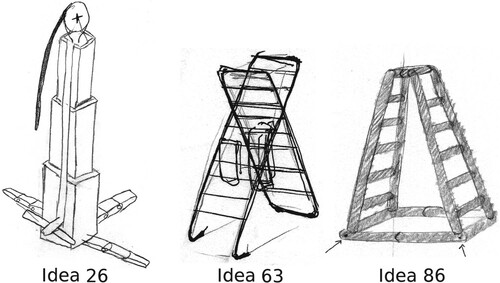
To give few examples, Figure depicts three different ideas (obtained in the didactical exercise mentioned in (Fiorineschi, Frillici, and Rotini Citation2020b)) that have some uncommon features (in reference to the other ideas). As shown, ‘Idea 26’ is a system similar to an elevator activated by a rope (only two in the sample), Idea ‘63’ is based on a common ladder but it is the sole in the sample that mentions the possibility to support clothes, while Idea ‘86’ uses an inflatable structure.
Figure 2. Examples of some sketches of ladders produced by students. Idea ‘26' is a sort of elevator (only two in the whole set) activated by a rope. Idea ‘63' is based on a common ladder but is the sole mentioning the possibility to support clothes. Idea ‘86' uses an inflatable structure.
Each evaluator considered the union of all the attributes identified for the assessed ideas. According to what stated in Section 2, this is the reason why the example considers only the possibility of ‘incomplete ideas’ (e.g. Tables ), excluding the possibility of ideas implementing ‘extra attributes’. The outcomes of the coding highlight that also the ideas in Figure can have more or less ‘missing attributes’, depending on the considered evaluator (see Tables ).
Table 5. Codification of Idea 26 (see Figure ), according to the three evaluators.
Table 6. Codification of Idea 63 (see Figure ), according to the Three evaluators.
Table 7. Codification of Idea 86 (see Figure ), according to the Three evaluators.
It is also worth to highlight that as for the examples shown in the previous section, in order to allow the application of to missing items, it has been assumed to assign S = 0 when applying Equation (2) to ideas with missing attributes.
4.1. Calculated novelty of individual ideas
The assessments performed by the three evaluators led to the individual calculated novelty values shown in Figure (for EV1), Figure (for EV2) and Figure (for EV3). The figures reveal that the differences between and
can be quite high, and that they depend on the specific set of attributes and weights. Indeed, while EV1 and especially EV2 obtain very different results with the two metrics, the differences are less evident for EV3. To provide some numerical examples, the novelty values of the ideas shown in Figure are reported in Table , and graphically shown in Figures (please note that line-charts have been used in place of bar-charts to better highlight the differences between
and
).
Figure 3. Novelty values obtained by EV1 with the two metrics. Perfect ‘zero' values indicate that the specific evaluator was unable to assess the specific idea.
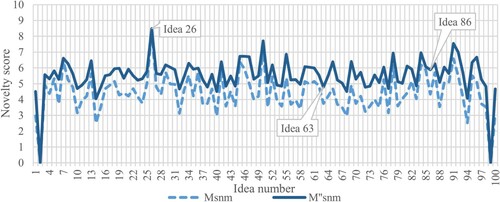
Figure 4. Novelty values obtained by EV2 with the two metrics. Perfect ‘zero' values indicate that the specific evaluator was unable to assess the specific idea.
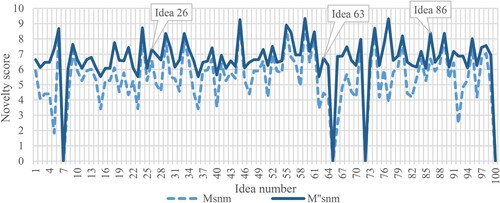
Figure 5. Novelty values obtained by EV3 with the two metrics. Perfect ‘zero' values indicate that the specific evaluator was unable to assess the specific idea.
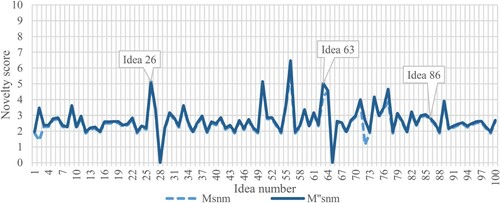
Table 8. Individual novelty values of ideas shown in Figure . The values are also graphically shown in Figures .
Furthermore, by observing the Figures , it is possible to see the impact of the different sets of attributes (and related weights) on the differences between and
. For example, for EV1 the application of
led to a quite constant shift of the novelty values, without evident changes. Differently, for EV2 it is possible to observe that in some cases,
led to very different values if compared to
(e.g. for ideas from 2 to 5 in Figure ), while in other cases the differences are sensibly lower. Then, EV3 obtained almost the same results with the two metrics, with the only exception of Ideas 2 and 72 (see Figure ).
Notwithstanding the acknowledged influence of the weights on the final novelty value, it seems that their impact on the differences between and
is quite limited. To support this statement, which is not generalisable and limited to this specific set of data,
and
have been re-calculated by assigning equal weights for each attribute (naturally different among evaluators, since they used different numbers of attributes). Accordingly, the obtained values and the related graphs (see the Appendix) are quite similar to those shown in this section.
4.2. Overall assessment results
The differences between the individual novelty values calculated with the two metrics, also affect the overall assessments of the whole set of ideas. Table shows the differences between the mean novelty values obtained with the two metrics, the related standard deviations and the maximum values, calculated from the individual values shown in Figures .
Table 9. Overall assessment results for the three evaluators.
The mean differences between and
can vary, depending on the specific idea decomposition strategy, i.e. on the specific set of attributes and related weights. Accordingly, Table shows that while EV1 and EV2 encountered a difference around one point, the difference encountered by EV3 was very low. In addition, also the maximum obtained difference varies a lot among the evaluators. However, although EV3 registered the lower mean differences between the two metrics, the maximum one was higher than EV1. Instead, EV2 showed the highest differences in terms of both mean and maximum values (the latter with 5.51 points).
In order to establish whether the distributions of values obtained with the two metrics were statistically different, a paired t-test (Ross Citation2009) has been executed for each evaluator separately. For all the evaluators, the differences between the set of values obtained with the two metrics were always statistically meaningful (p_value < .001; alpha = 0.05). It implies that the application of in place of
in an hypothetical experiment could potentially lead to misleading results (under the assumption, defended in this paper, that
constitutes the correct way to manage the presence of missing or extra attributes).
5. Discussions
5.1. Achieved results
The generic examples and the application to a real set of data provided in this paper comprehensively show the issues affecting SNM when dealing with sets of ideas implementing heterogeneous numbers of attributes. In particular, as highlighted in Section 2, if attempting to use SNM in these cases, an inappropriate ‘zero’ value is assigned to an attribute appearing only one time in the whole set. Similarly, improper novelty values are calculated when solutions are absent for specific attributes. It has been highlighted in this paper that these problems can be ascribed to two fundamental assumptions made by Shah, Vargas-Hernandez, and Smith (Citation2003), affecting the parameter in Equation (1). Indeed, they assumed that
is the number of ideas for the specific attribute ‘i’, and also implicitly assumed (but not explicitly mentioned) that the whole set of ideas share the same number of attributes. In Section 2, it has been also demonstrated that, although suggesting solutions to circumvent the problem, existing proposals were not sufficient to solve it.
Differently, the proposed refinement () offers the possibility to apply the SNM assessment approach to a wider and more realistic universe of possible case studies. Indeed, the proposal underpins on the assumption that the ‘absence of solutions’ for specific attributes/functions can actually affect the uncommonness of the overall idea. Because of this assumption, any absence of solutions for a specific attribute is considered as a particular characteristic of the generated idea, and then it is worthy to be considered in Equation (1). In this way, the problems highlighted in Section 2 have been solved in a single time. More specifically, by definition, with the underpinning assumption that led to
, the
parameter is now always the same for each attribute, and then Equation (1) can be always applied without obtaining misleading values. Accordingly, the application of the metric to the generic boundary cases considered in Section 2 demonstrated that
correctly assigns the maximum value to ‘unique’ ideas (i.e. the upper bound of uncommonness) also in presence of an ‘extra’ attribute. Moreover, as demonstrated by referring to the example of Figure ,
allows more balanced assessments by considering also the absence of solutions as potential source of uncommonness.
The application to the data coming from a real design task (Section 4) demonstrated that the entity of the potential misleading assessment by applying SNM in presence of heterogeneous number of attributes could be quite high. It is especially true with individual novelty values (as shown in Tables and ), but non-negligible differences can be observed also in terms of mean novelty values (Table ). In particular, Table shows that the three ideas displayed in Figure reach higher novelty values with . However, in some cases, the difference is negligible (as for Idea 26, with the set of attributes of EV3), while in other cases the differences are quite high (as for Idea 63, with the set of attributes of EV2, where a difference of 2.3 point has been obtained). Still considering individual novelty values of ideas, Table shows that actually, the differences between
and
can be extremely high (up to 5.51 points), but are strictly dependent on the set of attributes and the related weights.
In other words, the results shown in Section 4 demonstrate that the magnitude of the potential errors coming from the application of SNM when in presence of different values is dependent on the specific attribute assignment strategy and therefore can vary for different evaluators.
Therefore, besides the specific problems related to the presence of ideas with missing or extra attributes, this paper confirms the subjectivity issues of SNM, already highlighted by Brown (Citation2014). In particular, the subjectivity in the identification of attributes and related weights, can actually affects the differences between and
, thus magnifying the entity of the problem faced in this work. Accordingly, the three examples shown in Section 4 highlight that different evaluators can have extremely different perceptions about what is deemed important for novelty.
However, it is worth to highlight that the application of does not necessarily improve the correlation between the novelty ‘perceived’ by the evaluator and the novelty assessed through SNM. This is a non-trivial research argument that deserves particular attention and that still lacks comprehensive conclusions. In particular, it is possible to find studies focused on possible correlations between subjective metrics and uncommonness metrics (e.g. Hocevar [Citation1979] and the more recent comparison performed by Weaver, Caldwell and Sheafer [Citation2019]). Also Shah, Vargas-Hernandez, and Smith (Citation2003) performed a similar comparison in order to evaluate their metrics. However, it is important to notice that SNM is intended as an indirect measure of the psychological novelty, i.e. to assess if and to what extent the idea is novel for the person (or the group of persons) that generated it (Boden Citation2009). Consequently, it appears quite weird to compare it with the personal and subjective perception of an external evaluator. Indeed, a subjective evaluation of novelty is based on a specific knowledge about the specific product type. It implies that comparing a subjective evaluation of an external evaluator with the values obtained from SNM would mean to compare a measure of psychological novelty (of the designer) with a measure of the historical novelty of the evaluator. In the opinion of the authors, the logic behind such a kind of comparisons is misleading. Although the discussions on this issue fall out of the scope of this work, it surely provides an input for future research.
5.2. Limits and research hints
As shown in Section 4, a subjectivity problem of SNM is still present, which affects the identification of the functions and/or attributes. Consequently, although providing important information about the rationale followed for the novelty assessment, SNM-based approaches can still lead to very different assessment results. Reasonably, the presence of shared guidelines to perform idea decomposition (i.e. attribute assignments) could help in obtaining more robust and repeatable novelty measures. To that purpose, some proposals are available in literature, which could partially overcome the issue by referring to predefined abstraction frameworks (Johnson et al. Citation2016; Peeters et al. Citation2010; Vargas-Hernandez, Okudan, and Schmidt Citation2012 ; Vargas-Hernandez, Schmidt, and Okudan Citation2012 ). In particular, they refer to the Genealogy Tree (GT), which is the fundamental tool proposed by Shah, Vargas-Hernandez, and Smith (Citation2003) to assess Variety. It is a hierarchical representation based on four items, i.e. physical principles, working principles, embodiments and details characterising each implemented function (Pahl et al. Citation2007). However, these metrics are still intended to be applied on sets of ideas implementing the same number of attributes or functions. Therefore, they cannot provide any advantage in presence of ideas with ‘missing or extra attributes’. Nevertheless, considerations and tests similar to those performed in this paper can be performed for these metrics, in order to evaluate how the problem of missing and/or extra attributes can affect them. In that case, it is worth to notice that additional aspects need to be considered, e.g. the hierarchical relationships among the different GT levels and the related weights. Moreover, different abstraction frameworks are available in the literature (Dorst and Vermaas Citation2005; Fiorineschi Citation2018; Komoto and Tomiyama Citation2011; Pahl et al. Citation2007; Srinivasan and Chakrabarti Citation2009), and there are not scientific studies that support the selection of a specific one for novelty assessment purposes. It is also worth to highlight that this kind of investigations is complex and intrinsically linked to the concept of ‘function’, which is acknowledged to be very subjective (Eckert Citation2013; Eckert et al. Citation2012; Vermaas and Eckert Citation2013), and that can actually affect the identification of the attributes used for the assessment.
Concerning the actual impact of the proposal in terms of novelty values calculated in real sets of ideas, the results presented in Section 4 provide only a first estimation, whose validity is limited for the specific experiment. In order to extract comprehensive evaluations about the actual impact of the proposal, many experiments should be conducted, with different experimental conditions. This kind of experiment could be prohibitive and too much onerous to be performed. However, a hint to overcome the problem can be found in the recent work of Fiorineschi, Frillici, and Rotini (Citation2020a) , where a very high number of ‘virtual sets of ideas’ has been exploited to evaluate the differences between and
. The same experiment can be repeated by considering
in place of
.
5.3. Expected impact
One of the most diffused use of novelty metrics (and creativity metrics, in general) is that of assessing the effectiveness of new design or idea generation methods and tools (e.g. Hwang and Park Citation2018; Kurtoglu, Campbell, and Linsey Citation2009; Vandevenne, Pieters, and Duflou Citation2016; Wilson et al. Citation2010). In this context, the proposal presented in this paper paves the way for a comprehensive application of the a-posteriori approach to realistic samples of ideas and/or design tasks. Moreover, a-posteriori approaches (SNM-based or simplified versions) are also used by scholars to evaluate the effects of a plethora of parameters, as for example the incubation time (e.g. Tsenn et al. Citation2014), different design representations (e.g. Atilola, Tomko, and Linsey Citation2016), specific tools (e.g. Vargas-Hernandez, Schmidt, and Okudan Citation2013), or even the effects of the so-called sunk-costs (Viswanathan and Linsey Citation2018). The mentioned studies are of fundamental importance, e.g. to understand critical phenomena like that of ‘Design fixation’ (Jansson and Smith Citation1991; Youmans and Arciszewski Citation2014b, Citation2014a), and then to develop efficient procedures and/or guidelines to support creativity in design processes.
However, the impact of the work can be extended to any research field where the novelty assessment of design and/or ideation outcomes is deemed useful. For instance, novelty can be a key parameter for studies focused on concept selection (e.g. Toh and Miller Citation2015; Zheng, Ritter, and Miller Citation2018), as well as in studies focused on design education and/or cognition (Gero, Yu, and Wells Citation2019; Starkey, Toh, and Miller Citation2016). Anyhow, it is of fundamental importance to highlight that the proposal presented in this work is strictly limited to SNM and then to the related concept of novelty. Accordingly, the benefits expected from this paper underpin on the extended applicability of the refined SNM metric, which potentially allows to obtain more robust experimental results and insights. Indeed, as highlighted by Fiorineschi, Frillici, and Rotini (Citation2018), the presence of ideas implementing different number of attributes could lead researchers to adopt different and sometimes drastic strategies to circumvent the problem (e.g. skimming ‘incomplete’ ideas not compliant with the design specification and/or forcing the identification of the attributes). In this context, the possibility of considering ideas with missing or extra attributes allows to consider any set of attributes/function for the assessment, thus allowing to better fit the experimental objectives. In addition, it is now possible to comprehensively discern novelty assessment from quality-related assessments, i.e. the two main metrics often used for design-related creativity assessments (e.g. Linsey et al. Citation2011; Toh and Miller Citation2019). Indeed, according to the set of four metrics proposed by Shah, Vargas-Hernandez, and Smith (Citation2003), novelty evaluations should be always kept separated from any kind of action potentially affecting the ‘quality’ of the design outcomes, which should be assessed separately with a specific metric. The proposed eliminates the problem from the root, thus avoiding any potential interference between the two parameters. More specifically, it is no longer necessary to skim ideas implementing unexpected attributes and/or missing expected attributes. For this and for all the reasons summarised above, the refined metric proposed in this paper constitutes a step forward in the field of design creativity research. More in particular, this work can be positioned in the set of contributions focused on design creativity metrics (e.g. Hay et al. Citation2020; Jagtap, Citation2019; Kershaw et al. Citation2019; Lopez-Mesa and Vidal Citation2006; Nelson et al. Citation2009; Oman et al. Citation2013; Sarkar and Chakrabarti Citation2011; Shah, Vargas-Hernandez, and Smith Citation2003; Verhaegen et al. Citation2013; Weaver, Caldwell, and Sheafer Citation2019).
6. Conclusions
The problem of assessing novelty when in presence of ideas implementing heterogeneous numbers of attributes was previously highlighted in the literature, and led some scholars to conclude that, in these cases, the usefulness of the metric of Shah, Vargas-Hernandez, and Smith (Citation2003) is limited (Sluis-Thiescheffer et al. Citation2016). However, thanks to the generic boundary cases considered in this work, it has been identified here that the problem of SNM takes origin both from the fundamental assumption that the reference number of ideas (T) can vary for different attributes, and from the lack of a correct management of the ‘absence of solutions’ for specific attributes.
Accordingly, the proposed refined metric underpins on the assumption that the ‘absence of solutions’ contributes to the uncommonness of the assessed ideas. By considering the absence of solution in the T parameter of each attribute, it has been possible to apply the SNM equations independently on the number of attributes actually implemented by the assessed ideas. The robustness of the proposed refinement has been evaluated by the application of the metric to the same boundary cases used to highlight the SNM problems. Differently than SNM, the new refined version revealed to be capable to correctly assign the highest novelty values when expected and to provide more realistic measures (see the example of Figure ).
Additionally, thanks to the application of both and the new version
to a set of data from a real design task, it has been possible to perform a first estimate of the potential differences that can be obtained between the two metrics if applied in presence of missing attributes. More specifically, three evaluators coded a set of 100 ideas generated by Engineering and Industrial Design students, obtaining three different sets of attributes. It has been found that the differences between the two versions of the metric vary across the three evaluators, both for individual and mean novelty values, but confirming the non-negligible impact of the problem. Indeed, quite high differences have been obtained between the standard SNM calculation and the proposed approach.
The proposed refinement is actually an upgrade of the original SNM, extending its applicability to any set of ideas (within the design context), regardless the specific attribute identification strategy. It is an important achievement for novelty assessments (and then for design creativity research), because it allows to apply the well acknowledged SNM assessment rationale without the need to ‘force’ the identification of the attributes and/or to discard ideas with missing or extra attributes from the experiment. Indeed, such a limitation can imply the loss of important parameters affecting novelty and/or the interference with quality assessments. Accordingly, the three evaluators involved in this work were asked to find the attributes that they believe important for the assessment, regardless of their actual occurrences in the overall set of ideas. As a result, although with different strategies, all of them felt the need to identify heterogeneous numbers of attributes for the considered set.
In conclusion, the extended applicability of SNM paves the way for new and more extended research about the complex phenomena underpinning creativity in idea generation and/or design processes. Nevertheless, additional research is also needed to improve the metric, especially to reduce or to better manage the subjectivity of attribute identification and weights assignment procedures. Indeed, as shown in this paper, the subjectivity in the identification of attributes and related weights can actually lead to very different novelty values for the same ideas. This issue still needs to be comprehensively faced by scholars.
Disclosure statement
No potential conflict of interest was reported by the author(s).
References
- Atilola, O., M. Tomko, and J. S. Linsey. 2016. “The Effects of Representation on Idea Generation and Design Fixation: A Study Comparing Sketches and Function Trees.” Design Studies 42: 110–136. https://doi.org/https://doi.org/10.1016/j.destud.2015.10.005
- Berthelsdorf, F. A., R. M. Arlitt, J. L. Armstrong, A. M. Wilson, and R. B. Stone. 2016. “Creative Personalities: How Personality Influences Creativity of Concept Ideation Methods.” The Fourth International Conference on Design Creativity (4th ICDC) (pp. 1–8).
- Boden, M. A. 2004. The Creative Mind: Myths and Mechanism. 2nd ed. London: Routledge. https://doi.org/https://doi.org/10.4324/9780203508527
- Boden, M. A. 2009. “Computer Models of Creativity.” AI Magazine 30 (3): 23–34.
- Brown, D. C. 2014. “Problems with the Calculation of Novelty Metrics.” Proceedings of the 6th International Conference on Design Computing and Cognition. http://web.cs.wpi.edu/~dcb/Papers/DCC14/DCC14-Brown-Novelty-workshop.pdf
- Choo, P. K., Z. N. Lou, B. Koo, B. A. Camburn, F. Grey, and K. L. Wood. 2014. “Ideation Methods: A First Study on Measured Outcomes with Personality Type.” Proceedings of the ASME 2014 International Design Engineering Technical Conferences & Computers and Information in Engineering Conference IDETC/CIE 2014 August 17–20, 2014, Buffalo, New York, USA (pp. 1–12). doi: https://doi.org/10.1115/DETC2014-34954
- Dorst, K., and P. E. Vermaas. 2005. “John Gero’s Function-Behaviour-Structure Model of Designing: A Critical Analysis.” Research in Engineering Design 16 (1–2): 17–26. doi:https://doi.org/10.1007/s00163-005-0058-z
- Eckert, C. 2013. “That Which is not Form: The Practical Challenges in Using Functional Concepts in Design.” Artificial Intelligence for Engineering Design, Analysis and Manufacturing 27 (03): 217–231. doi:https://doi.org/10.1017/S089006041300022X
- Eckert, C., A. Ruckpaul, T. Alink, and A. Albers. 2012. “Variations in Functional Decomposition for an Existing Product: Experimental Results.” Artificial Intelligence for Engineering Design, Analysis and Manufacturing 26 (02): 107–128. doi:https://doi.org/10.1017/S0890060412000029
- Fiorineschi, L. 2018. “Abstraction Framework to Support Students in Learning Creative Conceptual Design.” Journal of Engineering, Design and Technology 16 (4): 616–636. https://doi.org/https://doi.org/10.1108/JEDT-02-2018-0017
- Fiorineschi, L., F. S. Frillici, and F. Rotini. 2018. “Issues Related to Missing Attributes in A-Posteriori Novelty Assessments.” International Design Conference - Design 2018 (pp. 1067–1078), Dubrovnik – Croatia.
- Fiorineschi, L., F. S. Frillici, and F. Rotini. 2020a. “Impact of Missing Attributes on the Novelty Metric of Shah et al.” Research in Engineering Design 31 (April 2020): 221–234. doi: https://doi.org/10.1007/s00163-020-00332-x
- Fiorineschi, L., F. S. Frillici, and F. Rotini. 2020b. “Subjectivity of Novelty Metrics Based on Idea Decomposition.” International Journal of Design Creativity and Innovation 8 (223–239): 1–17. doi: https://doi.org/10.1080/21650349.2020.1811775
- Gero, J. S., R. Yu, and J. Wells. 2019. “The Effect of Design Education on Creative Design Cognition of High School Students.” International Journal of Design Creativity and Innovation 7 (4): 196–212. doi: https://doi.org/10.1080/21650349.2019.1628664
- Hay, L., A. H. B. Duffy, M. Grealy, M. Tahsiri, C. McTeague, and T. Vuletic. 2020. “A Novel Systematic Approach for Analysing Exploratory Design Ideation.” Journal of Engineering Design 31 (3): 127–149. doi:https://doi.org/10.1080/09544828.2019.1662381
- Hocevar, D. 1979. “A Comparison of Statistical Infrequency and Subjective Judgment as Criteria in the Measurement of Originality.” Journal of Personality Assessment 43 (3): 297–299. doi: https://doi.org/10.1207/s15327752jpa4303_13
- Hwang, D., and W. Park. 2018. “Design Heuristics set for X: A Design aid for Assistive Product Concept Generation.” Design Studies 58: 89–126. doi: https://doi.org/10.1016/j.destud.2018.04.003
- Jagtap, S. 2019. “Design Creativity: Refined Method for Novelty Assessment.” International Journal of Design Creativity and Innovation 7 (1–2): 99–115. doi:https://doi.org/10.1080/21650349.2018.1463176
- Jansson, D. G., and S. M. Smith. 1991. “Design Fixation.” Design Studies 12 (1): 3–11. doi: https://doi.org/10.1016/0142-694X(91)90003-F
- Johnson, T. A., B. W. Caldwell, A. Cheeley, and M. G. Green. 2016. “Comparison and Extension of Novelty Metrics for Problem-Solving Tasks.” Proceedings of the ASME 2016 International Design Engineering Technical Conferences and Computers and Information in Engineering Conference IDETC/CIE 2016, Charlotte, NC. doi:https://doi.org/10.1115/DETC2016-60319
- Kershaw, T. C., S. Bhowmick, C. C. Seepersad, and K. Hölttä-Otto. 2019. “A Decision Tree Based Methodology for Evaluating Creativity in Engineering Design.” Frontiers in Psychology 10 (JAN): 1–19. doi: https://doi.org/10.3389/fpsyg.2019.00032
- Komoto, H., and T. Tomiyama. 2011. A Theory of Decomposition in Systems. In ICED 2011.
- Kurtoglu, T., M. I. Campbell, and J. S. Linsey. 2009. “An Experimental Study on the Effects of a Computational Design Tool on Concept Generation.” Design Studies 30 (6): 676–703. doi: https://doi.org/10.1016/j.destud.2009.06.005
- Linsey, J. S., E. F. Clauss, T. Kurtoglu, J. T. Murphy, K. L. Wood, and A. B. Markman. 2011. “An Experimental Study of Group Idea Generation Techniques: Understanding the Roles of Idea Representation and Viewing Methods.” Journal of Mechanical Design 133 (3): 1–15. doi: https://doi.org/10.1115/1.4003498
- Lopez-Mesa, B., and R. Vidal. 2006. “Novelty Metrics in Engineering Design Experiments.” 9th International Design Conference, DESIGN 2006 (pp. 557–564), Dubrovnik, Croatia.
- Nelson, B. A., J. O. Wilson, D. Rosen, and J. Yen. 2009. “Refined Metrics for Measuring Ideation Effectiveness.” Design Studies 30 (6): 737–743. doi: https://doi.org/10.1016/j.destud.2009.07.002
- Oman, S. K., I. Y. Tumer, K. Wood, and C. Seepersad. 2013. “A Comparison of Creativity and Innovation Metrics and Sample Validation Through in-Class Design Projects.” Research in Engineering Design 24 (1): 65–92. doi: https://doi.org/10.1007/s00163-012-0138-9
- Pahl, G., W. Beitz, J. Feldhusen, and K. H. Grote. 2007. Engineering Design. 3rd ed. London: Springer-Verlag.
- Peeters, J., P. A. Verhaegen, D. Vandevenne, and J. R. Duflou. 2010. “Refined Metrics for Measuring Novelty in Ideation.” Proceedings of IDMME – Virtual Concept 2010 (pp. 1–4), Bordeaux, France.
- Ross, S. M. 2009. Probability and Statistics for Engineers and Scientists. 4th ed. Boston: Elsevier Academic Press.
- Sarkar, P., and A. Chakrabarti. 2011. “Assessing Design Creativity.” Design Studies 32 (4): 348–383. doi: https://doi.org/10.1016/j.destud.2011.01.002
- Shah, J. J., N. Vargas-Hernandez, and S. M. Smith. 2003. “Metrics for Measuring Ideation Effectiveness.” Design Studies 24 (2): 111–134. doi:https://doi.org/10.1016/S0142-694X(02)00034-0
- Sluis-Thiescheffer, W., T. Bekker, B. Eggen, A. Vermeeren, and H. De Ridder. 2016. “Measuring and Comparing Novelty for Design Solutions Generated by Young Children Through Different Design Methods.” Design Studies 43 (March): 48–73. doi: https://doi.org/10.1016/j.destud.2016.01.001
- Srinivasan, V., and A. Chakrabarti. 2009. “SAPPHIRE – An Approach to Analysis and Synthesis.” International Conference on Engineering Design – ICED’09 (pp. 417–428), Stanford, CA.
- Srivathsavai, R., N. Genco, K. Hölttä-otto, and C. C. Seepersad. 2010. “Study of Existing Metrics Used in Measurement if Ideation Effectiveness.” Proceedings of the ASME 2010 International Design Engineering Technical Conferences & Computers and Information in Engineering Conference IDETC/CIE 2010, Montreal, Canada.
- Starkey, E., C. A. Toh, and S. R. Miller. 2016. “Abandoning Creativity: The Evolution of Creative Ideas in Engineering Design Course Projects.” Design Studies 47: 47–72. doi: https://doi.org/10.1016/j.destud.2016.08.003
- Toh, C. A., and S. R. Miller. 2015. “How Engineering Teams Select Design Concepts: A View Through the Lens of Creativity.” Design Studies 38: 111–138. doi: https://doi.org/10.1016/j.destud.2015.03.001
- Toh, C., and S. R. Miller. 2019. “Does the Preferences for Creativity Scale Predict Engineering Students’ Ability to Generate and Select Creative Design Alternatives?” Journal of Mechanical Design, Transactions of the ASME 141 (6): 1–13. doi:https://doi.org/10.1115/1.4042154.
- Tsenn, J., O. Atilola, D. A. McAdams, and J. S. Linsey. 2014. “The Effects of Time and Incubation on Design Concept Generation.” Design Studies 35 (5): 500–526. doi: https://doi.org/10.1016/j.destud.2014.02.003
- Ullman, D. G. 2010. The Mechanical Design Process. 4th ed. New York: Mc Graw HIll.
- Ulrich, K. T., and S. D. Eppinger. 2012. Product Design and Development. 5th ed. New York: Mc Graw Hill Irwin. doi: https://doi.org/10.1016/B978-0-7506-8985-4.00002-4
- Vandevenne, D., T. Pieters, and J. R. Duflou. 2016. “Enhancing Novelty with Knowledge-Based Support for Biologically-Inspired Design.” Design Studies 46: 152–173. doi: https://doi.org/10.1016/j.destud.2016.05.003
- Vargas-Hernandez, Noé, L. C. Schmidt, and G. E. Okudan. 2012. “Systematic Ideation Effectiveness Study of TRIZ.” Proceedings of the ASME 2012 International Design Engineering Technical Conferences & Computers and Information in Engineering Conference IDETC/CIE 2012 (pp. 1–10).
- Vargas-Hernandez, Noé, L. C. Schmidt, and G. E. Okudan. 2013. “Systematic Ideation Effectiveness Study of TRIZ.” Journal of Mechanical Design 135 (10): 1–10. doi: https://doi.org/10.1115/1.4024976
- Vargas-Hernandez, Noé, G. E. Okudan, and L. C. Schmidt. 2012. “Effectiveness Metrics for Ideation: Merging Genealogy Trees and Improving Novelty Metric.” Proceedings of the ASME 2012 International Design Engineering Technical Conferences & Computers and Information in Engineering Conference IDETC/CIE 2012, Chicago, IL. doi: https://doi.org/10.1115/DETC2012-70295
- Vargas-Hernandez, Noe, J. J. Shah, and S. M. Smith. 2010. “Understanding Design Ideation Mechanisms Through Multilevel Aligned Empirical Studies.” Design Studies 31 (4): 382–410. doi: https://doi.org/10.1016/j.destud.2010.04.001
- Verhaegen, P. A., D. Vandevenne, J. Peeters, and J. R. Duflou. 2013. “Refinements to the Variety Metric for Idea Evaluation.” Design Studies 34 (2): 243–263. doi: https://doi.org/10.1016/j.destud.2012.08.003
- Verhoeven, D., J. Bakker, and R. Veugelers. 2016. “Measuring Technological Novelty with Patent-Based Indicators.” Research Policy 45 (3): 707–723. doi: https://doi.org/10.1016/j.respol.2015.11.010
- Vermaas, P. E., and C. Eckert. 2013. “My Functional Description is Better!.” Artificial Intelligence for Engineering Design, Analysis and Manufacturing 27 (03): 187–190. doi:https://doi.org/10.1017/S089006041300019X
- Viswanathan, V. K., and J. S. Linsey. 2018. “Role of Sunk Cost in Engineering Idea Generation: An Experimental Investigation.” Journal of Mechanical Design 135 (December 2013): 121002 1–12. doi:https://doi.org/10.1115/1.4025290
- Weaver, M. B., B. W. Caldwell, and V. Sheafer. 2019. “Interpreting Measures of Rarity and Novelty: Investigating Correlations Between Relative Infrequency and Perceived Ratings.” Proceedings of the ASME Design Engineering Technical Conference (Vol. 7), Anaheim, CA. doi: https://doi.org/10.1115/DETC2019-97828
- Wilson, J. O., D. Rosen, B. A. Nelson, and J. Yen. 2010. “The Effects of Biological Examples in Idea Generation.” Design Studies 31 (2): 169–186. doi:https://doi.org/10.1016/j.destud.2009.10.003
- Youmans, R. J., and T. Arciszewski. 2014a. “Design Fixation: A Cloak of Many Colors.” In Design Computing and Cognition 12, edited by John S. Gero, 115–129. Dordrecht: Springer. doi:https://doi.org/10.1007/978-94-017-9112-0_7.
- Youmans, R. J., and T. Arciszewski. 2014b. “Design Fixation: Classifications and Modern Methods of Prevention.” Artificial Intelligence for Engineering Design, Analysis and Manufacturing 28 (02): 129–137. doi: https://doi.org/10.1017/S0890060414000043
- Zheng, X., S. C. Ritter, and S. R. Miller. 2018. “How Concept Selection Tools Impact the Development of Creative Ideas in Engineering Design Education.” Journal of Mechanical Design 140 (5): 1–11. doi:https://doi.org/10.1115/1.4039338
Appendix
A.1. Origin of the data considered in Section 4
A.1.1. Design task description
The dataset used for the comparison of the metrics derives from the outcomes of an idea generation task that is usually inserted among the educational activities of two academic courses, whose topics are focused on product design and development. More specifically, a course belongs to the academic curriculum of the master degree in Mechanical Engineering (School of Engineering), while, the other one belongs to the curriculum of the master degree in Design (School of Architecture). Both the master degree programmes are offered by the University of Florence. The outcomes of the idea generation task refer to the 2018 edition of the two courses, and the derived dataset (attributes, weights and solutions codes) has been already employed for the investigation presented in Fiorineschi, Frillici, and Rotini (Citation2020b).
The considered idea generation task belongs to the practical activities that the educational programmes entail, where students perform some exercises related to specific design tasks. It is performed at the beginning of the courses, and provides the opportunity to students to perform their first experience (assuming that most of them never tried something similar before) in generating ideas from a set of technical requirements and constraints, without the use of any specific design approach. Since the two courses are aimed at teaching design methods, the considered exercises allow students to experience benefits and disadvantages of structured design approaches (successively taught), in comparison with an idea generation activity performed ‘in a unsupported way’.
No extra-credits or other kinds of benefit are assigned to participants, as well as no-one is compelled to participate. Indeed, it is a routine exercise whose outcomes were gathered (when students explicitly agreed to do that) in an ‘anonymized’ form.
More specifically, the students have been advised that the outcomes (anonymous) would be used for specific research objectives related to design creativity research, and that the results could be partially published in international journals and/or conferences. This information has been provided to students one week before the exercise, to allow them to decide whether to authorise (or not) the authors to collect the anonymised results. Therefore, only the ideas from students that agreed to the use of their outcomes have been considered to extract the dataset. The authors do not know the percentage of those that agreed, because students were not counted during the execution of the exercise, but only the collected forms have been counted. The sample that agreed to deliver the outcomes was composed by 55 Mechanical Engineering students and 45 Industrial Design students, for a total of 100 ideas.
It is worth noticing that no particular information about the students has been gathered (e.g. gender, background, ethnological origins, etc.) as the didactical and learning objectives do not require to gather this kind of information.
The theme selected for the edition 2018 of the idea generation task was to design an innovative professional ladder. At the moment of the exercise, the students were introduced to the design task with a short presentation (ten minutes). It was performed by means of few slides containing some examples about existing ladders (see Figure ), with text supporting the presenter in introducing the task. This short presentation was aimed at providing the opportunity to clarify any doubt about the exercise and then to clarify the actual task. Anyhow, if not sufficient, it was possible for students to ask for additional explanations (privately) during the design activity.
Figure A1. Ladder examples provided to students by means of projected slides.

Two paper sheets have been administered to each student, where data about the design task (the same explained by means of the presentation mentioned above) was reported: task description, list of design requirements and few images of current ladder variants taken from the internet. Students were asked to conceive a new ladder, considering a specific list of design requirements, and to provide a graphical sketch with a short textual description of a single idea, within a time constraint of one hour. The design requirements, although defined for didactical purposes, have been provided to stimulate students to conceive realistic ideas. The time constraint of 1 h allowed students to carefully reflect about their ideas and to select the most appropriate concept to be represented in the administered form. They were allowed to use anything they considered useful (e.g. textbooks, web searches, additional sheets for sketching preliminary ideas). It is worth to notice that, in practical applications, the time needed to perform a conceptual design task can range from few minutes (e.g. a rapid scketch to show a preliminary idea) to hours, or even days (e.g. to conceive the concept by considering a specific set of real requirements and the actual available resources). It is also worth to highlight that, since the exercise was not aimed at analysing the creative behaviour of the considered groups of students, no additional experimental activities (e.g. monitoring the idea generation process) were considered. As said, in the context of this paper, the dataset is employed for the purpose presented in Section 4, i.e. comparing the orginal novelty metrics with the proposed
, without any other objective.
No particular quality screening has been performed to select the ideas for the analysis. Indeed, for the mere comparison of the novelty values, it was sufficient for the sketches to be readable (of course, all of them should represent something capable to allow a person to reach higher positions, but no problem occurred in that sense). Not all the concepts were actually interpretable by some of the evaluators. This etherogeneity was intentionally considered, to highlight that different raters can actually have very different opinions and interpretations about the same set of ideas.
A.1.2. Note about ethics concerning this work
In this paper, the actual experiment consists in the application of to the same dataset (attributes, weights and alphanumeric codes used to indentify solution variants for each attribute) used in Fiorineschi, Frillici, and Rotini (Citation2020b) to compare the values with those obtained from the application of MSNM. Accordingly, no student was involved in the work described in this paper, where the calculation of novelty values (from the mentioned dataset) has been performed by the authors themselves.
The images shown in Figure have been extracted from the set of the design outcomes produced by those students that (in the exercise performed in the mentioned 2018 edition of the two course) agreed to deliver their anonymous forms for research purposes (see Fiorineschi, Frillici, and Rotini (Citation2020b) for further details).
A.2. Novelty values obtained by levelling the weights of the attributes
Figure A2. Same graph shown in Figure , where the novelty values have been obtained by using the same weight for each attribute.
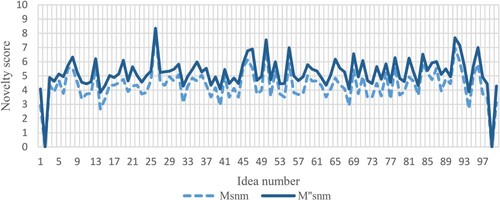
Figure A3. Same graph shown in Figure , where the novelty values have been obtained by using the same weight for each attribute.
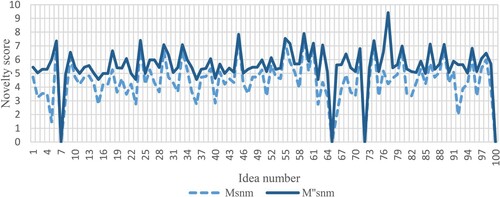
Figure A4. Same graph shown in Figure , where the novelty values obtained are calculated by using the same weight for each attribute.
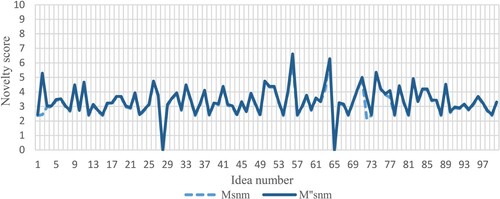
Table A1. Design requirements provided to students.