
Abstract
Background
It is unclear whether primary efficacy outcomes in plaque psoriasis clinical trials represent residual disease during treatment.
Objectives
To evaluate supplementing dichotomous efficacy with residual disease activity.
Methods
This post hoc analysis used pooled, patient-level data after tildrakizumab 100 mg (N = 616) or placebo (N = 309) treatment from reSURFACE 1/2 (NCT01722331/NCT01729754) phase 3 clinical trials of patients with moderate to severe plaque psoriasis.
Results
Median baseline Psoriasis Area and Severity Index (PASI) was 17.9 for patients receiving tildrakizumab 100 mg. At Week 12, median PASI was 2.9, whereas dichotomous PASI 90 response rate was 36.9%, and absolute PASI <5.0, <3.0, and <1.0 were 64.0%, 50.8%, and 23.3%, respectively. At Week 28, median PASI was 1.7, whereas PASI 90 response rate was 51.9%, and absolute PASI <5.0, <3.0, and <1.0 were 75.3%, 62.8%, and 38.0%, respectively. Dermatology Life Quality Index and PASI scores were correlated through Week 28 (r = 0.51, p ≤ .0001).
Conclusions
Disease activity was more reliably estimated by PASI scores than percentage PASI improvement; this may partially explain efficacy disparities between clinical trials and practice. These results suggest supplementing dichotomous PASI improvement with PASI scores and consideration of patient treatment goals could facilitate clinical decisions.
Introduction
Recently, several new agents were approved for treatment of moderate to severe plaque psoriasis. As options increase, the challenge of choosing the most appropriate treatment for each patient also grows. Before gaining experience with new treatments, dermatologists largely depend on efficacy data from clinical trials. However, the types of results available are limited and have remained unchanged for years.
The most commonly reported psoriasis efficacy measures are the Physician’s (or Investigator’s) Global Assessment (PGA or IGA) and the Psoriasis Area and Severity Index (PASI) (Citation1–3). PGA and IGA are typically assessed on simple 5- or 6-point scales and may provide limited sense of disease severity due to the small numerical scale. Additionally, neither include body surface area (BSA) affected, a key consideration when assessing disease activity (Citation2,Citation4,Citation5). PASI may better represent patients’ severity of psoriasis because it includes both plaque severity and BSA affected and has a larger scale (possible range of 0–72, although most patients fall within 0–36) (Citation6).
Efficacy outcomes can be viewed from 2 broad perspectives: relative improvement in psoriasis severity over time from treatment initiation, and residual disease activity during treatment. Generally, clinical trial endpoints are of the first type: the proportion of patients with a PGA (or IGA) score of 0 or 1, with a ≥ 2-point reduction relative to treatment initiation (Citation1), and proportion of patients achieving a specific percentage reduction in PASI score relative to treatment initiation (e.g. PASI 75, representing a 75% improvement in PASI score from baseline) (Citation7). Both are recommended by regulatory agencies as clinical trial coprimary endpoints (Citation1,Citation8). However, endpoints such as these, which present change in disease activity over time in dichotomous terms, provide limited information on patients’ disease activity both before treatment onset and during treatment. Taken together with the aforementioned limitations, these 2 efficacy measures may limit understanding of residual disease.
In addition, inter- and intra-rater variability can meaningfully influence efficacy results. In phase 3 trials of biologics in moderate to severe psoriasis, baseline PASI scores varied by up to 3 points between treatment arms (Citation9–12). Across trials, variation was as much as 8 points (baseline PASI scores ranging from 16.4–24.1) (Citation13,Citation14). Studies of inter- and intra-rater variability within single trials showed differences in PASI scores of as much as 3 points (Citation2,Citation15,Citation16), and a recent study reported inter- and intra-rater variabilities of 3.3 and 2.2 PASI points, respectively (Citation17,Citation18). Although this variability is numerically small, implications for interpretation of efficacy results could be substantial.
A PASI score is determined with 1 assessment, whereas relative PASI improvement requires 2 assessments, each of which may be affected by inter- and intra-rater variability, compounding overall error as a result. Also, rounding down PASI scores of ≤0.5 to 0 can artificially inflate complete clearance rates. This brings into question how reliably relative clinical improvement measures such as PASI 75 response rates estimate posttreatment residual disease. Variability of ±1.1 PASI score points per assessment is even pertinent to reliability of scores such as 1.0, which might otherwise be estimated by the investigator as 0.0 or 2.1 at another point during the same day. Supplementing rates of dichotomous percentage PASI improvement with absolute (i.e. static) PASI scores could offer dermatologists a measure of relative clinical improvement from treatment initiation and also an estimate of residual disease during treatment.
Finally, there is increasing interest in patients’ self-reported quality of life (QoL) pertaining to treatment decisions. A growing consensus exists that absolute PASI values ≤2 or 3 correlate with low Dermatology Life Quality Index (DLQI) values (i.e. better QoL) and might provide better benchmarks of therapeutic success than PASI responses, irrespective of baseline PASI (Citation19,Citation20). As reported in a review of infliximab clinical trials, more than half of patients with PASI ≤2.5 at Week 24 had DLQI score 0, compared with <5% of patients with PASI >5 (Citation21). These results suggest that assessing the relationship between clinical disease and QoL may be important in understanding how well one may predict changes in the other (Citation22).
In this post hoc analysis, we analyzed PASI score distributions of patient-level data pooled from 2 phase 3 trials of tildrakizumab in patients with moderate to severe psoriasis (reSURFACE 1 [NCT01722331] and reSURFACE 2 [NCT01729754]) (Citation23) to assess how disease activity varied across the study population before treatment (baseline visit) and at Weeks 4, 12, and 28 (after 1, 2, and 3 doses of drug). Additionally, we determined proportions of patients with PASI scores <1, <3, and <5 and analyzed distribution of patient-level PASI scores within categories of percentage PASI improvement (i.e. PASI 50.0–74.9, PASI 75.0–89.9, and PASI 90.0–99.9). Finally, we assessed correlation between PASI scores and DLQI values to determine how well posttreatment residual disease activity corresponded to self-assessed patient QoL.
Materials and methods
Study design
The full methods of reSURFACE 1 and reSURFACE 2 were previously described (Citation23). The studies adhered to principles of the Declaration of Helsinki and International Harmonization Guidelines for Good Clinical Practice, and were approved by an Institutional Review Board or Independent Ethics Committee. All patients provided written informed consent before any study-related procedures (Citation23).
In this report, we analyzed data from patients (≥18 years of age) with ≥10% BSA involvement, PGA score ≥3, and PASI score ≥12 who were randomized to treatment with subcutaneous tildrakizumab 100 mg at Weeks 0 and 4 and every 12 weeks thereafter, or placebo at Weeks 0 and 4. Three patients with baseline PASI scores 8.4–11.4 (protocol violators) but who met all other inclusion criteria (i.e. age, BSA involvement, PGA score) were enrolled in the study and included in this analysis.
The coprimary endpoints for both studies were proportions of patients with 75% reduction in PASI score (PASI 75) and PGA response (defined as score of 0 or 1, with ≥2-point reduction relative to baseline) at Week 12. PASI, PGA, and DLQI assessments were performed at Weeks 0, 12, and 28. All randomized patients who received ≥1 dose of assigned treatment and had ≥1 postbaseline PASI score were included in the analysis. This analysis was limited to data for Weeks 0–12 for placebo-treated patients and Weeks 0–28 for the group treated with tildrakizumab 100 mg, which is the Food and Drug Administration-approved dose (Citation24).
PASI, PGA, and DLQI assessments
Static PASI scores represent disease activity at a single point in time and include assessments of both psoriatic plaque severity and BSA involvement. PASI scores range from 0–72 (typically reported in 0.1-unit increments), with 0 representing no disease (Citation2,Citation7). Dichotomous PASI response rates were determined by calculating the percentage of patients who achieved a specific threshold percentage in their own PASI improvement from baseline (i.e. an individual’s percentage PASI score reduction of ≥50% [PASI 50 response], ≥75% [PASI 75 response], ≥90% [PASI 90 response]).
PGA represents disease severity at a single point in time, without consideration of BSA involvement. PGA was assessed using a scale of 0–5 points, with 0 representing no disease activity (Citation2,Citation3). PGA success criteria were values of 0 or 1 with ≥2-point reduction from baseline.
The DLQI is a patient-reported static QoL assessment. Scores range from 0–30, with 0 representing no impairment in QoL (Citation25).
Statistical analysis
PASI score distributions in the tildrakizumab group were compared with placebo using a 2-sample asymptotic Kolmogorov–Smirnov (KS) test at Weeks 0, 4, and 12. Absolute PASI scores were compared with percentage change in PASI from baseline in each treatment arm at Weeks 4, 12, and 28 using Pearson correlation coefficients. In these analyses, missing PASI data were imputed using last observation carried forward.
Correlations between PASI and DLQI assessments were analyzed via scatterplots and by applying linear regression models to data obtained at visits at which PASI and DLQI assessments were performed, with no imputation of missing data. Pearson correlation coefficients, 95% confidence limits for the mean predicted value, and 95% confidence limits for individual predicted values were obtained.
Results
Patients
The pooled study population included 311 patients randomized to placebo (309 included in the analysis) and 616 patients randomized to tildrakizumab 100 mg. Two patients randomized to placebo were excluded from the analysis: 1 in reSURFACE 1 did not receive any placebo and 1 in reSURFACE 2 did not have available PASI data.
Treatment groups for the pooled population were balanced in terms of demographics and baseline disease characteristics (). Mean age was 46 years, approximately 70% were men, the majority were White, and mean weight was 88.5 kg.
Table 1. Baseline disease characteristics of all patients randomized, by treatment group.
Patient-level PASI analysis
Given that patient-level PASI data were not normally distributed, median rather than mean PASI scores were used in this analysis, as the former provided a more accurate representation of central tendency in the distribution at all evaluation points.
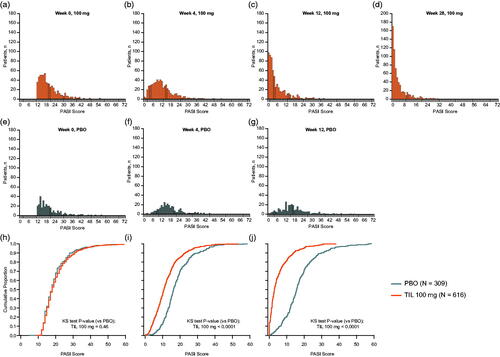
Median baseline PASI scores for the tildrakizumab 100 mg and placebo groups were 17.9 and 17.7, respectively. Over time, the distribution of PASI scores among patients receiving tildrakizumab shifted progressively toward the lower end of the scale (). Comparisons of PASI score distributions showed no statistically significant differences between active and placebo treatment arms at baseline (KS test p > .05; ), but distributions were significantly different by Week 4 and at Week 12 (all KS tests p < .0001; ).
Figure 1. PASI score distributions over time by treatment group. Missing data were imputed using last observation carried forward. Individual PASI scores were rounded to the nearest integer; 3 patients in the tildrakizumab 100-mg group had an absolute PASI score <12 at Week 0 (range 8.4–11.4; these patients were enrolled in violation of the protocol requirements but are included in the analysis). (a–g) PASI distributions in each treatment group at different time points. (h–j) Comparisons of PASI score distribution lines between treatments at different time points. KS test was used to compare the tildrakizumab 100 mg group with PBO. KS test: Kolmogorov–Smirnov test; PASI: Psoriasis Area Severity Index; PBO: placebo; TIL: tildrakizumab.
Comparison of absolute PASI scores with PASI response rates
Reductions in disease activity were observed with tildrakizumab 100 mg at all time points (). By Week 4, after 1 dose, median PASI scores were 10.6 in the tildrakizumab group and 16.2 in the placebo group, representing a median 40.7% decrease in PASI score for tildrakizumab patients (). In addition, 57.5% (354/616) of tildrakizumab-treated patients no longer met the trial entry criterion of moderate to severe plaque psoriasis by Week 4, compared with only 20.7% of placebo-treated patients ().
Figure 2. Percentages of patients with absolute PASI scores (a) PASI <1, (b) PASI <3, (c) PASI <5, and (d) PASI <12; and (e) the percentage of patients achieving PASI 75 or PASI 90 responses by treatment group at Week 4, Week 12, and Week 28. Percentages are based on the number of patients in each treatment group. Missing data were imputed using last observation carried forward. PASI: Psoriasis Area and Severity Index; PBO: placebo; TIL: tildrakizumab.
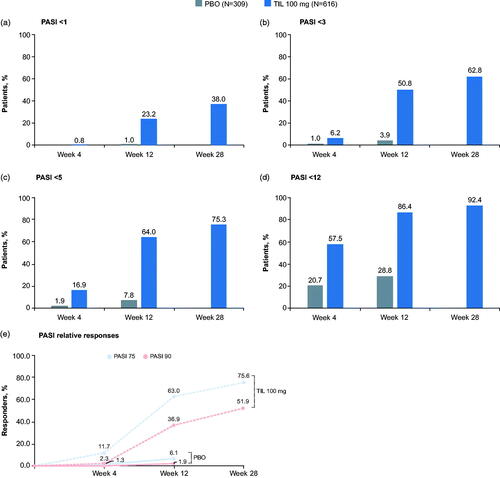
Table 2. Mean and median PASI score over time, by treatment group.
By Week 12, after 2 tildrakizumab doses, median PASI score was 2.9 (median 84.0% decrease) in the tildrakizumab 100 mg group, compared with 15.7 in the placebo group (). More than half of patients receiving tildrakizumab 100 mg reached a clinically relevant (Citation20,Citation26) PASI score of <5 (64.0%; 394/616 patients), and half (50.8%; 313/616) achieved a PASI score <3 (). Additionally, 23.2% (143/616) of patients achieved a PASI score <1 (). Among patients receiving tildrakizumab 100 mg, 63.0% (388/616) achieved PASI 75 response at Week 12 vs 6.1% (19/309) in the placebo group, and 36.9% (227/616) achieved PASI 90 response compared with 1.9% of those receiving placebo (). By Week 28, after 3 doses of study drug, median PASI score was 1.7 (90.5% median reduction) in the tildrakizumab 100 mg group ().
By Week 4, differences in the distributions of absolute PASI scores between tildrakizumab and placebo groups were already apparent, and by Week 12, were substantially different (). We also assessed distributions of PASI scores across percentage PASI improvement categories (PASI 50.0–74.9, PASI 75.0–89.9, and PASI 90.0–99.9; ). There was overlap in PASI scores between PASI improvement categories, indicating the latter did not reliably predict residual disease following treatment. For example, some patients who achieved PASI 75.0–89.9 responses had lower residual disease activity based on absolute PASI relative to others achieving PASI 90.0–99.9 responses.
Figure 3. Absolute PASI score vs percentage change in PASI from baseline in patients randomized to tildrakizumab 100 mg at (a) Week 12 and (b) Week 28. Inset figures expand the area within the red dashed lines, namely PASI score <5 and >70% decrease from baseline. Shaded areas indicate: i = PASI 90.0 response, ii = PASI 75.0–89.9 response, iii = PASI 50.0–74.9 response, and iv = PASI 0–49.9 response. Missing data were imputed using last observation carried forward. PASI: Psoriasis Area and Severity Index.
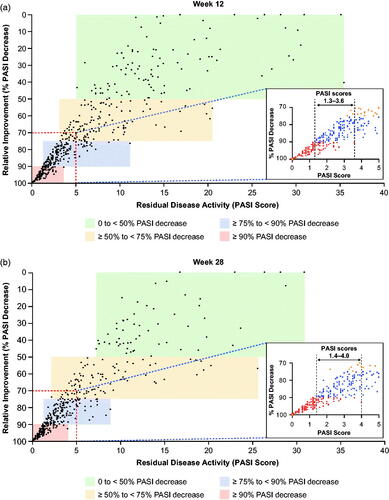
An overlap in PASI scores between categories of PASI improvement was evident as early as Week 4, when patients with PASI 90 responses had PASI scores ranging from 0.0–2.8, and those with PASI 75.0–89.9 response had scores of 1.6–10.0 ( and ). More specifically, at Week 4, 26 patients had PASI scores within the 1.6–2.8 overlap range; 4 of these patients had PASI 90 response and 22 had PASI 75.0–89.9 response. At Week 12, 165 patients had PASI scores within the PASI 90 and PASI 75.0–89.9 overlap range (1.3–3.6) ( and Citation4, and ). Similarly, at Week 28, 151 patients had PASI scores within the PASI 90 and PASI 75.0–89.9 overlap range ( and Citation4, and ). An example of the potential effect of these overlaps, in light of known intra-rater variability of 2.2 PASI points per assessment (Citation17), is shown in . For the patient in these images, a difference of −1.1 PASI score points at Week 12 would result in the patient being recorded as a PASI 90 responder.
Figure 4. Photographic comparison of PASI responses and residual disease. In this 64-year-old White female weighing 104.9 kg, PASI 75 and PASI 90 response estimates were poor predictors of residual disease during treatment. PASI score assessment during follow-up visits more reliably accurately reflected clinical observation than did percentage improvement from baseline PASI score. PASI: Psoriasis Area and Severity Index.
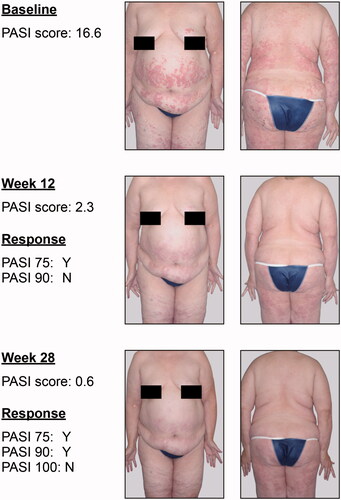
Table 3. Overlap of PASI scores in subgroups of tildrakizumab 100 mg–treated patients with PASI 50.0%–74.9% and PASI 75.0%–99.9% improvement.
Table 4. Overlap of PASI scores in subgroups of tildrakizumab 100 mg–treated patients with PASI 75.0%–89.9% and PASI 90.0%–99.9% improvement.
Comparison of absolute PASI scores with DLQI response rate
Median baseline DLQI total scores for the tildrakizumab 100 mg and placebo groups were 14.0 and 13.0, respectively. QoL in the tildrakizumab 100 mg group was better at Week 28 than at Week 12, when DLQI distributions moved toward lower values, with more patients having a DLQI total score of 0 or 1 at Week 28 vs Week 12. Overall, more patients had an improved DLQI total score of 0, 1, or 2 vs a total score of 3, 4, or 5 at both Week 12 and Week 28 (). Absolute PASI scores and DLQI total scores correlated at Week 12 (correlation coefficient = 0.48, p ≤ .0001; ); this correlation was maintained through Week 28 (correlation coefficient = 0.51, p ≤ .0001; ).
Figure 5. Scatter plots of DLQI vs PASI score at (a) Week 0 (N = 591), (b) Week 12 (N = 591), and (c) Week 28 (N = 574) in patients randomized to tildrakizumab 100 mg (observed data). DLQI: Dermatology Life Quality Index; PASI: Psoriasis Area and Severity Index.
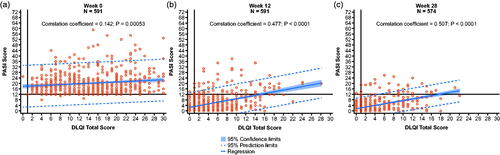
Table 5. DLQI total scores at Weeks 12 and 28 in patients randomized to tildrakizumab 100 mg.
Discussion
The ultimate goals of treatment are to reduce psoriasis disease activity and for patients’ QoL to be unaffected by their disease. Clinical trial results are typically reported as binary percent improvement (e.g. PASI 75 yes/no) relative to baseline. However, published treatment guidelines increasingly focus on residual disease following treatment (Citation20,Citation26–28), considering both this and the relative improvement to patients’ baseline disease severity as clinically important.
In the current studies, posttreatment PASI scores provided more accurate information on residual disease than clinical PASI improvements relative to treatment initiation. At Week 12, half of patients receiving tildrakizumab 100 mg achieved a PASI score <3.0; yet, in contrast, only 36.9% (227/616) achieved a PASI 90 response.
Rates of PASI response improvement are limited in their ability to inform our understanding of posttreatment residual disease: first, because baseline disease can vary substantially among patients (e.g. 2 patients with severe baseline PASI scores of 30.0 and 20.0, respectively, and posttreatment PASI scores 3.0 would have similar residual disease, although only the former would achieve a PASI 90 response); second, because PASI 50, PASI 75, and PASI 90 are intrinsically dichotomous, whereas clinical improvement occurs across a spectrum. Finally, intra-rater variability in PASI scoring, and the skewed nature of PASI score distributions, could potentially result in substantial differences in the proportions of patients who achieve a threshold response (e.g. a PASI 90 response).
The overlap in PASI scores across percentage PASI improvement categories in the tildrakizumab 100-mg group indicated that small differences in PASI scores, such as those due to known intra-rater variability of up to 2.2 points per assessment (i.e. ±1.1 in either direction), or inter-rater variability of 3.3 PASI points per assessment, could result in substantial differences in percentages of patients achieving a predetermined percentage PASI improvement from baseline (which requires 2 assessments, each of which would have a ± 1.1 score intra-rater variability). As an example, for the patient shown in , a difference in the score of −1.1 PASI points at Week 12 and Week 28, as might occur with investigator variability in PASI scoring, would result in the patient achieving PASI 90 responses at Week 12 and Week 28, respectively. Similarly, when considering the median PASI scores for all patients in the tildrakizumab 100-mg group at baseline (17.9), Week 12 (2.9), and Week 28 (1.7), the potential effect of ±1.1-point variability on PASI improvements would result in an approximately 14% difference between the lowest and highest estimated improvements (i.e. absolute PASI response could range from 76%−91% at Week 12, and 83%−97% at Week 28).
In addition, intra-rater variability may explain PASI score differences of 1.0–3.0 at baseline visits between treatment arms within large randomized clinical trials. When exploring differences between studies, mean baseline PASI scores in moderate to severe psoriasis clinical trials range from 16.4–24.1 (a variation of 8 PASI points) (Citation13,Citation14), and median baseline PASI scores range from 15–21 (6 PASI points) (Citation29,Citation30). In this context, inter-rater variability within trials may also have importance. For a patient to achieve a PASI 75 or PASI 90 response in these trials, he or she had to achieve with treatment an absolute PASI score from ≤4.0 to ≤6.0 and from ≤1.6 to ≤2.4, respectively. Therefore, overall PASI score variability of 1.0–3.0 could substantially impact PASI response rates.
A European consensus defined treatment goals in plaque psoriasis according to the change in dynamic PASI score and absolute DLQI (Citation31). Mean percentage PASI improvement correlates with DLQI in patients with moderate to severe psoriasis receiving biologic treatments, with a response of PASI ≥75 associated with a significant improvement in QoL (Citation32). However, more recently, residual disease is regarded as the preferable goal (Citation20,Citation27), and the more accurate understanding of residual disease afforded by posttreatment PASI score may allow better insights into the association between clinical efficacy and QoL. In our study, the spectrum of DLQI scores was broad even for patients with PASI scores of 0 (PASI 100 response), suggesting that neither relative clinical improvement nor residual disease adequately predict patient-reported QoL, and that both physicians’ assessments of clinical disease and patients’ views on the impact of the disease on their lives should be taken into account in treatment selection (Citation29).
There are some limitations of the analysis. First, it was post hoc in nature, and second, the analysis was limited to data from tildrakizumab clinical trials. Further analyses using datasets from other trials would be useful for validating these findings, and results from such assessments may help clinicians in everyday clinical practice.
In this pooled analysis of 2 phase 3 tildrakizumab trials, posttreatment absolute PASI scores provided more accurate information on residual disease than relative clinical PASI improvement data. Dichotomous PASI improvement outcomes may provide limited information on patients’ residual disease post treatment, and intra- and inter-rater variability in PASI assessments can have substantial effect on PASI improvement response rates. Residual disease outcomes are an important addition to the relative clinical improvement results currently used to guide treatment decisions in clinical practice.
Acknowledgements
Editorial support was provided by Veronica Porkess, PhD, and Georgia Bakirtzi, PhD, of JK Associates, Inc., part of the Fishawack Group of Companies; and Kathleen Pieper, PhD, of AlphaBioCom, LLC, and funded by Sun Pharmaceutical Industries, Inc.
Disclosure statement
K.B.G. has received research support from AbbVie, Amgen, Boehringer Ingelheim, Celgene, Eli Lilly, Janssen, Novartis; and honoraria for consultation from AbbVie; Amgen; Almirall; Boehringer Ingelheim; Bristol-Myers Squibb; Celgene; Dermira; Dermavant; Eli Lilly; Janssen; Kyowa Kirin; LEO Pharma; Novartis; Pfizer; Sun Pharmaceutical Industries, Inc; and UCB. K.R. has served as advisor and/or paid speaker for and/or participated in clinical trials sponsored by AbbVie, Affibody, Almirall, Amgen, Biogen-Idec, Boehringer Ingelheim, Celgene, Covagen, Eli Lilly, Forward Pharma, GlaxoSmithKline, Janssen-Cilag, Kyowa Kirin, LEO Pharma, Medac, Merck Sharp and Dohme, Miltenyi, Novartis, Ocean Pharma, Pfizer, Samsung Bioepis, Sanofi, Takeda, UCB, Valeant, Xenoport. J.J.C. has received research/grant support from AbbVie; Amgen; Boehringer Ingelheim; Eli Lilly; Janssen; MC2 Therapeutics; Merck and Co.; Novartis; Pfizer; Regeneron; Sandoz; Sanof; Sun Pharmaceutical Industries, Inc; UCB; and Verrica Pharmaceuticals; has served as consultant for AbbVie; Amgen; Celgene; Dermira; Eli Lilly; Novartis; Sun Pharmaceutical Industries, Inc; UCB; has worked on speakers bureau for AbbVie, Eli Lilly, Janssen, Novartis, Regeneron, Sanofi, and UCB. N.J.K. has received grants/research funding via their institution from Eli Lilly, LEO Pharma, Merck Sharp and Dohme, Pfizer, Prothena, Trevi, and UCB; honoraria as an advisory board member for AbbVie, Celgene, Eli Lilly, Genentech, GlaxoSmithKline, Immune Pharm, Janssen, Novartis, Regeneron, Sun Pharmaceuticals, Valeant; and honoraria as a speaker for AbbVie, Eli Lilly, Janssen, and Novartis. F.T.M. has received consulting fees from AbbVie, Novartis, and Sanofi/Genzyme; has worked on speakers’ bureaus for AbbVie and Horizon Pharma. Y.P. has received grant funding and honoraria as an investigator and member of advisory boards from AbbVie, Amgen, and Janssen; received research grants from Boehringer Ingelheim, Bristol-Myers Squibb, Celgene, Galderma, GlaxoSmithKline, Eli Lilly, LEO Pharma, MedImmune, Merck, Novartis, Pfizer, UCB, and Valeant; and received honoraria as a speaker for AbbVie, Janssen, Celgene, Eli Lilly, LEO Pharma, and Novartis. L.S. has served on advisory boards for AbbVie, Eli Lilly, Galderma, and Novartis; has served as an investigator for AbbVie; Amgen; Anacor; Ascend Biopharmaceuticals; Astellas; Australian Wool Innovation Limited; Blaze Bioscience; Bristol-Myers Squibb; Celgene; Dermira; Eli Lilly; Galderma; Genentech; GlaxoSmithKline; Janssen; Kythera; LEO Pharma; Merck; Novartis; Phosphagenics; Regeneron; Sun Pharmaceutical Industries, Inc; and Trius; and has received sponsored travel from Abbott, Novartis, and Janssen-Cilag. P.S.Y. has received honoraria as a consultant from AbbVie; Amgen; Celgene; Janssen; LEO Pharma; Menlo Therapeutics; Novartis; OrthoDermatologics; Pfizer Inc.; Regeneron; Sun Pharmaceutical Industries, Inc; research grants from Amgen, Celgene, Dermira, Galderma, Janssen, LEO Pharma, Lilly ICOS LLC, MedImmune, Menlo Therapeutics, Novartis, Ortho Dermatologics, Pfizer, Regeneron, Sandoz; has served on advisory boards for Amgen, Dermira, Lilly ICOS LLC; and has served as speaker for AbbVie; Amgen; Celgene; Janssen; LEO Pharma; Lilly ICOS LLC; Novartis; Ortho Dermatologics; Pfizer Inc.; Regeneron; Sanofi/Regeneron; Sun Pharmaceutical Industries, Inc. A.M.M. and S.J.R. are employees of Sun Pharmaceutical Industries, Inc. J.P. has served as statistical consultant for Sun Pharmaceutical Industries, Inc., and Kyowa Kirin Pharmaceutical Development, Inc. C.N.E. has served as a consultant to AbbVie, Celgene, Eli Lilly, Encore Dermatology, GlaxoSmithKline, LEO Pharma, Senju, and Novartis.
Additional information
Funding
References
- Langley RG, Feldman SR, Nyirady J, et al. The 5-point Investigator’s Global Assessment (IGA) Scale: a modified tool for evaluating plaque psoriasis severity in clinical trials. J Dermatolog Treat. 2015;26(1):23–31.
- Langley RG, Ellis CN. Evaluating psoriasis with psoriasis area and severity index, psoriasis global assessment, and lattice system physician’s global assessment. J Am Acad Dermatol. 2004;51(4):563–569.
- Spuls PI, Lecluse LL, Poulsen ML, et al. How good are clinical severity and outcome measures for psoriasis? Quantitative evaluation in a systematic review. J Invest Dermatol. 2010;130(4):933–943.
- Armstrong AW, Siegel MP, Bagel J, et al. From the medical board of the national psoriasis foundation: treatment targets for plaque psoriasis. J Am Acad Dermatol. 2017;76(2):290–298.
- Smith CH, Jabbar-Lopez ZK, Yiu ZZ, et al. British association of dermatologists guidelines for biologic therapy for psoriasis 2017. Br J Dermatol. 2017;177(3):628–636.
- Chow C, Simpson MJ, Luger TA, et al. Comparison of three methods for measuring psoriasis severity in clinical studies (Part 1 of 2): change during therapy in psoriasis area and severity index, static physician’s global assessment and lattice system physician’s global assessment. J Eur Acad Dermatol Venereol. 2015;29(7):1406–1414.
- Fredriksson T, Pettersson U. Severe psoriasis–oral therapy with a new retinoid. Dermatologica. 1978;157(4):238–244.
- European Medicines Agency. Guideline on clinical investigation of medicinal products indicated for the treatment of psoriasis London. 2004 [cited 2019 June 14]. Available from: https://www.ema.europa.eu/en/clinical-investigation-medicinal-products-indicated-treatment-psoriasis.
- Blauvelt A, Papp KA, Griffiths CE, et al. Efficacy and safety of guselkumab, an anti-interleukin-23 monoclonal antibody, compared with adalimumab for the continuous treatment of patients with moderate to severe psoriasis: results from the phase III, double-blinded, placebo- and active comparator-controlled VOYAGE 1 trial. J Am Acad Dermatol. 2017;76(3):405–417.
- Gordon KB, Strober B, Lebwohl M, et al. Efficacy and safety of risankizumab in moderate-to-severe plaque psoriasis (UltIMMa-1 and UltIMMa-2): results from two double-blind, randomised, placebo-controlled and ustekinumab-controlled phase 3 trials. Lancet. 2018;392(10148):650–661.
- Griffiths CE, Reich K, Lebwohl M, et al. Comparison of ixekizumab with etanercept or placebo in moderate-to-severe psoriasis (UNCOVER-2 and UNCOVER-3): results from two phase 3 randomised trials. Lancet. 2015;386(9993):541–551.
- Paul C, Lacour JP, Tedremets L, et al. Efficacy, safety and usability of secukinumab administration by autoinjector/pen in psoriasis: a randomized, controlled trial (JUNCTURE). J Eur Acad Dermatol Venereol. 2015;29(6):1082–1090.
- Langley RG, Elewski BE, Lebwohl M, et al. Secukinumab in plaque psoriasis–results of two phase 3 trials. N Engl J Med. 2014;371(4):326–338.
- Papp KA, Tyring S, Lahfa M, et al. A global phase III randomized controlled trial of etanercept in psoriasis: safety, efficacy, and effect of dose reduction. Br J Dermatol. 2005;152(6):1304–1312.
- Bożek A, Reich A. The reliability of three psoriasis assessment tools: psoriasis area and Severity Index, body surface area and Physician Global Assessment. Adv Clin Exp Med. 2017;26(5):851–856.
- Berth-Jones J, Grotzinger K, Rainville C, et al. A study examining inter- and intrarater reliability of three scales for measuring severity of psoriasis: psoriasis area and severity index, physician’s global assessment and lattice system physician’s global assessment. Br J Dermatol. 2006;155(4):707–713.
- Fink C, Alt C, Uhlmann L, et al. Intra- and interobserver variability of image-based PASI assessments in 120 patients suffering from plaque-type psoriasis. J Eur Acad Dermatol Venereol. 2018;32(8):1314–1319.
- Fink C, Alt C, Uhlmann L, et al. Precision and reproducibility of automated computer-guided Psoriasis Area and Severity Index measurements in comparison with trained physicians. Br J Dermatol. 2019;180(2):390–396.
- Puig L, Carrascosa JM, Carretero G, et al. Spanish evidence-based guidelines on the treatment of psoriasis with biologic agents, 2013. Part 1: on efficacy and choice of treatment. Spanish Psoriasis Group of the Spanish Academy of Dermatology and Venereology. Actas Dermosifiliogr. 2013;104(8):694–709.
- Puig L. PASI90 response: the new standard in therapeutic efficacy for psoriasis. J Eur Acad Dermatol Venereol. 2015;29(4):645–648.
- Reich K, Griffiths CE. The relationship between quality of life and skin clearance in moderate-to-severe psoriasis: lessons learnt from clinical trials with infliximab. Arch Dermatol Res. 2008;300(10):537–544.
- Simpson MJ, Chow C, Morgenstern H, et al. Comparison of three methods for measuring psoriasis severity in clinical studies (Part 2 of 2): use of quality of life to assess construct validity of the lattice system physician’s global assessment, psoriasis area and severity index and static physician’s global assessment. J Eur Acad Dermatol Venereol. 2015;29(7):1415–1420.
- Reich K, Papp KA, Blauvelt A, et al. Tildrakizumab versus placebo or etanercept for chronic plaque psoriasis (reSURFACE 1 and reSURFACE 2): results from two randomised controlled, phase 3 trials. Lancet. 2017;390(10091):276–288.
- Ilumya (tildrakizumab-asmn). Prescribing Information. Princeton (NJ): Sun Pharmaceutical Industries, Inc; 2018.
- Finlay AY, Khan GK. Dermatology Life Quality Index (DLQI)–a simple practical measure for routine clinical use. Clin Exp Dermatol. 1994;19(3):210–216.
- Dauden E, Puig L, Ferrandiz C, et al. Consensus document on the evaluation and treatment of moderate-to-severe psoriasis: psoriasis group of the Spanish academy of dermatology and venereology. J Eur Acad Dermatol Venereol. 2016;30(Suppl 2):1–18.
- Amatore F, Villani AP, Tauber M, et al. French guidelines on the use of systemic treatments for moderate-to-severe psoriasis in adults. J Eur Acad Dermatol Venereol. 2019;33(3):464–483.
- Gisondi P, Altomare G, Ayala F, et al. Italian guidelines on the systemic treatments of moderate-to-severe plaque psoriasis. J Eur Acad Dermatol Venereol. 2017;31(5):774–790.
- Enbrel (etanercept). Prescribing Information. Thousand Oaks (CA): Amgen; 2017.
- Cohen SB, Tanaka Y, Mariette X, et al. Long-term safety of tofacitinib for the treatment of rheumatoid arthritis up to 8.5 years: integrated analysis of data from the global clinical trials. Ann Rheum Dis. 2017;76(7):1253–1262.
- Mrowietz U, Kragballe K, Reich K, et al. Definition of treatment goals for moderate to severe psoriasis: a European consensus. Arch Dermatol Res. 2011;303(1):1–10.
- Mattei PL, Corey KC, Kimball AB. Psoriasis Area Severity Index (PASI) and the Dermatology Life Quality Index (DLQI): the correlation between disease severity and psychological burden in patients treated with biological therapies. J Eur Acad Dermatol Venereol. 2014;28(3):333–337.