
ABSTRACT
This paper addresses the concerns of the Understanding Everyday Participation project with the relationship between cultural participation and space. Here we approach the notion of space in two different but complementary ways. Our main focus is on geographical variations in participation, which we explore at the regional level in England. However, in order to do so, we begin by re-evaluating the nature of the cultural field itself and the way that this is arranged in social space. The issue of regional disparities in the funding of cultural activities and venues from the public purse has become a heated issue. Yet, in contrast to the avowedly regional focus of much cultural and creative industries policy following the advent of the first New Labour administration in 1997, issues of place have been largely overlooked in recent studies of cultural consumption, and therefore little is known about the spatial dynamics of participation practices. Using data from the UK government’s Taking Part Survey, we adopt a novel methodological approach, known as Multiple Factor Analysis, to re-examine and represent the English cultural field. Our findings reveal the hitherto underestimated importance of informal everyday cultural practices in configuring the sociology of lifestyles. Alongside and beyond the familiar North–South divide and London effect, they also indicate that the English cultural field is characterised by a complex regional geography.
Introduction
In this paper, we set out to provide new perspectives on the cultural sociology of participation by addressing the Understanding Everyday Participation (UEP) project’s core concerns with the field of cultural participation and its spatial dynamics (Miles & Gibson, Citation2016). Our principal purpose here is to explore the neglected relationship between geography and the sociology of cultural engagement. Firstly, however, and as a necessary precursor to the analysis of geographical differences in participation, we address the composition and dimensions of the cultural field itself, adopting a novel methodological approach to configuring the social space of lifestyles.
We use data from the Taking Part Survey (TPS), which is the UK government’s main source of information on the distribution and frequency of cultural participation in England (Department for Culture, Media and Sport, Citation2013). Here the choice of analytical approach is crucial because the way in which the particular set of participation indicators available in a dataset such as the TPS is mobilised will shape the contours of the cultural field it describes. Our solution to this issue is to apply a technique called Multiple Factor Analysis (MFA) (Leguina, Arancibia-Carvajal, & Widdop, Citation2015; Pagès, Citation2015). MFA builds on Multiple Correspondence Analysis (MCA), which is a form of geometric data analysis designed to explore and represent relationships among many categorical variables that is particularly associated with the school of cultural analysis established by Pierre Bourdieu (Le Roux & Rouanet, Citation2004).
In the analysis that follows, we first elaborate a new cultural map that describes the social space of lifestyles in England. This is based on an MFA of the 42 cultural participation variables in the TPS, which can be classified into five broad cultural sub-fields, and which are analysed further using a set of supplementary variables to detect lifestyle distinctions by gender, age, social class, education, ethnicity and settlement type. Adding Government Office RegionFootnote1 as a further supplementary variable to a map of the cultural field suggests that participation patterns are mostly similar across England. However, as we show in the second part of our analysis, carrying out an MFA on each of the nine government regions separately indicates some clear and hitherto unrevealed differences.
Culture, space, region
The impact of place and of contextual forces working at various spatial scales has not featured as an explanatory consideration in studies of cultural consumption, where most research has focused on the stratification of taste and participation by social position and demography. This includes Bennett et al.’s (Citation2009) influential recent account of the UK cultural field, which adopts the conceptual framing and analytical approach of Bourdieu’s influential study of cultural stratification in Distinction (Citation1984), and in the process reproduces the latter’s “methodological nationalism” (Chernilo, Citation2006; Johnson, Citation2013). Savage, Gayo-Cal, Warde, and Tampubolon (Citation2005, pp. 8–10) have, nevertheless, drawn attention to the ways in which Bourdieu’s concept of cultural capital, through the interplay of “field” and an embodied “habitus”, rooted in everyday life, is fundamentally territorial; social situations, they propose, are simultaneously physical situations and place therefore plays an important role in defining the “stakes” that attach to the cultural field. Following a similar line of argument, and drawing on the work Ernste (Citation2004) and Agnew (Citation1987), Widdop and Cutts, (Citation2012) and Cutts and Widdop (Citation2016) have recently suggested that the social interactions which form participation habits are geographically grounded in ways which include and combine the influence of local socio-demographic composition, the supply of cultural opportunities, and discourses of place and belonging, working at different spatial scales. The multi-level models they employ to investigate the factors accounting for variations in museum attendance, and subsequently participation in five other cultural activities, using TPS data from 2005, indicate a significant effect of place above and beyond the force of traditional stratification variables and individual demographic characteristics.
In this paper, we use more contemporary TPS data to consider the social dynamics of the field of cultural practices as a whole, rather than the effects of particular factors on a specific and limited subset of engagements. Our focus on “place” at the regional level only is partly for practical reasons. There are now issues of data limitation and access with working at spatial scales below this level using TPS data,Footnote2 whilst the absence of a qualitative component to the survey prevents any linked or direct engagement with debates on the fluid and constructed nature of place and scale (for a recent summary of these debates see Creswell, Citation2015). More substantively, however, the issue of regional differences in participation is of significant interest because it is at this level that much of the discussion about inequalities in the UK – including cultural inequalities – has been conducted.
The key geographical axis around which this discussion has been centred is that of the “North–South Divide”, a notion that has a long history (Jewell, Citation1994) and particular salience in England (Montgomery, Citation2015). Although the detail of this division is contested, Dorling (Citation2010) has provided evidence across several quality of life indicators of a distinctive and deepening partition, particularly since the financial crisis of 2007–2009. A number of key studies have emphasised the increasingly dominant position of London and its commuter belt within this configuration (e.g. Ertürk, Froud, & Johal, Citation2011; Social Mobility and Child Poverty Commission, Citation2016); while Savage et al.’s (Citation2015) recent account of Social Class in Britain refers to London and the South East as an “elite vortex”, sucking in the most advantaged groups, whose accumulation of cultural capital is central to this process.
In cultural policy circles, the issue of regional inequality has been raised recently in a damning critique of the inequitable distribution of public cultural funding by Arts Council England and the DCMS. Studies by Stark, Gordon, and Powell (Citation2013, Citation2014; see also Dorling & Hennig, Citation2016) again point to the overwhelming concentration of investment on London. Here, the call for a “rebalancing” of the nation’s cultural capital through a national strategy of substantial investment in regional cultural production harks back to the failure of New Labour’s regional project, which was confirmed by the rejection of devolution in the North East in 2008 and the subsequent disbanding of the Regional Development Agencies (RDAs) in 2010.
Prior to this, an emphasis on the cultural and creative industries and their development by the RDAs into drivers of economic and social regeneration was a central feature of what amounted to a significant re-organisation of regional government by the first Blair administration that came to power in 1997 (Lee, Hesmondhalgh, Oakley, & Nisbett, Citation2014; Lutz, Citation2006). Unprecedented sums were invested by the RDAs in creative industries business and skills development and in major regional capital projects in the cultural sector (Crowley, Balaram, & Lee, Citation2012) while the creation of the Regional Cultural Consortia “led to the legitimation of the region as a key contributor to the formation and implementation of cultural policy at all levels of governance” (Stevenson, McKay, & Rowe, Citation2010).
Whilst the reasons behind the failure of New Labour to rebalance Britain’s creative economy have been extensively rehearsed (Jayne, Citation2005; Lee et al., Citation2014), the issue of whether the regionalisation of the cultural policy frame is associated with differences at this level in the national patterning of cultural engagement has not been subjected to systematic exploration. The uneven and incoherent nature of policy development across the RDAs – identified as a core reason for their failure – together with studies that highlight the influence of locally specific structures and mechanisms in policy implementation and reception (e.g. Chapain & Comunian, Citation2010; Pratt, Citation2004; O’Brien & Miles, Citation2010), would suggest significant cross-regional variations in participation outcomes. Accordingly, we now turn to how the map of cultural engagement in England looks in the wake of New Labour’s regional cultural policy experiment.
Data and method
We use data from Year 8 (2012/2013Footnote3) of the TPS, which is an annual face-to-face survey of a representative sample of the English population aged 16 and above (Department for Culture, Media and Sport, Citation2013). The TPS is the principal source of quantitative information on cultural participation and stratification in England. It contains banks of questions, in varying forms, about the nature and frequency of participation in arts, sports and leisure activities, along with a range of demographic variables for a total of 9838 adults. For our analysis we used information about whether people participated or not in 42 activities, classified into five broad cultural sub-fields: 7 indicators of arts participation (e.g. playing a musical instrument, doing crafts, writing poetry); 12 for arts consumption, such as attending a concert, going to the cinema, reading literature; 6 types of sports and exercise, ranging from playing team sports to going to the gym; 8 for internet and social media use; and 9 forms of free-time activity, comprising less formal or structured pursuits, including gardening, going to the pub, shopping and watching TV. The full list of activities is shown in Table A1 (see online appendix).
Our analytical strategy involves MFA, which is a development of MCA (Leguina et al., Citation2015; Pagès, Citation2015). MCA is the method used by Bourdieu in Distinction (Bourdieu, Citation1984) for creating a multidimensional spatial representation of the relationship between variables – that is, in contrast to their reduction into dependent-independent “causal” hierarchies by conventional multivariate techniques. A common procedure found in the literature when studying the impact of grouped variables (defining cultural or lifestyle sub-fields) on the configuration of the overall social space, is to apply MCA and to sum the percentage contributionFootnote4 of each variable to the total variance separately for each dimension (see, for example, Bennett et al., Citation2009). However, the influence of each group, and so the very representation of the overall social space and its dynamics, strongly depends on the number of variables which comprise each group. In contrast, MFA provides for an a priori classification of variables into subsets, weighting them proportionally to their size to make their influence comparable. This feature of MFA is particularly convenient for our analysis in this paper because there is an imbalance in the size of variable groups, where the most represented sub-field (arts consumption) is comprised of more than twice the number of variables that go to make up the sub-fields of arts participation and of sport and exercise.
The initial step in this method consists of finding a set of weights that balance the influence of our variable groups. First, an MCA on each of our five sub-field groups is carried out separately and the eigenvaluesFootnote5 of each analysis are retained. Next, an MCA is performed on the complete dataset but is weighted, based on results from the previous step. This allows us to accurately quantify the relevance of each sub-field of participation to the social space without having to restrict the number of variables per group and without the risk of obtaining an outcome that is skewed due to an unbalanced data structure. In common with standard approaches to MCA we can then superimpose “supplementary” variables in the form of socio-demographic indicators, which do not actively contribute to the configuration of the social space but help us to interpret it (Le Roux & Rouanet, Citation2004). Here we apply indicators for gender (male or female), age (divided into nine age bands), social class (based on the seven-category version of the NS-SEC scheme), ethnicity (white or other), highest educational qualification (ranked by eight categoriesFootnote6), settlement type (urban or rural) and nine Government Office Regions.Footnote7
Analysis
A map of the English cultural field
Table A1 (see appendix),Footnote8 in which we display the basic distributions of the 42 activities, suggests broad similarities in rates of participation by region for more common activities, such as listening to music; although there also some clear variations, especially when it comes to less popular activities, like blogging or attending Jazz concerts, which are twice as popular in London than in the North. However, it is difficult to get a sense of the overall picture of participation, still less what might be driving any variation by region, from such comparisons. So, in (a), we present the first two axes of an MFA of the English cultural field; alongside this, in (b), we show how our seven supplementary variables map on to the way these activities and sub-fields array in the social space. (a and b) shows the same for the third axis.Footnote9 Here we can begin by noting that this field map shows a broadly similar distribution of participation by class, education and age to other large-scale studies using MCA; both UK-focused, such as that by Bennett et al. (Citation2009) and Miles and Sullivan (Citation2012), and other European studies (e.g. Roose, van Eijck, & Lievens, Citation2012). However the addition of a broader set of indicators and supplementary variables, using the weighted approach of MFA, provides a more subtle and differentiated picture, which in some respects is in tension with previous studies; while the weighted approach of MFA allows us, for the first time, to reveal the relative impact that different types of activity have on the social stratification of the field.
Figure 1. (a) MFA of cultural participation in England: Axes 1 and 2. Legend: circles are indicators of free time activities; triangles - arts participation; squares - arts consumption; crosses - sports and exercise; diamonds - internet and social media. Size of shape represents frequency of participation. (b) MFA of cultural participation in England: Supplementary variables, Axes 1 and 2.
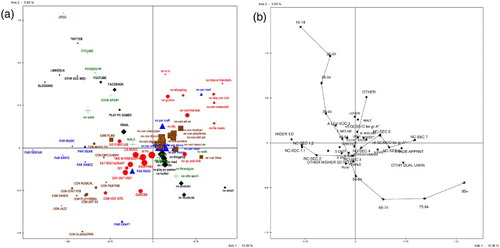
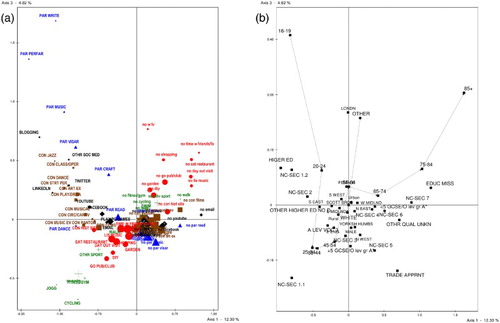
Figure 2. (a) MFA of cultural participation in England: Axes 1 and 3. Legend: circles are indicators of free time activities; triangles - arts participation; squares - arts consumption; crosses - sports and exercise; diamonds - internet and social media. Size of shape represents frequency of participation. (b) MFA of cultural participation in England: Supplementary variables, Axes 1 and 3.
In detail, the results show most clearly that on the first axis there is a division between those engaging in some form of cultural activity, located on the left-hand side of the map, and those who claim not to engage with activities in the cultural domain at all, on the right. Meanwhile, inspection of the supplementary variables indicates, firstly, that participation is strongly structured by age, class and educational level; with younger, wealthier, higher qualified people more likely to engage than those who are older, less well qualified and in working-class occupations. Class and education are also the key differentiating factors on this axis for what kinds of participation people engage in. Here we can confirm a clear association between what are generally rarer forms of arts participation and consumption (e.g. taking part in the performing arts, creative writing) and higher status groups; whilst those in the middle range of the class structure, who are less likely to have attended university, are more likely to participate in the everyday, free-time pursuits, which, because they are more common forms of participation, are located closer to the origin point between the two axes in . At the same time, all of the points making up the supplementary variable for region can be seen located along or very close to the vertical axis. This indicates that the dichotomy between engagement and disengagement and the broad structuring of participation by class and educational level is not regionally specific.
The second axis (i.e. comparing the top half with the lower half of and ) is particularly strongly structured by age. Here it can be seen that active lifestyles and engagement with social media are, unsurprisingly, associated with younger people, and more traditional cultural pursuits, such as going to the theatre, are preferred by older people. There are also familiar gender divisions at play here: females are more associated with the arts and creative activities, while males do more sport and exercise (See e.g. Katz-Gerro & Sullivan, Citation2010; Miles & Sullivan, Citation2012). However, strong intersections with ethnicity are also evident; active lifestyles and digital engagement being more associated with both males and non-white groups. Here, too, there is a regional distinction between London, located above the horizontal axis, and so associated with younger, more active, embodied and digital forms of participation, described by Prieur and Savage (Citation2013) as repositories of “emerging cultural capital”, and the rest of the English regions, clustered around the origin, which confirms the existence of a London effect.
The third axis refines this picture, identifying three distinct lifestyles, which are associated with life course stage and social status. On the upper side of this dimension are individuals who both participate in and consume music and the arts, do crafts, and are active on social media, whilst at the same time tending not to engage in informal, free-time activities. Standing in contrast to this group, located underneath the axis, are those who combine an active lifestyle – cycling, jogging, going to the gym, etc. – with enjoyment of everyday activities, such as shopping, eating out, going to the pub and DIY.Footnote10 A third group, in the upper right-hand quadrant of (a) is defined by almost complete inactivity. In terms of demographics ((b)), this axis seems to identify two different active subgroups of the middle classes to the left of the vertical axis: younger groups, in professional occupations, with degrees or studying, more likely to be female and from London, at the top of the space; in opposition to people in their thirties and forties, in business, management and intermediate occupations, more likely to be male and from parts of the North and the Midlands, in the lower left-hand quadrant. The social profile of the group of cultural inactives to the top-right of the map is elderly and lower working class.
MFA also provides a measure of the relative “contribution” of the grouped participation sub-fields to each axis; showing which dimensions of participation have the most impact on the pattern of social differentiation and, therefore, in defining the social space.Footnote11 In , we can immediately notice that free-time activities – or “everyday” forms of participation – are consistently influential in this respect, and particularly on the second and third axes. On the first axis, which is correlated most clearly with hierarchies of social class and educational level, we find that it is particularly arts consumption, and then arts participation which have most impact on the social space. They are, in this sense, more “exclusive” sub-fields because there is more separation between those who do and do not participate in these dimensions than there is between participants and non-participants in free-time activities, sport and exercise, and in the digital realm. The position is then reversed on Axis 2 – which we know is principally associated with age – where the contribution of internet and social media activity and participation in sport and exercise is considerably greater; showing that there is a bigger division between younger and older people in their relative propensities to take part in active and digital pursuits (and also in free-time activities), than there is in their tendency to engage with the arts.Footnote12 This account of the relative contributions of sub-fields to the configuration of the social space provided by MFA is important in helping us to understand the question of regional differentiations in participation, to which we now turn.
Table 1. Sub-field contributions by axis (per cent).
Regional differences
So far, we have revealed distinctions that remained quantitatively undetected by previous UK studies in the Bourdieuisan tradition; uncovering a significant ethnic dimension to lifestyle distinctions,Footnote13 while confirming that there is a regional contrast between London and the rest of England. In this section, we probe the regional dimension to cultural participation further, going onto show how these extend beyond issues of North versus South and London dominance and are linked to a number of demographic factors.
While the national map ((b) and (b)) shows that, in opposition to London, the other regions are positioned close to each other and to the origin (the intersection of the vertical and horizontal axes), we can observe there is a small degree of separation between them. However, when we carry out an MFA for each region separately, we find that the tensions between sub-fields that define the social space actually work in quite different ways in different places.
Calculating and comparing these contributions by regionFootnote14 (), on the first axis, sub-field contributions in each region are similar to the national pattern but thereafter they become increasingly discrepant. On Axis 2, an active lifestyle – cycling, jogging and going to the gym – is more important in distinguishing young people under 35 in London and the South West than elsewhere. There is also a stronger association between middle-aged people and team sports in London. The relative prominence of the free-time sub-field in London is explained by the fact that young people here spend less time shopping, with friends and family, or on days out than young people in other places; while in the South East and in Yorkshire and Humber, the importance of the free-time dimension reflects the greater propensity of older people in these places to engage in everyday practices such as gardening, socialising and eating out. In the North East and the Midlands it is the pattern of engagement or disengagement with the arts that defines the social space. In the former there is a stronger association between older people and doings crafts, whilst in the West Midlands, young people tend to visit art galleries and historic sites less often than in other parts of the country. Across the Midlands as a whole, younger people (16–25 in the West, 25–34 in the East) are also noticeably less likely than their peers in the rest of the country to read for pleasure.
Figure 3. Sub-field contribution by axis per region.
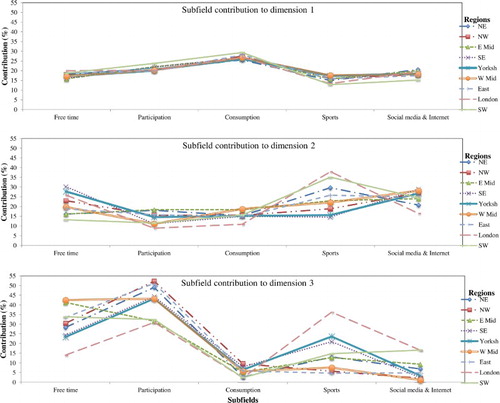
On the third axis, there is considerably more variation across the board. The North East, North West and the East of England are closest to the national pattern, although in each case the contribution of arts participation is higher than average. This seem to reflect relatively more involvement by more highly educated younger people engaging in writing, music and the visual and performing arts in these regions. Standing out most on this axis, however, is London, for the prominence, once again, of the sport and exercise sub-field, but also for the strong profile of the digital dimension here. In addition to the particular association between young people and an active lifestyle in London, what distinguishes these participants is their relatively high social status. A similar explanation lies behind the prominence of sport and exercise in Yorkshire and Humber on this axis, although here there is more involvement with swimming, cycling and the gym and less with jogging. In the case of digital participation, blogging is particularly popular among London residents of all ages and class groups. However, when it comes to Twitter and other social media, it is middle-aged, Service Class (NS-SEC 1 and 2) adults who predominate. Conversely, those in lower social class positions in London seem to engage less in digital activities than their counterparts in other areas of the country. In the South West, use of social media seems to be lower than the national average across almost all social groups.
Regional discrepancies in sub-field contributions confirm that participation is not equally distributed across regions and indicates that certain tensions have greater sensitivity to place. Analytically speaking, this leads us to suspect that the composition of regional social spaces – that is the position of different social groups in relation to participation fields – might differ significantly not only in terms of age, education and social position (as discussed above), but also according to other types of demographic distinction; in particular ethnicity, gender and settlement type.
In order to address this we can look at the “deviations”, defined as the average distance between individuals on each axis in the social space according to whether they are white or not, male or female, or live in an urban rather than a rural environment. This is a way of identifying how clear the association between a given axis and these demographic subgroups is. Le Roux and Rouanet (Citation2010) identify values of association larger than 0.5 (bold values) as worthy of attention, and so in we can note that on the first axis ethnic differences are clearer in London than elsewhere, indicating that whites are more culturally active and socially advantaged here, whilst ethnic minorities are more associated with inactivity and social disadvantage. There is also a significant urban–rural distinction on this axis in the West Midlands, indicating that higher status groups among the rural population engage more than urban groups.
Table 2. Ethnic, gender and settlement-type deviations by axis.
On the second axis, there is more variation, reflecting both ethnicity and gender divisions. In the North West, East of England and South West, younger and middle-aged members of ethnic minority groups are particularly active in using Email and Facebook, playing video games, going to the gym and team sports, while not taking part in everyday activities such as gardening or watching TV. In the West Midlands, South East and Yorkshire and Humber, there are also ethnic tensions in the field or participation but these reflect relative inactivity especially among older, disadvantaged non-white groups. Also on this axis there are regionally specific gender-based differences at play. In the North West, East Midlands and the South West, males are particularly inactive in terms of arts consumption and participation while females are more active in free-time activities. In the North East, male participation is more associated with going to the pub and some internet usage, while females are marked out by their relative lack of engagement with social media. According to the threshold for association, there are no significant differences in terms of participation by gender, place of residence or ethnicity on the third axis.
Conclusion
The relationship between cultural participation and place in the UK has rarely been subjected to systematic analysis, and then only on the basis of limited indicators of participation. In this paper, we have developed a new map of the English cultural field, taking into consideration, and establishing the multidimensional relationships between, a range of participation fields that have not been analysed in combination before, before going on to explore variations in this field at the regional level. Although it is easy to dismiss the concept of a region as an empty political artefact, it is nevertheless at this geographical scale that much cultural and creative industries policy was focused during the New Labour administrations of 1997–2010. Furthermore, it is in terms of regional demarcations, between the North and the South, and London and the provinces, that much of the debate about contemporary inequalities in the UK is couched.
We have used data from the TPS, itself a product of New Labour’s cultural policy experiment; processing the information it holds on participation in established cultural pursuits, sport and exercise, internet and social media use, and everyday free-time activities in a new way by employing the methodological approach of MFA. MFA represents a significant advancement on MCA, which is a mainstay of the Bourdieusian tradition in cultural sociology, because it controls for the distorting effects of comparing cultural sub-fields defined by unequal numbers of variables.
In this respect, our findings indicate that the free-time sub-field is both important in defining the social space and that its significance rises between axes, confirming the existence of new segmentations (Taylor, Citation2016) and revealing new forms of cultural capital not previously included in a national map of the cultural field. By performing separate regional analyses of the relative contributions of different sub-fields, we have then gone on to uncover complexities at the regional spatial scale that extend beyond simple North–South/London-provincial binaries and which capture distinctive geographical cultural characteristics. Here, the story is not just about class, education and age, the staples of research on cultural distinction, but also the ways in which place at the regional level is rendered culturally through other relationships and anchors of social identity.
From a policy perspective, our approach helps to detect salient subgroups through the dynamics of their participation, or lack of it, and the ways in which these processes differ between regions. For example, we have shown how intersections of class, age and gender work to make the fields of arts consumption and participation more divided in the North and the Midlands than elsewhere, and that digital engagement by ethnic minorities is particularly significant outside of London. Within this regional configuration, it comes as no surprise that London continues to occupy a distinctive place in the national cultural field, but our analysis provides a more developed and nuanced account of its particularity. In this respect we have found that class and ethnic divisions in cultural engagement are generally clearer here, but especially so in the use of free time, which is less socially orientated than outside the capital, and social media. Here, we can see that while affluent Londoners stand out in the degree that they engage in practices that confer emerging cultural capital, disadvantaged groups fare worse at the hands of the creative city than anywhere else.
Ultimately, however, the picture we present in this article is a complex one. Different combinations of factors are at play, creating different types of tension, in different areas of the country. This inhibits any kind of simple typology, or overall synthesis, and suggests that the development of reductive policy templates should be resisted. Rather, it calls for the further unravelling – at the sub-regional level – of the relations and mechanisms of participation, in order to recalibrate thinking about the local cultural field.
CCUT_1274356_Supplementary materials.pdf
Download PDF (465.3 KB)Additional information
Funding
Notes
1. Established by the Major administration in 1994 and consolidated into nine areas in 1998. See http://webarchive.nationalarchives.gov.uk/20160105160709/http://www.ons.gov.uk/ons/guide-method/geography/beginner-s-guide/administrative/england/2-office-regions/index.html
2. In our case, a statistical power study confirmed that TPS 2012/2013 does not have enough cases to detect a neighbourhood effect replicating Widdop and Cutts' (Citation2012) method (for more details, see Snijders and Bosker (Citation2012)).
3. The TPS data is the DCMS’ flagship instrument to measure (monthly, quarterly and annually) people’s engagement with culture and sport. Its design roughly covers seasonality of participation, involving a mix between a re-interview and fresh individuals. Data for year 8 (2012/2013) was collected on a monthly basis, starting from April 2012 and ending in March 2013.
4. Contribution (expressed as per cent) can be understood as a measure of the amount of variability due to a specific category or combination of categories.
5. A measure of the strength of associations between variables (Le Roux & Rouanet, Citation2004).
6. Higher education, other higher (no degree), A-level, vocational training (level 3); trade apprenticeship, +5 GCSE/O levels grade a*-c (level 2); <5 GCSE/O-level grade a*-c (level 1); other unknown qualifications, education missing.
7. Regional distributions by selected supplementary variable are shown in Table A2, which appears in an online appendix.
8. See online appendix.
9. MFA summarises the information of our 42 indicators on a set of fewer synthetic variables (also called axes), keeping as much of their original composition as possible. We decided to interpret the first three MFA axes (Pagès, Citation2015). They retain approximately 56% (modified rate) of total variance (eigenvalues: ,
and
).
10. Do-it-yourself. Household repairs, decorations or improvements carried out by homeowners and residents themselves rather than commercial service providers.
11. A higher contribution, in percentage terms, indicates more dispersion between participants and non-participants in the sub-field concerned, across the axis in question.
12. These results differ considerably to a standard MCA application for the same dataset. Results from comparison are available upon request.
13. Bennett et al. (Citation2009) found from their MCA that ethnicity did not substantially impact the organisation of the social space of lifestyles. However, their qualitative work with minority groups revealed differences in both practices and understandings. Using a different statistical method, Widdop and Cutts (Citation2012) also detected ethnic differences in museum attendance at a national level. TPS data from 2012/2013 reported by Consilium Research and Consultancy (Citation2014, p. 33) show marginally higher digital participation rates by ethnic minorities but our analysis indicates this relationship has a stronger effect on the configuration of the social space, especially at a regional level.
14. In order to ensure that an analysis of this nature is possible using TPS 2012/2013 data, we compared the sample distribution of our socio-demographics divided by region to distributions from the 2011 census. The unweighted dataset seems to be an adequate representation of the English population. Results upon request. For details on the TPS sampling strategy, see the technical documentation at Department for Culture, Media and Sport (Citation2013).
References
- Agnew, J. A. (1987). Place and politics: The geographical mediation of state and society. Boston, MA: Allen & Unwin.
- Bennett, T., Savage, M., Silva, E., Warde, A., Gayo-Cal, M., & Wright, D. (2009). Culture, class, distinction. London: Routledge.
- Bourdieu, P. (1984). Distinction: A social critique of the judgement of taste. London: Routledge.
- Chapain, C., & Comunian, R. (2010). Enabling and inhibiting the creative economy: The role of the local and regional dimensions in England. Regional Studies, 44(6), 717–734. doi: 10.1080/00343400903107728
- Chernilo, D. (2006). The critique of methodological nationalism: Theory and history. Thesis Eleven, 106(1), 98–117. doi: 10.1177/0725513611415789
- Consilium Research and Consultancy. (2014). Equality and diversity within the arts and cultural sector. Evidence and literature final report. Manchester: Arts Council England.
- Creswell, T. (2015). Place: An introduction (2nd ed). Hoboken, NJ: Wiley.
- Crowley, L., Balaram, B., & Lee, N. (2012). People or place? Urban policy in the age of austerity. London: The Work Foundation.
- Cutts, D., & Widdop, P. (2016). Reimagining omnivorousness in the context of place. Journal of Consumer Culture, available first online March 3, 2016. doi:10.1177/1469540516634413
- Department for Culture, Media and Sport. (2013). Taking part: The national survey of culture, leisure and sport, 2012–2013; adult and child data [computer file]. Colchester: UK Data Archive [distributor].
- Dorling, D. (2010). Persistent north-south divides. In N. M. Coe & A. Jones (Eds.), The economic geography of the UK (pp. 12–28). London: Sage.
- Dorling, D., & Hennig, B. (2016). London and the English desert – the geography of cultural capital in the UK. Cultural Trends, available first on-line February 4th. doi:10.1080/09548963.2015.1134097
- Ernste, H. (2004). The pragmatism of life in poststructuralist times. Environment and Planning A, 36(3), 437–450. doi: 10.1068/a3653
- Ertürk, I., Froud, J., & Johal, S. (2011). City State against national settlement UK economic policy and politics after the financial crisis (CRESC Working Paper Series, No 101). Milton Keynes: ESRC Centre for Research on Socio-cultural Change.
- Jayne, M. (2005). Creative industries: The regional dimension? Environment and Planning C, 23(4), 537–556. doi: 10.1068/c0453
- Jewell, H. M. (1994). The north-south divide. The origins of northern consciousness in England. Manchester: Manchester University Press.
- Johnson, M. (2013). The aesthetics of diaspora in colonial fields of power: Elite nationalism, art and the love to die for. Ethnos, 78(2), 175–199. doi: 10.1080/00141844.2012.672334
- Katz-Gerro, T., & Sullivan, O. (2010). Voracious cultural consumption. The intertwining of gender and social status. Time and Society, 19(2), 193–219. doi: 10.1177/0961463X09354422
- Lee, D., Hesmondhalgh, D., Oakley, K., & Nisbett, M. (2014). Regional creative industries policy-making under New Labour. Cultural Trends, 23(4), 217–231. doi: 10.1080/09548963.2014.912044
- Leguina, A., Arancibia-Carvajal, S., & Widdop, P. (2015). Musical preferences and technologies: Contemporary material and symbolic distinctions criticized. Journal of Consumer Culture, available first on-line May 20, 2015. doi:10.1177/1469540515586870
- Le Roux, B., & Rouanet, H. (2004). Geometric data analysis – from correspondence analysis to structured data analysis. Berlin: Springer.
- Le Roux, B., & Rouanet, H. (2010). Multiple correspondence analysis. London: Sage.
- Lutz, J. (2006). Extending the cultural research infrastructure: The rise of the regional cultural consortiums in England. Cultural Trends, 15(1), 19–44. doi: 10.1080/09548960600615913
- Miles, A., & Gibson, L. (2016). Everyday participation and cultural value. Cultural Trends, 25(3), 151–157. doi: 10.1080/09548963.2016.1204043
- Miles, A., & Sullivan, A. (2012). Understanding participation in culture and sport: Mixing methods, reordering knowledges. Cultural Trends, 21(4), 311–324. doi: 10.1080/09548963.2012.726795
- Montgomery, C. (2015). Perceptions of borders and boundaries in the north of England. In R. Hickey (Ed.), Researching northern English (pp. 345–368). Amsterdam: John Benjamins.
- O’Brien, D., & Miles, S. (2010). Cultural policy as rhetoric and reality: A comparative analysis of policy making in the peripheral north of England. Cultural Trends, 19(1–2), 3–13. doi: 10.1080/09548961003695940
- Pagès, J. (2015). Multiple factor analysis by example using R. Boca Raton, FL: CRC Press.
- Pratt, A. (2004). The cultural economy: A call for spatialized “production of culture” perspectives. International Journal of Cultural Studies, 7(1), 117–128. doi: 10.1177/1367877904040609
- Prieur, A., & Savage, M. (2013). Emerging forms of cultural capital. European Societies, 15(2), 246–267. doi: 10.1080/14616696.2012.748930
- Roose, H., van Eijck, K., & Lievens, J. (2012). Culture of distinction or culture of openness? Using a social space approach to analyze the social structuring of lifestyles. Poetics, 40(1), 491–513. doi: 10.1016/j.poetic.2012.08.001
- Savage, M., Cunningham, N., Devine, F., Friedman, S., Laurison, D., Mckenzie, L., … Wakeling, P. (2015). Social class in the 21st century. London: Pelican.
- Savage, M., Gayo-Cal, M., Warde, A., & Tampubolon, G. (2005). Cultural capital in the UK: A preliminary report using correspondence analysis (CRESC Working Paper Series, No. 4). Milton Keynes: ESRC Centre for Research on Socio-cultural Change.
- Snijders, T. A. B., & Bosker, R. J. (2012). Multilevel analysis (2nd ed.). London: Sage.
- Social Mobility & Child Poverty Commission. (2016). The social mobility index. Retrieved from https://www.gov.uk/government/uploads/system/uploads/attachment_data/file/496103/Social_Mobility_Index.pdf
- Stark, P., Gordon, C., & Powell, D. (2013). Rebalancing our cultural capital. Retrieved from http://www.gpsculture.co.uk/downloads/rocc/Rebalancing_FINAL_3mb.pdf
- Stark, P., Gordon, C., & Powell, D. (2014). The PLACE report: Policy for the lottery, the arts and community in England. Retrieved from http://www.gpsculture.co.uk/downloads/place/The_PLACE_report.pdf
- Stevenson, D., McKay, K., & Rowe, D. (2010). Tracing British cultural policy domains: Contexts, collaborations and constituencies. International Journal of Cultural Policy, 16(2), 159–172. doi: 10.1080/10286630902862646
- Taylor, M. (2016). Nonparticipation or different styles of participation? Alternative interpretations from Taking Part. Cultural Trends, 25(3), 169–181. doi: 10.1080/09548963.2016.1204051
- Widdop, P., & Cutts, D. (2012). Impact of place on museum participation. Cultural Trends, 21(1), 47–66. doi: 10.1080/09548963.2012.641775