ABSTRACT
The “pivot” to digital that many arts and culture organisations faced during the Covid-19 pandemic, revealed a complex nexus of effects that includes significant accessibility improvements (for example, for D/deaf and disabled audiences) but also a replication of many pre-existing exclusions. We argue that understanding the experiences of online audiences can help inform arts and culture organisations’ next steps in adapting to the current period of uncertainty, particularly with a cost-of-living crisis reducing leisure spending. Drawing on data from the Digital Experience survey carried out in the UK by Indigo Ltd. (2020–21), this article explores how diverse online audiences judged online theatre experiences and their potential impact on future behaviour. By analysing respondents’ quality of experience in tandem with demographic information and how participants accessed the online experience, we provide evidence showing that online participation, particularly if the experience is high quality, has the potential to increase future in-person participation.
Introduction
Recent research has identified various actual and potential advantages of increased online activities by arts and culture organisations, however, research has also suggested that the structural inequalities that traditionally affect the arts and cultural sector are also replicated online (Bakhshi et al., Citation2023; Feder et al., Citation2023; Misek et al., Citation2022; Myrczik et al., Citation2022; Walmsley et al., Citation2022). Many of these investigations have focused on quantitative data that centres on how many people from different social groups have experienced arts and culture online. However, research has so far told us relatively little about the qualitative experiences of online audiences, and their effect on future participation. We argue that a greater understanding of online audience experience can help inform arts and culture organisations’ next steps in adapting to the current period of uncertainty, with its ever-present risk of further virus variants and a cost-of-living crisis reducing leisure spending. In particular, in the context of ongoing hybridisation between our physical and digital lives, looking carefully at how online audience experience affects future behaviour can help deepen our understanding of how venue-focused and online arts and culture can complement each other in future.
This article focuses on digital access to ticketed live and on-demand activities provided by a self-selected sample of English and Scottish theatres during the pandemic. We present a quantitative analysis of the data from the “Digital Experience” survey carried out by Indigo Ltd., which includes a total of 1,213 respondents, collected between December 2020 and June 2021. It explores engagement with performances and activities via personal devices (such as smartphones and computers) among different audience demographics, focusing on quality of experience. A multi-step approach is implemented: first, an index of digital experience quality is derived by combining technical, expectation, value and artistic evaluation; second, an exhaustive CHAID (Chi-Squared Automatic Interaction Detection) tree is fitted to data to predict future intentions to attend in person and online using key demographics and the quality index. By analysing respondents’ quality of experience in tandem with demographic information, the article provides evidence that the “substitution effect” that many in the theatre sector believe exists between online and in-person arts may be a myth.
Arts, theatres and digital access. It is complicated
Pre-pandemic baseline research on digital participation across the UK, including research commissioned by Arts Council England (ACE), such as the Digital Culture 2019 survey (ACE & NESTA Citation2019), reveals great disparity among arts organisations concerning the uptake of digital technologies. Areas of digital development include: “back-end” logistics improvements, as well as the creation of video content, and an increase in serious engagement with social media platforms. While publishing pre-recorded videos was already common across culture and arts organisations in the UK, only 6% of the surveyed organisations in 2019 included live streaming in their regular activities (ACE & NESTA Citation2019, p. 24). These two activities are the main focus of our study. In parallel, academic research in digital engagement with performing arts showed that participants are seemingly younger and less wealthy than consumers of in-person arts and culture, the profiles of both often overlap. Interestingly, demographic information seems not to be the dominant factor explaining online consumption (De la Vega et al., Citation2020; p. 444. See Leguina et al., Citation2021; Mihelj et al., Citation2019; Panarese & Azzarita, Citation2020; Weingartner, Citation2021 for other sectors).
More recent studies, particularly those stemming from experiences during the Covid-19 pandemic, have often been more positive about the potential of digital technologies to enhance audience engagement. Communication technologies have allowed theatres to remain operational by streaming live and on-demand performances, breaking down barriers such as geography, economics and time constrain, and increasing access to cultural production and participation (Bakhshi et al., Citation2023; Basu, Citation2023; Brilli et al., Citation2023). Nonetheless, recent research has also often emphasised that the structural inequalities that traditionally affect the arts and cultural sector are also replicated in the digital realm (Bakhshi et al., Citation2023; Feder et al., Citation2023; Myrczik et al., Citation2022). Various UK studies of digital engagement during the pandemic presented a cautiously positive outlook for the future of online access to arts and culture. For example, The Audience Agency’s Focus on Disability brief (Citation2021) showed the importance of digital access during the pandemic and beyond for respondents from disabled groups. Indigo's Culture Restart surveys found that 80% of culturally active respondents who did not participate in online experiences before lockdowns would be willing to continue online (Indigo, Citation2021). Similar figures are reported among younger audiences by the Cultural Participation Monitor by the end of 2022 (The Audience Agency, Citation2023).
As a result of the move to digital during the pandemic, there are indications the arts sector is becoming more experienced in providing digital and hybrid culture. Moreover, there is some evidence that audiences have become more open to changes in event formats (Sargent, Citation2022, p. 83) and that the sector has seen overall increased digital participation (Misek et al., Citation2022; The Audience Agency, Citation2023. See also Sargent, Citation2022). Before the pandemic, there was some experimentation with streaming technology, but the adoption was slow and cautious (e.g. Bakhshi & Throsby, Citation2014). However, due to economic uncertainty and rising prices, people may be discouraged from attending cultural venues. In this scenario, digital technologies have enabled remote access, making it a natural substitute for in-person participation, even beyond lockdowns (e.g. Blichert, Citation2022; Puffet, Citation2022; The Audience Agency, Citation2023).
Substitution effects in the arts and culture refer to the assumption that the spread of emergent technologies necessarily occurs at the expense of dominant technologies (Corbett, Citation2001, p. 14). In our case, it would imply that online access to theatre productions via live streaming or on-demand recording will inevitably damage in-person theatre attendance (cf. Mueser & Vlachos, Citation2018). However, existing evidence suggests complementarity, i.e. new mediums do not completely replace older ones, but only act as substitutes for certain uses and contexts (Tefertiller, Citation2018, p. 393). Moreover, various studies suggest that online activities have demonstrated the potential for new uses of technology to attract new audiences to theatres and other cultural activities (Bakhshi & Throsby, Citation2014; De la Vega et al., Citation2020) and to make viewers of streaming theatre performances more likely to attend live cultural performances than regular theatre goers (AEA Consulting, Citation2016) – and to do so without interfering with other revenue streams (Nguyen et al., Citation2014).
For a substitution to occur, society must give up the symbolic importance of attending theatre in person and the industry must be willing to forgo financial benefits (Corbett, Citation2001, p. 30). Moreover, online access must offer better technical quality and value than traditional methods (Tefertiller, Citation2018, p. 392). In the absence of evidence of any of those things happening, we must also consider the possibility of “forced” substitution by audiences that cannot take part in leisure activities due to large-scale contingencies (such as the Covid-19 pandemic), personal restrictions (for example, limited mobility), or changing consumer habits in periods of economic uncertainty.
In an era of growing digital hybridity in arts and culture (Bolter, Citation2006; Couchot, Citation2002; Ortega, Citation2020), in which multiple types and formats of image, sound and text are combined in such ways it is not possible with traditional media (e.g. “online-native” performances, or physical exhibitions that include augmented reality), it becomes evident that in-person and online participation enable different roles for audiences (cf. Sargent, Citation2022). This complex landscape means that online platforms simultaneously provide a way to introduce arts and culture to new audiences, complement in-person experiences, and possibly replace them temporarily or permanently. There are various ways to explore the relationship between online and in-person participation and our research paper explores the impact of online theatre participation during Covid-19 on future in-person attendance.
Understanding the quality of theatre experiences
Models of evaluation for artistic experiences offer an interesting range of indicators which capture the quality of participation across the wide range of publicly funded events from an audience’s perspective. For example, the “Culture Counts’ evaluation system and digital platform, adopted by the Arts Council England’s Impact & Insight Toolkit (Bunting & Knell, Citation2014) includes nine quality dimensions: “presentation, distinctiveness, rigour, relevance, challenge, captivation, meaning, enthusiasm and local impact”. Such models, however, have been heavily criticised, among other things, for not allowing audience members to express “quality of experience” in their own terms. Moreover, it has been argued that standardised surveys adopted by funders are not fit to measure the wide range of events they cover, restrict audience members’ ability to express themselves, and are biased towards positive responses (see Gilmore et al., Citation2017 and Walmsley, Citation2019 for an overview).
The basic premise of research in the sector is that the quality of experiences is determined by audiences’ definition of quality based on their experience (Radbourne et al., Citation2009, p 22). For example, Evermann’s (2004) influential model of analysis, as summarised by Boerner et al. (Citation2010, p. 174), identifies four broad dimensions of quality of experiences: perceptual (spontaneous reaction to multiple audio and visual stimuli), cognitive (intellectual stimulation, interpretation and meaning), emotional (connection to the performance) and communicative (interaction with performers or other audience members). This is in line with the Independent Theatre Council’s framework for measuring audience experience, which identifies “engagement and concentration, learning and challenge, energy and tension, shared experience and atmosphere, and personal resonance and connection” as key dimensions (Jones & Pulford, Citation2009, p. 12, 14). Quality metrics for theatre and performing arts subsequently developed by Boerner et al. (Citation2010) and Chan and Au (Citation2017) adapted and operationalised Evermann’s (2004) main dimensions for specific research contexts. An alternative approach by Radbourne et al. (Citation2009), which seems to have inspired the “Culture Counts’ model, includes four alternative dimensions (p. 27): Knowledge transfer and learning, risk management, authenticity and performance interaction and collective engagement.
Research on online streaming of theatre performances has begun to reveal some of the specific factors that underpin quality assessment for remotely accessed experiences. Sullivan’s (Citation2020) analysis of the livestream of “A Midsummer Night’s Dream” at Shakespeare’s Globe in September 2016 demonstrates that liveness and connectedness are important for online audiences. The author also noted that online audiences are “more diffuse and distracted but potentially more inclusive” (p. 94). However, Sullivan (Citation2020) notices that it is also likely that the quality of their online experience is, in part, shaped by the technical quality of the streaming (p. 112). Indeed, high audio and video quality, as well as where, when and with whom experiences are accessed, all aspects that theatres have no control over, have been identified by previous research on the topic (Levordashka et al., Citation2021; Mueser & Vlachos, Citation2018; Swarbrick et al., Citation2021).
We suggest that the quality of online experiences is a key element in understanding future intentions for in-person participation, and thus audience development. If a substitution effect exists, one would expect that, alongside convenience and pricing, perceptions of high-quality online activities are associated with a decline in intentions for in-person participation. On the opposite extreme, a positive association between high-quality experiences and increasing chances to attend in person would indicate the possibility of a complementarity effect.
Research questions
Our article contributes to the extant literature on online experiences in three ways. First, it looks at the quality of online experiences of theatre during the pandemic. It constructs an index of overall quality which combines dimensions identified as relevant by research on the quality of theatre productions (Eversmann, Citation2004; Boerner et al., Citation2010; Chan & Au, Citation2017) with technical features identified as relevant by research on streaming (Mueser & Vlachos, Citation2018; Sullivan, Citation2020), while at the same time taking into account the distorting factors induced by Covid-19 (e.g. theatre closure and a completely upended funding and revenue environment). Second, in response to cultural consumption literature showing that online participation often reproduces historic structural inequalities, we study the extent to which the quality of online experiences was unequally distributed during the pandemic. Third, we look at intentions around future digital and in-person attendance through a demographic lens. To our knowledge, demographic information has so far not featured alongside indicators of how digital experiences are accessed in extant discussions of substitution and complementarity effects (Bakhshi & Throsby, Citation2014; De la Vega et al., Citation2020; Montoro-Pons & Cuadrado-García, Citation2011; Nguyen et al., Citation2014;). The inclusion of demographic data is particularly important given the already-mentioned difficulties arts producers face in the context of growing digital hybridity and economic uncertainty.
Drawing on the preceding discussion, the rest of the article addresses the following three research questions:
RQ1) Is the quality of online experiences socially stratified?
RQ2) Does the perception of quality depend on how each participant accessed the online experience?
RQ3) Can the quality of digital experiences impact audiences’ future intentions to attend in person and online?
Data
To provide answers to these questions, we have examined data from Indigo Ltd.’s Digital Experience (IDE) survey (Indigo Ltd., Citation2021), collected from attendees immediately after taking part in the participant organisations’ online activitiesFootnote1 (For details see here). This unusually rich survey of digital engagement was conducted between December 2020 and June 2021. The dataset analysed here is a sample of 1,213 respondents attending sixteen theatre productions in England and Scotland during the Covid-19 pandemic.
summarises the IDE survey’s full set of indicators for demographic information relating to online theatrical experiences. We should immediately acknowledge the limitations of this dataset. The IDE survey is a self-selected sample of people taking part in an online cultural experience, with an overrepresentation of culturally active participants. As a mirror of structural inequalities in the sector, the survey features a reduced number of participants from ethnic minorities. Cross-referencing postcode information provided by survey respondents with the Index of Multiple Deprivation (IMD) shows that most attendees resided in areas with the lowest deprivation levels (Q8-Q10). However, we should note that a large proportion of survey respondents did not provide postcode information. Moreover, the survey did not feature information on the gender, education, or income of respondents.
Table 1. Descriptive statistics.
Regarding indicators specific to Covid-19, we can observe that nearly one in five attendees saw their income negatively affected during the pandemic, and a similar number identified themselves as clinically vulnerable. Figures from show that half of the sample watched an on-demand performance, and roughly one-third attended live-streamed experiences. The rest took part in a mix of other forms of activities such as creative activities, virtual tours or lectures. The majority of these online activities cost less than £20 and were mostly experienced on desktop or laptop computers or TVs (smart or connected via Chromecast or similar). One-third of respondents took part alone, and a similar proportion participated with one other person.
To measure the quality of the digital experience, seven indicatorsFootnote2 from the IDE survey were identified and mapped into dimensions identified by previous literature (). Here we need to highlight another limitation of the data, namely, the lack of indicators relating to cognition (e.g. whether viewers clearly understood what was happening in the performance), risk (e.g. whether viewers were out of their comfort zone), and knowledge (e.g. whether viewers were familiar with the forms of online presentation that they were experiencing). Still, as shows, available indicators from the IDE survey, a study not designed for this purpose, provide a good range of measures on a broad range of quality dimensions.
Table 2. IDE quality indicators and associated dimensions from the literature.
The key variables of the analysis were those describing future attitudes to in-person and online participation, notably:
What would be your attitude to attending or visiting the cultural organisation in person as a result of watching/taking part in this online experience? Answers were coded in three categories: “I would be less likely to attend an in-person experience at this cultural organisation”, “It would make no difference”, “I would be more likely to attend”.
Which of the following would most closely describe your attitude to online culture once you are able to attend a suitable variety of in-person experiences? Answers were again coded in three categories: “I’d also engage with online culture”, “I’d be less likely to engage with culture online, but I’d still consider things that I wouldn’t otherwise have a chance”, “I’d probably not engage with culture online at all”.
We are also aware that indicators capture only a limited range of attitudes towards online participation, and cross-sectional data cannot provide insight into the nature of causal relationships at work regarding future intentions to take part in different cultural activities. Due to the way the categories are worded, it is not possible to determine from the IDE survey whether the attitudes underlying the intentions of those not changing their mind were positive or negative. Note, however, that “future intention” refers to participants’ intention to attend live performances by the same theatre that produced the online experience, meaning that regardless of potential skewness towards in-person participation after the pandemic, respondents could decide against future engagement with the theatre they are asked about. Nonetheless, we believe that these weaknesses are more than outweighed by the strengths of the IDE survey, especially its specific focus on digital experience during Covid-19, and the fact that it includes a range of variables on previous and current cultural participation that have not been explored by academic literature before.
Methods
To answer RQ1 (“Is the quality of online experiences socially stratified?”), the first part of our analysis built a summary index of overall quality by combining all available variables using principal component analysis (PCA) (Le Roux & Rouanet, Citation2004). This is a statistical technique in which initial variables are reduced to a lower number of factors that are the best linear combinations (least-square based) of the initial variables. PCA is particularly useful for the construction of synthetic indices that summarise covariance or correlation structures between variables. Factor loadings from PCA determine the number of factors to analyse and the relative importance of quality indicators in the calculation of the index. Then, we explored the distribution of the quality index across demographics. To answer RQ2 (“Does the perception of quality depend on how each participant accessed the online experience?”), we examined how each participant took part in their most recently accessed online experience. This allowed us to identify the key characteristics of participants and then examine to what extent their online experiences were unequally distributed.
To study whether attitudes towards future participation in person and online vary across demographic and contextual information (RQ3), we implemented exhaustive “Chi-Squared Automatic Interaction Detection” (CHAID) models (Kass, Citation1980) using future intentions as dependent variables. CHAID is a non-parametric decision tree algorithm, which divides survey respondents into smaller homogenous groups of the dependent variable (usually categorical) using a series of chi-square tests. Independent variables (categorical or numerical) which most strongly divide the sample in terms of the dependent variable (significative chi-square statistics) are graphically represented as tree branches. Those that are not distinct from one another are merged. This technique provides more flexibility than traditional (multinomial) regression models, as it does not rely on its statistical assumptions. An additional interesting feature of the CHAID procedure is that it performs well with moderate to large-sized samples for the implementation of intersectional approaches, i.e. “identities or positions that reflect social power structures’ (Bauer et al., Citation2021, p.1), to detect outcomes of rare occurrence.
Results and discussion
Quality index across demographics and experience descriptors
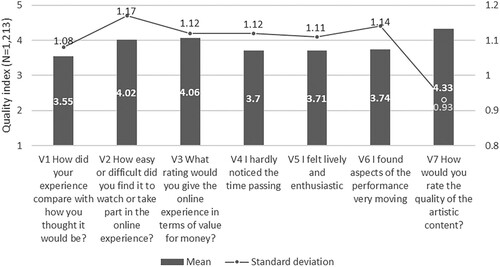
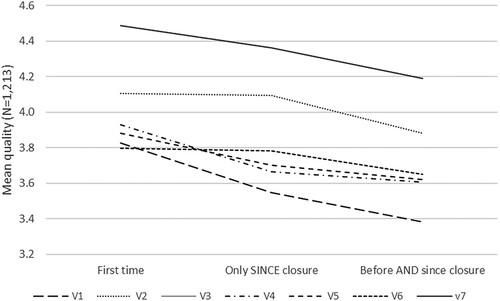
summarises descriptive statistics for the seven IDE indicators of experience quality. Although their averages do not vary dramatically, we can observe some interesting differences. Expectation (V1) shows a slightly lower average response in comparison to the rest – perhaps not surprising, considering the relative novelty of online performance. This is followed by indicators of emotional and perceptual response (V4, V5 and V6). Experiences of liveliness, entertainment and tension are, as highlighted in the extant literature, typically some of the most valued aspects of live performance (Sullivan, Citation2020; Swarbrick et al., Citation2021), however, they are also notably difficult to recreate through online media. Judgements of technical and economic value (V2 and V3) show slightly higher ratings, suggesting that despite some (perhaps technology-related) challenges, the majority of participants had a reasonably positive experience of accessing the performances online. It is also noteworthy that artistic quality (V7), in which the creative quality of the work and the quality of its technical implementation mix, has by far the highest evaluation. This relates to Sullivan’s (Citation2020, p. 94) reflections on how online audiences are more inclined to be engaged if they like the production being broadcast.
Figure 1. Mean and standard deviation for quality indicators.
Before constructing the index, we checked the bivariate correlation matrix (not shown). As expected, Pearson correlations revealed significant positive correlations among pairs of indicators. Cronbach alpha for the seven indicators is high (0.886), confirming consistency across indicators and the possibility of grouping them into a single measure. Indeed, results from PCA suggest a one-factor solution is best: this solution retains 55.1% of the total variance, and all factor loadings are higher than broadly accepted thresholds (ranging from .548 to .801). This factor, a combination of elements which have been identified by the literature as a part of the quality judgement, can therefore be interpreted as an index of the overall digital experience. Sign and strength of factor loadings mean that the more respondents value each of the individual experience indicators, the higher the overall quality of their digital experience. To sum up, factor scores using a regression method are calculated for each respondent, and to facilitate interpretation, the index is transformed into a 0–100 scale. This provides an overall index, which ranks quality from the lowest to the highest based on results from PCA. Now the index can be compared across available demographic and contextual information.
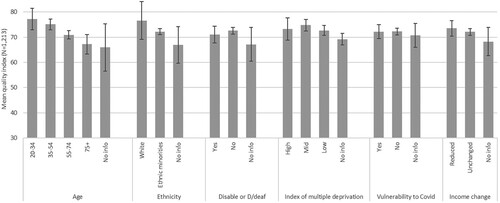
shows the average quality index across demographic variables, including 95% confidence intervals for each category. While the overall index looks fairly stable across demographics, echoing findings by Boerner et al. (Citation2010) and Chan and Au (Citation2017), it is notable that quality rates decrease for older age groups. Another trend, though not statistically significant, is the difference between quality rates reported by white and ethnic minority respondents. Looking at the individual quality indicators, it becomes apparent that the perceived lower quality by older age groups extends across all seven indicators of quality. Perhaps the technology used by these participant groups may be of a lower standard, or they do not necessarily possess sufficient skills to smoothly access online performances, both of which can potentially have an across-the-board impact on their quality of experience. In the case of ethnic minorities, trends reveal that a lower perception of quality in comparison to audiences identified as white can be attributed to difficulties regarding access (V1).
Figure 2. Mean quality index by demographics including 95% confidence interval for the mean. One-way ANOVA comparison is statistically significant for age (F-test = 5.741, p-value = 0.000).
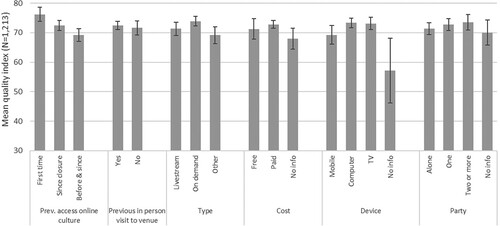
More noticeable differences in perceived quality are found when we separate participants’ previous experiences with online access (). There are also statistically significant differences in assessment of quality between those who attended pre-recorded on-demand performances and those who took part in live interactive performances or workshops (grouped as “other”): the former regard their experiences to be higher quality than the latter. Less marked drops in the perception of quality were also found among respondents using devices with smaller screens such as mobile phones or tablets as compared to those using laptops, desktops, or TVs.
Figure 3. Mean quality index by characteristics of previous and current online experience including 95% confidence interval for the mean. One-way ANOVA comparison is statistically significant for previous online attendance (F-test = 3890.672, p-value = 0.000), type of experience and (F-test = 2043.312, p-value = 0.011) device use (F-test = 7.155, p-value = 0.000).
People engaging with online arts and culture for the first time rated the quality of the online performances that they experienced higher than those who had experienced arts and culture online before Covid-19. The latter was markedly more critical when evaluating quality. shows that across all indicators of quality, audiences joining online for the first time had a considerably higher perception of quality. In particular, statistically significant differences are noted across expectations (V1) and access (V2), artistic quality perceptions (V7) and emotional response (V4 and V5). This implies that participant groups with prior experience of online arts and culture had an existing quality expectation for online performances and that perhaps the (sometimes rapidly created or repackaged) lockdown content that they experienced may not have fulfilled their expectations. This is a particularly relevant finding as it highlights that technical aspects of online performances, even for experienced audiences who might be expected to be able to look beyond this marker of quality, go hand in hand with affective reactions to online productions.
Figure 4. Mean quality indicator by Previous engagement with online culture. One-way ANOVA comparison is statistically significant for V1 (F-test = 13.623, p-value = 0.000), V2 (F-test = 4.552, p-value = 0.011), V4 (F-test = 17.751, p-value = 0.001), V5 (F-test = 4.469, p-value = 0.012) and V7 (F-test = 8.753, p-value = 0.011).
Future intentions
Moving on to participants’ future intentions, 57.4%, did not change their intention to attend in-person performances by the same organisation after taking part online, 37.6% were more likely to attend in person after experiencing arts and culture online, and 5.0% were less likely to attend in person to the organisation after experiencing arts and culture online. Regarding future online participation in arts and culture, respondents appeared to favour hybrid participation: 51.1% declared interest in online content alongside in-person attendance, 43.6% planned to reduce online participation, and 5.3% did not intend to continue participating in arts and culture online. Here it is important to remember that this variable refers to online participation in general, and is not specific to the organisation. The variable, therefore, measures general dispositions which might, or might not, have been directly influenced by respondents’ most recent online experience.
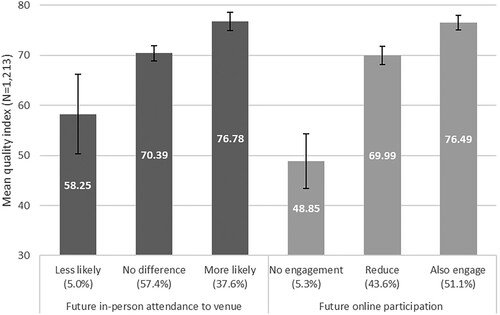
reveals that future in-person and online intentions for participation are strongly associated with quality perceptions. Those who said they were less likely to take part in the in-person activities of the theatre had a considerably lower quality experience (58.25) in comparison to the average quality for those declaring no change (70.39) and the group that was more likely to attend in person (76.78). Within the latter two groups, differences are also statistically significant. The relation between respondents’ digital experience and their intention to engage with online culture in future was similar: those who expressed an intention not to participate rated their latest online experience with the lowest average score seen in our exploration (48.85). This figure compares to an average quality of 69.99 for those expecting to reduce online participation and 76.49 for respondents planning to continue active online participation. From here it becomes clear that high-quality online programming not only increases access for those who cannot attend in person but also forms a powerful tool for attracting new participants. Although we do not currently know how long-lasting the impact of digital arts experiences is, these figures demonstrate that online participation in arts and culture has a strong impact on future decision-making about in-person participation, particularly if the online experience is negative.
Figure 5. Mean quality index by future intentions for in-person and online participation including 95% confidence interval for the mean. One-way ANOVA comparison is statistically significant for future in-person attendance (F-test = 11855.351, p-value = 0.000), and future online participation (F-test = 60.001, p-value = 0.000).
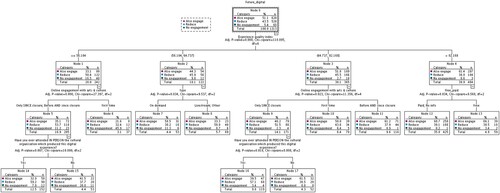
After describing online theatre audiences during the pandemic and constructing our overall quality index, we applied exhaustive CHAID trees using future intentions for participation as dependent variables, and demographic and contextual variables as well as our quality index as independent variables. These models ultimately provided us with participation profiles with dissimilar intentions to take part in in-person and online cultural activities and their main characteristics. Figures A1 and A2 in the appendix present complete trees, including nodes, splitting variables and relevant chi-square tests with Bonferroni correction. CHAID tree branches are ordered from top to bottom in terms of the strength of their association with the dependent variable. The number of branches is determined by testing which combination of categories and cut points (for the quality index) displays statistically significant differences in the distribution of the dependent variable. In other words, the procedure finds audience profiles which more clearly explain the unequal distribution of intentions for future participation. and summarise the distribution of future intentions to attend in-person at the theatre and to take part in online culture after restrictions are lifted, respectively, for all terminal nodes, i.e. participation segments or groups identified by the analysis.
Figure 6. Distribution of future in-person attendance by terminal nodes.
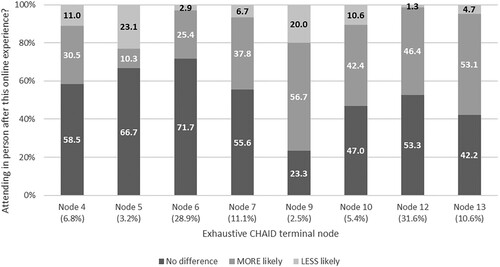
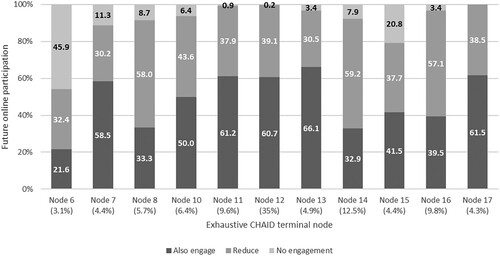
Figure 7. Distribution of future in-person attendance by terminal nodes.
Unsurprisingly, applied to future in-person attendance to the venue, the CHAID model reveals that the most important variable is the quality of previous online experience (see Figure A1). It splits the sample into three: low quality (40.59 or less), average quality (40.59-77.26) and high quality (77.26 or greater). However, analysis shows that perceived quality is not the only variable affecting future intentions. Respondents who rated their online experience as low or average quality are split by familiarity or unfamiliarity with the theatre venue (nodes 4 and 5 and nodes 6 and 7 respectively). The segment in which participation is evaluated as high quality is split between participants from ethnic minorities (node 9) and white participants. The latter is further divided between respondents self-identified as disabled and/or D/deaf (node 10) or not. Those not self-identified as disabled and/or D/deaf are finally divided by familiarity with the venue (node 12) or unfamiliarity with it (node 13). It is interesting to note that the analysis reveals that the characteristics of the online experience are not statistically significant in predicting future intention to attend in person. Also, there is no obvious inverse relationship between the intention to engage online and the intention to engage in person. This important finding suggests that a substitution effect does not exist: both in-person and online participation is perceived as being able to contribute together to a rich cultural life (Bakhshi & Throsby, Citation2014; De la Vega et al., Citation2020; Montoro-Pons & Cuadrado-García, Citation2011 Nguyen et al., Citation2014;). In other words, this data suggests a “complementarity effect”.
Once nodes and their main characteristics were identified, we focused on nodes’ future intention profiles. From it is evident that among nodes with low-quality ratings, respondents were less likely to visit the venue. In node 5 [Low quality; New to the venue] nearly one-quarter were less likely to visit the venue and for node 4 [Low quality; Familiar with venue], this figure reaches one tenth. Conversely, node 9 [High quality; Ethic minorities] and node 10 [High quality; Disabled and D/Deaf] rated their experience with the highest rating but had similarly high negative future intentions for in-person participation as the previously described groups. Interestingly, however, these nodes are also the ones that show the greatest chance of increasing their intentions to attend. Indeed, nodes 9 and 10 show an overrepresentation of participants interested in attending the organisation in future events of approximately 20% and 10% in comparison to full sample rates. This suggests that whilst quality matters, it is not by itself enough to bring those from groups traditionally excluded from arts and culture into cultural organisations, who regardless of a positive perception of quality, are more likely to feel negatively about in-person attendance due to symbolic, institutional or physical barriers. Conversely, nodes 12 [High quality; Familiar with the venue] and 13 [High quality; Not familiar with the venue] constitute what we might consider to be stereotypical theatre participants: white and without self-declared disabilities, who also had a satisfactory online experience. These are probably already loyal theatre audiences which have stayed culturally active during the pandemic and plan to remain so in the future.
Finally, the CHAID model predicting future online participation in arts and culture also reveals that the most important variable is the perceived quality of previous online experience (see Figure A2). Here, the sample is segmented by those evaluating their experience as low quality (score of 56.18 or less), below average quality (56.18-64.73), above average quality (64.73-83.16) and high quality (83.16 or greater). After perceived quality, the second most important variable in the model changes across quality ratings. Below-average quality groups are split by those watching on-demand videos (node 7) or live streams and other experiences (node 8). High-quality experience groups are differentiated by attendance to paid (node 12) or free events (node 13). Participants rating the quality of their online experience the lowest are segmented by those experiencing their first online event (node 6) and respondents with previous experience in online arts and culture (since closure or earlier). The latter group is then split between familiarity (node 14) and unfamiliarity (node 15) with the venue. Respondents rating their online experiences above average are divided in terms of their previous experience with online events. Here first timers (node 10) and those attending before and since closures (node 11) are identified as terminal nodes. Lastly, participants who declare above-average quality perception but have attended online only since the pandemic are split in terms of familiarity (node 16) or not (node 17) with the venue. Here we highlight that beyond overall quality, no other characteristics of the online experience explain future intentions to take part in online events. It is also important to note that demographic information does not affect future intentions. Here we also confirm the potential “complementary effect” (De la Vega et al., Citation2020) between digital and in-person, as again one is not determined by the other (Bakhshi & Throsby, Citation2014; Montoro-Pons & Cuadrado-García, Citation2011; Nguyen et al., Citation2014).
Future intentions for online participation in arts and culture () show that node 6 [Low quality; New to online participation] contains the highest proportion of individuals not intending to take part online. Interestingly, this was the first time these node members attended online, yet they are almost nine times less likely to return online than the sample average. Similarly, node 15 [Low quality; Familiar with online participation; New to venue] has experienced low quality in their previously attended experience. While this was the group’s first time experiencing content created by this venue, the group has taken part in online activities before; nonetheless, it is roughly four more likely to stop doing so compared to the sample average. Also considerably less likely to continue taking part in online activities is node 7 [Below average quality; Attended on demand]. This implies that a bad experience may have a long-term effect on online engagement for first-timers and seasoned participants alike. By contrast, nodes 13 [High quality; Paid activity] and 12 [High quality; Free activity] contain individuals with the highest intentions to take part online in the future. Similar results are also seen by those with above-average quality experiences in nodes 11 [Above average quality; Familiar with online participation] and node 17 [Above average quality; Online participation since pandemic; New to venue]. These are likely to be digital converts who started to attend online experiences during the pandemic and are attending activities from the venue for the first time.
Conclusion
The above research provides evidence against the perception that providing online access to theatre activities may disincentivise people from attending venues in person and so lead to a substitution effect. Rather, our research suggests the contrary: it shows that online participation, particularly if the experience is high quality, has the potential to increase in-person participation. Rather than a substitution effect, our research instead reveals the presence of a complementarity effect. Our results also reveal that the quality of online activities was perceived differently across older age groups and those with previous experience taking part online. Both audience profiles judged harshly the technical quality and emotional effect of the activity they recently took part. In turn, this reveals the interconnectedness of traditional dimensions used to quantify the quality of theatre performance (e.g. “did it emotionally affect me?”) with aspects regarding online experiences which might be out of the control of cultural organisations, such as the internet connections and hardware.
More disquieting are the findings from the CHAID models. These show that beyond the perceived quality and technical aspects of online participation, ethnic minorities and D/deaf and disabled participants show lower than average intentions to visit cultural organisations in the future. While audiences loyal to the venue continued to take part during the pandemic, the pre-pandemic barriers to in-person participation, as shown by Covid-19 research, seem to have persisted regardless of the multiplicity of positive online experiences. Accordingly, our research highlights a need for further investigations, particularly on younger and ethnic minority audience groups, to understand how online access could be used as a way to overcome cultural barriers that discourage them from going to theatres.
CHAID models also reveal that future online participation in culture, for the IDE study, is not affected by demographics. New insights from our study, however, show that a negatively perceived online experience could have an impact on future intentions to take part online. The nature of the sample did not allow us to find more nuanced differences across participant segments, or to deepen explanations about the causal relationship between current and future intentions to take part. It was also not possible to capture some well-known structural inequalities, such as gender and social class. Nonetheless, available evidence suggests that sustained online participation, complementing in-person engagement, made participants keener to continue taking part in online culture after restrictions were lifted.
Our top-level conclusion, therefore, is that high-quality digital content is not sufficient to replace in-person attendance, but should be an integral element of any wider strategy to engage audiences and improve accessibility. Of course, for financial and artistic reasons, not every activity can be offered online. However, it seems clear that holistic programming strategies that combine in-person with digital activities have great potential to improve access to arts and culture now and in the future. The fundamental challenge of how to widen, diversify, and sustain online audiences remains. However, one clear answer that can be drawn from our findings is that to be successful in the long-term digital strategies should focus on the quality of experiences.
Disclosure statement
No potential conflict of interest was reported by the author(s).
Additional information
Funding
Notes
1 The data was drawn from a series of surveys carried out by Indigo Ltd. in 2020 and 2021, separately from the authors' research project. Indigo was subsequently brought into the project as an industry partner. As a part of this agreement, they provided the research team with full access to their pre-existing survey data, and administrative support in our work of searching and interpreting the data.
2 Missing values were registered for less than 2% of the survey questions, except “value for money” (9.9%). During preliminary analysis, we tried a range of responses to cases with missing information: reassigning them to the most frequent category, excluding them from analysis, treating them as imputed missing values, and recoding in the midpoint as neutral. The outcomes of each of these options were close enough to suggest that the results were robust regardless of which alternative was used. In order to retain the largest amount of data possible, we ultimately decided to assign these cases to the neutral category and not infer a quality judgement.
References
- ACE and Nesta. (2019). Digital culture 2019. https://www.artscouncil.org.uk/digital-culture-2019 (Accessed: 17 October 2022).
- AEA Consulting. (2016). From live-to-digital, understanding the impact of digital developments in theatre on audiences, production and distribution. https://www.artscouncil.org.uk/sites/default/files/download-file/From_Live_to_Digital_OCT2016.pdf (Accessed: 17 October 2022).
- Bakhshi, H., Di Novo, S., & Fazio, G. (2023). The “great lockdown” and cultural consumption in the UK. Journal of Cultural Economics, https://doi.org/10.1007/s10824-022-09463-6
- Bakhshi, H., & Throsby, D. (2014). Digital complements or substitutes? A quasi-field experiment from the Royal National Theatre. Journal of Cultural Economics, 38(1), 1–8. https://doi.org/10.1007/s10824-013-9201-2
- Basu, P. (2023). Performance, cultural resistance and social justice: India’s creative economies since the COVID-19 pandemic. Cultural Trends, doi:10.1080/09548963.2023.2212627
- Bauer, G. R., Churchill, S. M., Mahendran, M., Walwyn, C., Lizotte, D., & Villa-Rueda, A. A. (2021). Intersectionality in quantitative research: A systematic review of its emergence and applications of theory and methods. SSM - Population Health, 14, 100798. https://doi.org/10.1016/j.ssmph.2021.100798
- Blichert, F. (2022). Will movie theaters ever make a full comeback in the age of streaming?. Android authority. https://www.androidauthority.com/movie-theaters-vs-streaming-services-3093835 (Accessed: 24 May 2023).
- Boerner, S., Jobst, J., & Wiemann, M. (2010). Exploring the theatrical experience: Results from an empirical investigation. Psychology of Aesthetics, Creativity, and the Arts, 4(3), 173–180. https://doi.org/10.1037/a0018460
- Bolter, J. D. (2006). The desire for transparency in an era of hybridity. Leonardo, 39(2), 109–111. https://doi.org/10.1162/leon.2006.39.2.109
- Brilli, S., Gemini, L., & Giuliani, F. (2023). Theatre without theatres: Investigating access barriers to mediatized theatre and digital liveness during the COVID-19 pandemic. Poetics, 97, https://doi.org/10.1016/j.poetic.2022.101750
- Bunting, C., & Knell, J. (2014). Measuring quality in the cultural sector: The Manchester metrics pilot: Findings and lessons learned. https://www.artscouncil.org.uk/advice-and-guidance-library/impact-and-insight-toolkit (Accessed: 17 October 2022).
- Chan, M. K., & Au, W. T. (2017). Developing and validating a theater experience scale. Empirical Studies of the Arts, 35(2), 169–193. https://doi.org/10.1177/0276237416662737
- Corbett, K. J. (2001). The big picture: Theatrical moviegoing, digital television, and beyond the substitution effect. Cinema Journal, 40(2), 17–34. http://doi.org/10.1353/cj.2001.0001
- Couchot, E. (2002). Digital hybridisation. Convergence: The International Journal of Research Into New Media Technologies, 8(4), 19–28. https://doi.org/10.1177/135485650200800403
- De la Vega, P., Suarez-Fernández, S., Boto-García, D., & Prieto-Rodríguez, J. (2020). Playing a play: Online and live performing arts consumers profiles and the role of supply constraints. Journal of Cultural Economics, 44(3), 425–450. https://doi.org/10.1007/s10824-019-09367-y
- Eversmann, P. (2004). The experience of the theatrical event. In V. A. Cremona, P. Eversmann, H. van Maanen, W. Sauter, & J. Tulloch (Eds.), Theatrical events: Borders, dynamics, frames (pp. 139–174). Rodopi.
- Feder, T., McAndrew, S., O’Brien, D., & Taylor, M. (2023). Cultural consumption and COVID-19: Evidence from the taking part and COVID-19 cultural participation monitor surveys. Leisure Studies, 38–55. https://doi.org/10.1080/02614367.2022.2088831
- Gilmore, A., Glow, H., & Johanson, K. (2017). Accounting for quality: Arts evaluation, public value and the case of “Culture Counts”. Cultural Trends, 26(4), 282–294. https://doi.org/10.1080/09548963.2017.1382761
- Indigo Ltd. (2021). Culture restart toolkit. Indigo Ltd. https://www.indigo-ltd.com/culture-restart-toolkit (Accessed: 17 October 2022).
- Jones, C., & Pulford, R. (2009). “Capturing the audience experience: A handbook for the theatre”, http://itc-arts-s3.studiocoucou.com/uploads/helpsheet_attachment/file/23/Theatre_handbook.pdf (Accessed: 17 October 2022).
- Kass, G. V. (1980). An exploratory technique for investigating large quantities of categorical data. Applied Statistics, 29(2), 119. https://doi.org/10.2307/2986296
- Leguina, A., Mihelj, S., & Downey, J. (2021). Public libraries as reserves of cultural and digital capital: Addressing inequality through digitalization. Library & Information Science Research, 43, https://doi.org/10.1016/j.lisr.2021.101103
- Le Roux, B., & Rouanet, H. (2004). Geometric Data Analysis – From Correspondence Analysis to Structured Data Analysis. Springer.
- Levordashka, A., Fraser, D. S., Gilchrist, I. D., Hill, P., & Chadwick, E. (2021). Sensing the audience in digital streaming: Lessons from a global pandemic. Extended Abstracts of the 2021 CHI Conference on Human Factors in Computing Systems, 1–6.
- Mihelj, S., Leguina, A., & Downey, J. (2019). Culture is digital: Cultural participation, diversity and the digital divide. New Media & Society, 21(7), 1465–1485. https://doi.org/10.1177/1461444818822816
- Misek, R., Leguina, A., & Manninen, K. (2022). Digital access to arts and culture. Final report. https://digiaccessarts.org/wpcontent/uploads/2022/06/Digital-Access-Report-FINAL.pdf
- Montoro-Pons, J. D., & Cuadrado-García, M. (2011). Live and prerecorded popular music consumption. Journal of Cultural Economics, 35(1), 19–48. https://doi.org/10.1007/s10824-010-9130-2
- Mueser, D., & Vlachos, P. (2018). Almost like being there? A conceptualisation of live-streaming theatre. International Journal of Event and Festival Management, 9(2), 183–203. https://doi.org/10.1108/IJEFM-05-2018-0030
- Myrczik, E., Heikkilä, R., Kristensen, N. N., & Purhonen, S. (2022). “Missing out on culture – or not: Danes and Finns’ cultural participation, the pandemic, and cultural policy measures”. Nordisk Kulturpolitisk Tidsskrift, 25(2), 1–24. https://doi.org/10.18261/nkt.25.2.4
- Nguyen, G. D., Dejean, S., & Moreau, F. (2014). On the complementarity between online and offline music consumption: The case of free streaming. Journal of Cultural Economics, 38(4), 315–330. https://doi.org/10.1007/s10824-013-9208-8
- Ortega, É. (2020). Media and cultural hybridity in the digital humanities. PMLA/Publications of the Modern Language Association of America, 135(1), 159–164. https://doi.org/10.1632/pmla.2020.135.1.159
- Panarese, P., & Azzarita, V. (2020). Online cultural participation in Italy. The role of digital media across generations. In Q. Gao, & J. Zhou (Eds.), Human Aspects of IT for the Aged Population. Healthy and Active Aging (Vol. 12208, pp. 643–660). Springer International Publishing.
- Puffet, N. (2022). Cost of living ‘jeopardising theatres and festivals’, MPs told. https://www.artsprofessional.co.uk/news/cost-living-jeopardising-theatres-and-festivals-mps-told (Accessed: 24 May 2023).
- Radbourne, J., Johanson, K., Glow, H., & White, T. (2009). The audience experience: Measuring quality in the performing arts. International Journal of Arts Management, 11(3), 16–29. https://www.jstor.org/stable/41064995
- Sargent, A. (2022). COVID-19 and the global cultural and creative sector: Two years of constant learning – new foundations for a new world. Centre for cultural value. https://www.culturehive.co.uk/CVIresources/covid-19-global-cultural-creative-sector-two-years-constant-learning/ (Accessed: 24 May 2023).
- Sullivan, E. (2020). Live to your living room: Streamed theatre, audience experience, and the Globe’s A Midsummer Night’s Dream, participations, vol 17, no 1, https://www.participations.org/Volume%2017/Issue%201/7.pdf (Accessed: 17 October 2022).
- Swarbrick, D., Seibt, B., Grinspun, N., & Vuoskoski, J. K. (2021). Corona concerts: The effect of virtual concert characteristics on social connection and kama muta. Frontiers in Psychology, 12, 648448. https://doi.org/10.3389/fpsyg.2021.648448
- Tefertiller, A. (2018). Media substitution in cable cord-cutting: The adoption of web-streaming television. Journal of Broadcasting & Electronic Media, 62(3), 390–407. https://doi.org/10.1080/08838151.2018.1451868
- The Audience Agency. (2021). Focus on disability. Feelings of societally imposed restriction are old news for audiences with disabilities, which is perhaps partly why they have been so ready to embrace culture differently through COVID. https://www.theaudienceagency.org/evidence/cultural-participation-monitor/focus-on-disability (Accessed: 24 May 2023).
- The Audience Agency. (2023). The audience agency’s Covid-19 participation monitor. https://www.theaudienceagency.org/evidence/cultural-participation-monitor (Accessed: 24 May 2023).
- Walmsley, B. (2019). Audience Engagement in the Performing Arts: A Critical Analysis. Palgrave Macmillan.
- Walmsley, B., Gilmore, A., O’Brien, D., & Torreggiani, A. (2022). Culture in crisis impacts of Covid-19 on the UK cultural sector and where we go from here. https://www.culturehive.co.uk/CVIresources/culture-in-crisis-impacts-of-covid-19// (Accessed: 17 October 2022).
- Weingartner, S. (2021). Digital omnivores? How digital media reinforce social inequalities in cultural consumption. New Media & Society, 23(11), 3370–3390. https://doi.org/10.1177/1461444820957635
Appendix
Figure A1. Exhaustive CHAID tree for future in person attendance to cultural organisation.
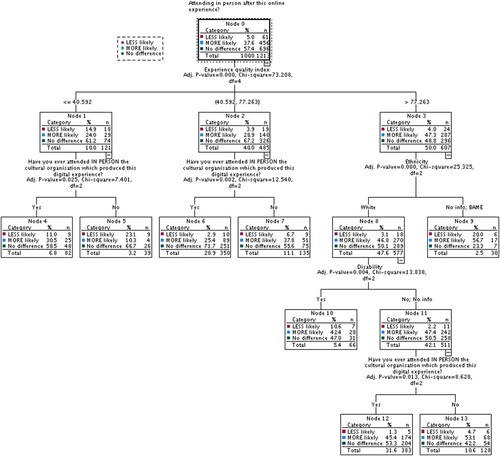
Figure A2. Exhaustive CHAID tree for future online participation in arts and culture.