
Abstract
Purpose: To establish a training data set of digital images and to investigate the scoring criteria and dose assessment of the dicentric assay within the European network of biodosimetry (RENEB), a web based scoring inter-comparison was undertaken by 17 RENEB partners.
Materials and methods: Two sets of 50 high resolution images were uploaded onto the RENEB website. One set included metaphases after a moderate exposure (1.3 Gy) and the other set consisted of metaphases after a high dose exposure (3.5 Gy). The laboratories used their own calibration curves for estimating doses based on observed aberration frequencies.
Results: The dose estimations and 95% confidence limits were compared to the actual doses and the corresponding z-values were satisfactory for the majority; only the dose estimations from two laboratories were too low or too high. The coefficients of variation were 17.6% for the moderate and 11.2% for the high dose. Metaphases with controversial results could be identified for training purposes.
Conclusions: Overall, the web based scoring of the two galleries by the 17 laboratories produced very good results. Application of web based scoring for the dicentric assay may therefore be a relevant strategy for an operational biodosimetry assistance network.
Introduction
In the last few years, a number of strategies have been devised to prepare for the possibility of a large-scale radiological event (Jaworska et al. Citation2015). With biological dosimetry assays it is possible to identify individuals who need extensive medical care due to severe irradiation, and to distinguish these from the ‘worried well’ who may show similar, non-specific symptoms without having received high doses. In such large-scale radiological scenarios the capacity of a few biodosimetry laboratories would be overwhelmed. As a consequence, biodosimetry networking has been recognized as a sensible and important element of emergency response strategies (Yoshida et al. Citation2007; Blakely et al. Citation2009; Di Giorgio et al. Citation2000; Wilkins et al. Citation2015). Now, with the EU project RENEB, a European Network of Biodosimetry of 23 organizations (19 employing the dicentric assay) from 16 European countries (Wojcik et al. Citation2010; Kulka et al. Citation2012; Kulka et al. Citation2015), this element is being established across Europe.
One important step in establishing an operational network is to ensure that all partners provide comparable dose assessments (Beinke et al. Citation2013). The dicentric assay as the most validated biodosimetry tool is highly standardized (ISO Citation2008, Citation2014) and much experience and data is available (Romm et al. Citation2009; IAEA Citation2011). Nevertheless, it is well known that laboratories have differences in their calibration curves which might be caused by modifications in the culturing procedures, slide preparation and scoring criteria (IAEA Citation2011; Roy et al. Citation2012). Therefore it is recommended that each laboratory should use its own calibration curve, to keep the uncertainties for dose assessment as low as possible (Wilkins et al. Citation2008). However, an acceptable technique for a real or simulated emergency dosimetry is to despatch blood samples to the participating biodosimetry service laboratories and request for individual doses. These kinds of inter-comparisons are recommended by the International Organization for Standardization (ISO Citation2008, Citation2014) and were performed in the RENEB project, also.
The web based scoring of digital images of metaphases is a new approach for inter-comparisons which was recently developed for the dicentric assay (Livingston et al. Citation2011; Garcia et al. Citation2013; Romm et al. Citation2014; Sugarman et al. Citation2014). The use of digital images presents the opportunity to compare very precisely the scoring criteria of the participating laboratories, which is one source of variation and uncertainty. Furthermore, one lesson from recent emergency situations, including from the 9/11 response in the US (although radiation was not involved), is that in the chaos of the initial aftermath, organizational aspects such as blood shipment may be very restricted (Rohmer Citation2010). Thus it is easy to see that in some circumstances, digital images could initially be the only way of sharing the workload.
Using automated microscopy, internet and e-mail, this kind of exercise can be performed very easily, quickly and worldwide without costs for shipment or consumables. With different image series several scoring criteria might be investigated and the performance of the network validated. Here we report the findings from an exercise with digital images simulating a moderate and a high dose exposure within RENEB and how digital images can be used for training purposes to harmonise the scoring criteria.
Materials and methods
To establish the two galleries with a moderate and a high dose, digital images of Giemsa stained first mitoses in high resolution mode (1280 * 1024 pixels) were captured automatically with the Autocapture software module of MetaSystems (Altlussheim, Germany) in 63x magnification (with oil immersion). The aim was to obtain information about the scoring criteria and dose assessment of the participating laboratories. It was not possible to use 50 images arbitrarily generated from a slide of an irradiated sample, as many images could be rejected for several reasons and the remaining images would be difficult to compare. Therefore, it was decided to establish the galleries manually, using only good quality images that were selected by an experienced scorer. To simulate the yield of dicentrics and the correlated Poisson distribution of dicentrics for a moderate and high dose exposure, the parameters of a pooled dose effect curve established in the frame of the MULTIBIODOSE project (multidisciplinary biodosimetric tools to manage high scale radiological casualties, www.multibiodose.eu) were applied. The parameters of the pooled curve (by means: C = 0.0016, alpha = 0.0269, beta = 0.0588, by weighted means C = 0.0004 ± 0.0064; alpha = 0.0195 ± 0.0353 and beta = 0.0562 ± 0.0192) described the dose effect curve Y = C + alpha *D + beta *D2 (Y = aberration frequency, D = dose [Gy], C = spontaneous frequency, alpha = linear and beta = quadratic coefficient) for dicentric chromosomes of eight European laboratories after gamma irradiation (Romm et al. Citation2012) ().
Table 1. Distribution of dicentric chromosomes (dic) in a web-based gallery of images and the resulting doses using a pooled curve (m: means, w: weighted means).
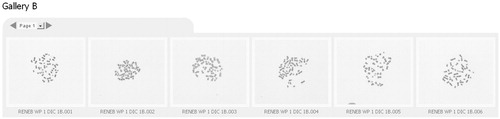
The images were provided to the participating laboratories using a gallery creator software (www.jalbum.net) to integrate two galleries in the RENEB homepage in the form of a browser based web application for examining microscopy images. The images in the galleries were 800 × 705 pixels in size, with 256 grey levels. Access to the images was available with free standard internet browsers (); no special software was needed by the partners for image analysis. The results were recorded with a standardized scoring sheet.
Figure 1. The digital images were provided on the RENEB website in the form of a browser based web application for examining microscopy images with two magnification steps (here: the thumbnails).
The instruction was to analyse all images (if possible) and to perform dose estimations (including 95% confidence interval) with the gamma dose effect curve of the laboratory. Each laboratory used its standard procedures, including one or more scorers per institution analysing the images. The inter-individual variation in cell proliferation was handled as in conventional scoring and only first mitoses were analysed. The dose estimations were calculated with the free software CABAS 2.0 (Deperas et al. Citation2007) and/or Dose Estimate 4.2 or 5.1 (Ainsbury et al. Citation2010). One laboratory (lab 6) used its own statistical program, which had an impact on the resulting 95% percent confidence interval. Therefore, to harmonise the data, only confidence limits are presented here with the corresponding dose estimations, calculated with Dose Estimate V 5.2 according to ‘Method A’ IAEA 2001 (IAEA Citation2001), including combined Poisson and calibration curve errors. The calculations took into account how the calibration curve was constructed, i.e. based on the yield of dicentrics or on the yield of dicentrics plus centric rings. The observed distribution of dicentrics was tested with CABAS 2.0 for any indication of overdispersion, applying the u-test (u-values greater than ±1.96 indicate overdispersion).
The coefficients of variation (CV), trueness and z-values were calculated as described by Di Giorgio (2000) and the IAEA manual 2011 (IAEA Citation2011). The CV was used to compare the reproducibility of the dose assessments. CV was defined as the ratio SR/x* in percent, where SR is the robust standard deviation and x* is the robust average. The trueness was calculated as (x*– true dose)/x* and represents the closeness between the robust estimated average dose of the 17 laboratories and the applied true dose. In addition, for each estimated dose a z-score of the dose was calculated. The z-score allows one to classify participants' results as satisfactory (|z| < 2), questionable (2 < |z| < 3) and unsatisfactory (|z| > 3).
Results
Participating laboratories were given three months to analyse the 100 digital images in the galleries before the results were presented for the first time at the general assembly of the RENEB project. In total, data and dose assessments from 17 laboratories were available (Supplemental data). The data from two laboratories were missing, one had no time for scoring and the other was not operational because of changes in the staff.
The scoring results of Gallery A (moderate dose) are given in . The observed numbers of dicentric chromosomes were in the range of 5–9, which was within the expected 95% confidence interval of the Poisson distribution (). All aberration frequencies were close to the mean, only two laboratories showed increased z values (lab 9 questionable and lab 4 unsatisfactory; , Gallery A). The CV was 12.4% and the trueness 7.6%, the robust average yield was 0.13 ± 0.02 dic/cell, which included the yield of 0.12 dic/cell used for establishing the gallery.
Figure 2. The observed dicentric frequency of each laboratory of Gallery A and B is provided ± SE (error bar) and the corresponding robust average (solid line) ± 1.96 SR (dotted lines)
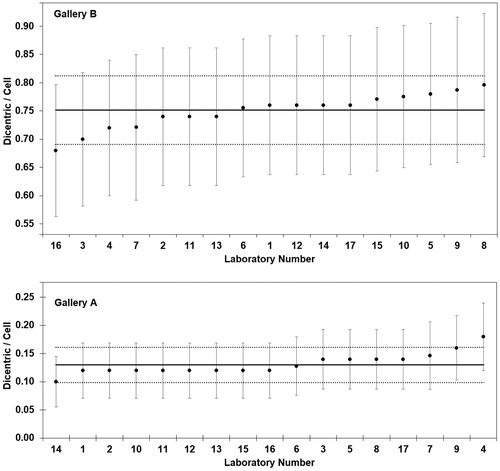
The scoring results of Gallery B (high dose) are provided in . The observed numbers of dicentric chromosomes per 50 cells were in the range of 34–39, which was within the expected 95% confidence interval of the Poisson distribution (). The robust average yield was 0.75 ± 0.03 dic/cell, which was in close agreement with the yield of 0.76 dic/cell used for establishing the gallery. The CV was 4.1% and the trueness 1.1%. Only the low dicentric yield observed by lab 16 received a questionable z scoring (, Gallery B).
The laboratories used their own calibration curves () for estimating doses from the observed aberration frequencies. Most calibration curves were based on the frequency of dicentric chromosomes, but some included dicentric chromosomes plus centric rings (cR). In general, the dose effect relationship of dicentric chromosomes (and cR) can be described by a linear quadratic curve Y = C + alpha * D + beta * D2. The parameters of the dose effect curves are given in and the resulting dose effect curves are provided in . One laboratory (lab 5) did not have its own gamma ray curve and used the curve described in the IAEA manual (IAEA Citation2001). The curves showed some variation, but there was no evidence of any inhomogeneity (p > 0.99) and, therefore, the parameters of a mean weighted (w) curve for dicentrics (, Dic w) or dicentrics and cR (, Dic & cR w) were calculated. The resulting mean curves were almost identical to the mean curve (, w-MBD) established during the EU project MULTIBIODOSE (MBD).
Figure 3. The gamma dose effect curves of the participating laboratories are based on the frequency of dicentric chromosomes (dic; solid line) or are based on dicentric chromosomes and centric rings (dic & cR; broken line). The weighted mean curves of dicentrics (bold solid line), dicentrics and centric rings (bold broken line) and of the MULTIBIODOSE project (bold dotted line) lie approximately in the center of the curves. The steepest (lab 2) and the flattest curve (lab 9) include dic & cR.
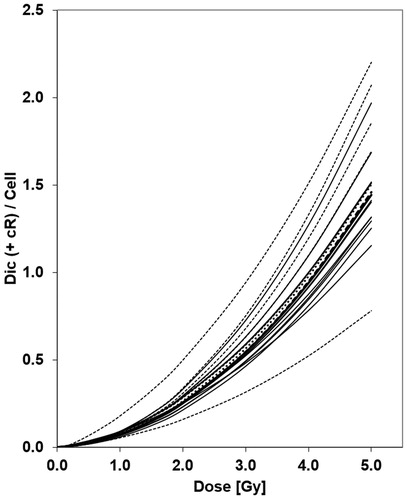
Table 2. Parameters of the gamma dose effect curves of the participating laboratories and the resulting weighted mean curves.
In Gallery A, the dose estimations and 95% confidence limits were compared to a dose of 1.30 Gy. The corresponding z-values (, , Gallery A) were satisfactory for the majority (dose range: 1.08–1.73); only lab 2 (questionable; z > 2) and lab 9 (unsatisfactory; z > 3) showed some deviation from the mean (, Gallery A). The CV was 16.7% and the trueness 1.4%, the robust average ± SR = 1.32 ± 0.22 Gy was very close to the dose 1.30 Gy used for establishing the gallery.
Figure 4. The estimated dose of each laboratory for Gallery A and B is provided together with the 95% confidence interval (error bar) and the corresponding robust average (solid line) ± 1.96 SR (dotted lines)
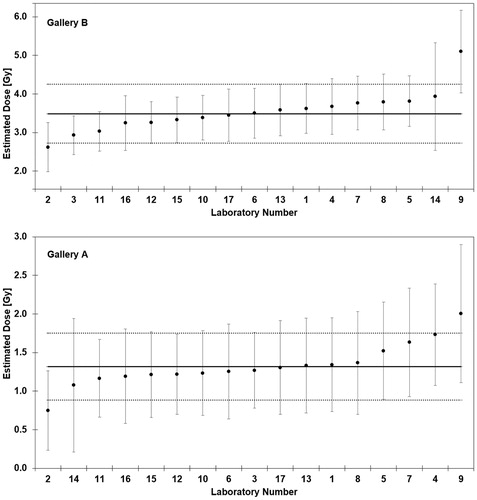
Table 3. Dose estimations with lower (LCI) and upper (UCI) 95% confidence intervals and the resulting z-score values for moderate and high dose images.
The dose estimates and confidence limits of Gallery B were compared to a dose of 3.51 Gy. The corresponding z-values (, , Gallery B) were satisfactory in most cases (dose range 2.93–3.81); only the data of lab 2 (questionable; z > 2.0) and lab 9 (unsatisfactory; z > 3) showed some deviation (, Gallery B). The CV was 11.2% and the trueness −0.7%; the robust average ± SR = 3.49 ± 0.39 Gy was in agreement with the dose of 3.51 Gy used for establishing the gallery.
Discussion
The participating laboratories had sufficient time to score the images of this pilot exercise. However, in a real accidental or emergency situation, the time needed for a dose assessment will be judged as the accuracy and efficiency of dicentric scoring and is also one criterion for the reliability of the network partners.
The web based scoring of the two galleries provided very good results and demonstrated its suitability for inter-comparisons and validation of scoring criteria. The observed yields of dicentrics were very homogenous and most images were interpreted in the same way. The subsequent dose assessments were very close to the actual doses for most of the laboratories. Scoring of only 50 cells is a scoring strategy developed for large scale radiation events (Lloyd et al. Citation2000; Beinke et al. Citation2013). Despite the small cell number analysed, the error of the dose estimation should be in the range of ±0.5 Gy, which was the case for the satisfactory results in both galleries.
Those laboratories that scored the lowest or highest dicentric yield reported good dose estimates when using their own calibration curves. Lab 2, which had the steepest dose effect curve, tended to underestimate the doses and lab 9, which had the flattest dose effect curve, overestimated the doses. As this laboratory provided similar dicentric yields, it could be possible that the scoring criteria changed over time. If these two laboratories had performed their dose estimations with one of the weighted means curves, the results would have been satisfactory. If one laboratory scores slides or images prepared by another laboratory, a closer look at the differences of their calibration curves might be helpful. Perhaps the variations in the dose assessments could be reduced, if a common calibration curve for RENEB should exist. Another possible strategy could be that all laboratories were to use the calibration curve of the slide preparing laboratory, a reduction in the variation of the results could be achieved, if the dicentric yields were similar. The CV is 11.2% in Gallery B when all laboratories used their own calibration curves and 2.2% when the w-MBD curve was applied to all aberration data. In the meantime lab 2 had consolidated its calibration curve (y = 0.001 ± 0.0004 + 0.0527 ± 0.0075*D + 0.065 ± 0.003* D2) and received now improved dose estimations of 1.01 (0.48–1.53) and 2.99 (2.44–3.54) Gy which provided satisfactory z-values in both cases.
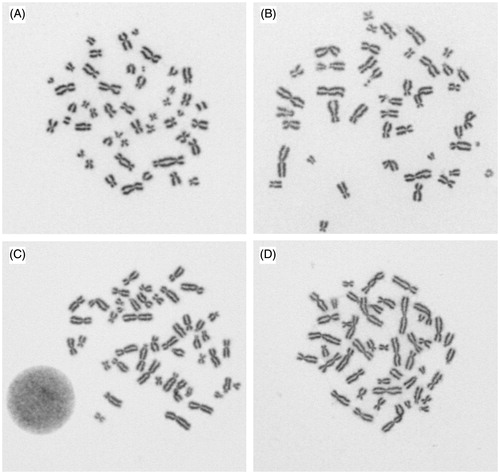
A closer inspection of the scored dicentrics reveals information about which dicentrics were accepted by all participating scorers and which images produced inconsistent scoring results. Whenever the morphology of the dicentric followed the classical models, an agreement was reached, but sometimes the centromere was in a terminal position, or there were two chromosomes touching or overlapping or chromatids were twisted. Some examples of images with controversial results are shown in .
Figure 5. Four digital images from Gallery B evaluated by 17 laboratories, A: 17 x two dicentrics, B: 3 x rejected, 8 x no dicentric, 6 x one dicentric, C: 6 x no dicentric, 11 x one dicentric, D: 1 x rejected, 12 x one dicentric, 4 x two dicentrics
Within this exercise two galleries were tailored for dicentric scoring and dose estimation with two different doses. However, there are further aspects that could be investigated in more detail with this new method: which cells will be rejected or accepted, which are, e.g. the scoring criteria of centric rings, acentric fragments or acentric rings. Other training modules could focus on partial body exposures, different radiation qualities or the impact of slide preparations at different doses. For example, one centric ring in Gallery B was identified by 13 labs and not accepted by one lab; two labs observed two rings and one lab three rings. As centric rings are included in several calibration curves, further investigations seem warranted. Not so important for dose estimations were acentric fragments, which showed a greater variation (Gallery A: range = 1–10, mean: 4.8 ± 2.3; Gallery B: range = 5–25, mean = 12.4 ± 4.2).
The criteria for the rejection of cells seem to be heterogeneous. In Gallery A 15 laboratories analysed all 50 cells, but one lab rejected three cells and one lab nine cells, and two cells were rejected twice. In Gallery B 11 labs analysed 50 cells, three labs rejected one cell, one lab two cells, one lab three cells and one lab seven cells. From these seven cells two cells were rejected by three labs and one cell (no dicentric inside) by five labs, in a few cases evaluated as incomplete (45 centromeres). As differences in rejection criteria may have some impact on the resulting frequency of dicentrics (Yoshida et al. Citation2007; Ainsbury et al. Citation2009), further investigations about the applied criteria regarding cell rejection and/or dicentric selection in not preselected image galleries would be of great interest to make a step forward in harmonization of the method.
With the knowledge of experienced scorers a wide field of training modules could be developed as a training program for new staff members or as appropriate quality assurance and quality control program within individual laboratories or RENEB as network. Hereby the use of modules with digital images could be extended to other assays like, e.g., the cytokinesis-block micronucleus (CBMN) assay, the fluorescence in-situ hybridization (FISH) translocation assay, the γ-H2AX foci assay and the premature chromosome condensation (PCC) assay.
Conclusions
Overall, the web based scoring of the two galleries by the 17 laboratories provided very good agreement between the participants. The new method offers the opportunity to obtain a quick overview of the scoring criteria and dose assessment performance of network partners. Furthermore, this method can be an excellent tool for training new staff members or new laboratories who want to join a network, in correctly identifying all the different kinds of dicentrics and performing biological dosimetry accurately and consistently.
Acknowledgements
We are very grateful for the extremely efficient and thoughtful technical and organizational work performed by Martina Denk, Claudia Kerscher and Jennifer Reis.
This work was supported by the EU within the 7th Framework Programme [EURATOM grant agreement No. 295513].
Disclosure statement
The authors report no conflicts of interest. The authors alone are responsible for the content and writing of the paper.
Related Research Data
References
- Ainsbury EA, Livingston GK, Abbott MG, Moquet JE, Hone PA, Jenkins MS, Christensen DM, Lloyd DC, Rothkamm K. 2009. Interlaboratory variation in scoring dicentric chromosomes in a case of partial-body x-ray exposure: implications for biodosimetry networking and cytogenetic ‘triage mode’ scoring. Radiat Res. 172:746–752.
- Ainsbury EA, Lloyd DC. 2010. Dose estimation software for radiation biodosimetry. Health Phys. 98:290–295.
- Beinke C, Barnard S, Boulay-Greene H, De Amicis A, De Sanctis S, Herodin F, Jones A, Kulka U, Lista F, Lloyd D, Martigne P, et al. 2013. Laboratory intercomparison of the dicentric chromosome analysis assay. Radiat Res. 180:129–137.
- Blakely WF, Carr Z, Chu MC, Dayal-Drager R, Fujimoto K, Hopmeir M, Kulka U, Lillis-Hearne P, Livingston GK, Lloyd DC, et al. 2009. WHO 1st consultation on the development of a global biodosimetry laboratories network for radiation emergencies (BioDoseNet). Radiat Res. 171:127–139.
- Deperas J, Szluinska M, Deperas-Kaminska M, Edwards A, Lloyd D, Lindholm C, Romm H, Roy L, Moss R, Morand J, Wojcik A. 2007. CABAS: a freely available PC program for fitting calibration curves in chromosome aberration dosimetry. Radiat Prot Dosim. 124:115–123.
- Di Giorgio M, Barquinero JF, Vallerga MB, Radl A, Taja AR, Seoane A, De Luca J, Oliveira MS, Valdivia P, Lima OG, Lamadrid A, Mesa JG, et al. 2000. Biological dosimetry intercomparison exercise: an evaluation of triage and routine mode results by robust methods. Radiat Res. 175:638–649.
- Garcia O, Di Giorgio M, Vallerga MB, Radl A, Taja MR, Seoane A, De Luca J, Stuck Oliveira M, Valdivia P, Lamadrid AI, Gonzalez JE, Romero I, et al. 2013. Interlaboratory comparison of dicentric chromosome assay using electronically transmitted images. Radiat Prot Dosim. 154:18–25.
- International Atomic Energy Agency. 2001. IAEA Technical Report Series No. 405, Cytogenetic Analysis for Radiation Dose Assessment, Vienna, Austria: IAEA.
- International Atomic Energy Agency. 2011. Cytogenetic dosimetry: applications in preparedness for and response to radiation emergencies EPR Biodosimetry 2011. Vienna, Austria: IAEA.
- International Organization for Standardization. 2008. ISO 21243: Radiation protection-performance criteria for laboratories performing cytogenetic triage for assessment of mass casualties in radiological or nuclear emergencies.
- International Organization for Standardization. 2014. ISO 19238: Radiation protection - performance criteria for service laboratories performing biological dosimetry by cytogenetics. Geneva, Suisse: ISO.
- JAlbum. Stockholm, Sweden. Available from: http://jalbum.net. Accessed 16 July 2016.
- Jaworska A, Ainsbury EA, Fattibene P, Lindholm C, Oestreicher U, Rothkamm K, Romm H, Thierens H, Trompier F, Voisin P, et al. 2015. Operational guidance for radiation emergency response organizations in Europe for using biodosimetric tools developed in EU MULTIBIODOSE project. Radiat Prot Dosim. 164:165–169.
- Kulka U, Ainsbury L, Atkinson M, Barnard S, Smith R, Barquinero JF, Barrios L, Bassinet C, Beinke C, Cucu A, et al. 2015. Realising the European network of biodosimetry: RENEB-status quo. Radiat Prot Dosim. 164:42–45.
- Kulka U, Ainsbury L, Atkinson M, Barquinero JF, Barrios L, Beinke C, Bognar G, Cucu A, Darroudi F, Fattibene P, et al. 2012. Realising the European Network of Biodosimetry (RENEB). Radiat Prot Dosim. 151:621–625.
- Livingston GK, Wilkins RC, Ainsbury EA. 2011. Pilot website to support international collaboration for dose assessments in a radiation emergency. Radiat Meas. 46:912–915.
- Lloyd DC, Edwards AA, Moquet JE, Guerrero-Carbajal YC. 2000. The role of cytogenetics in early triage of radiation casualties. Appl Radiat Isot. 52:1107–1112.
- MULTIBIODOSE. Multi-disciplinary biodosimetric tools to manage high scale radiological casualties (MULTIBIODOSE), project funded within the 7th EU Framework Programme. Available from: http://www.multibiodose.eu/index.htm. Accessed 29 February 2016.
- RENEB. Realizing the European Network of Biodosimetry (RENEB), founded within the 7th EU framework EURATOM Fission Programme as Coordination Action (CSA-CA) project. Available from: http://www.reneb.eu/index.htm. Accessed 29 February 2016.
- Rohmer A. 2010. Emergency Response in Large-Scale Disasters: Lessons Learned and Implications for National Security. Government Honors Papers. Paper 9. Available from: http://digitalcommons.conncoll.edu/govhp/9. Accessed 19 April 2016.
- Romm H, Oestreicher U, Kulka U. 2009. Cytogenetic damage analysed by the dicentric assay. Ann Ist Super Sanita. 45:251–259.
- Romm H, Ainsbury E, Bajinskis A, Barnard S, Barquinero JF, Beinke C, Puig-Casanovas R, Deperas-Kaminska M, Gregoire E, Kulka U, et al. 2012. The dicentric assay in triage mode as a reliable biodosimetric scoring strategy for population triage in large scale radiation accidents. Glasgow: IRPA13. Available from: http://www.irpa.net/page.asp?id = 54606 TS2.C3. Accessed 29 February 2016.
- Romm H, Ainsbury E, Bajinskis A, Barnard S, Barquinero JF, Barrios L, Beinke C, Puig-Casanovas R, Deperas-Kaminska M, Gregoire E, et al. 2014. Web-based scoring of the dicentric assay, a collaborative biodosimetric scoring strategy for population triage in large scale radiation accidents. Radiat Environ Biophys. 53:241–254.
- Roy L, Grégoire E, Gruel G, Roch-Lefevre S, Voisin P, Busset A, Martin C, Voisin P. 2012. Effect of lymphocytes culture variations on the mitotic index and on the dicentric yield following gamma radiation exposure. Radiat Prot Dosim. 151:135–143.
- Sugarman SL, Livingston GK, Stricklin DL, Abbott MG, Wilkins RC, Romm H, Oestreicher U, Yoshida MA, Miura T, Moquet JE, et al. 2014. The internet’s role in a biodosimetric response to a radiation mass casualty event. Health Phys. 106:S65–S70.
- Wilkins RC, Romm H, Kao TC, Awa AA, Yoshida MA, Livingston GK, Jenkins MS, Oestreicher U, Pellmar TC, Prasanna PG. 2008. Interlaboratory comparison of the dicentric chromosome assay for radiation biodosimetry in mass casualty events. Radiat Res. 169:551–560.
- Wilkins RC, Beaton-Green LA, Lachapelle S, Kutzner BC, Ferrarotto C, Chauhan V, Marro L, Livingston GK, Boulay Greene H, Flegal FN. 2015. Evaluation of the annual Canadian biodosimetry network intercomparisons. Int J Radiat Biol. 91:443–451.
- Wojcik A, Lloyd D, Romm H, Roy L. 2010. Biological dosimetry for triage of casualties in a large-scale radiological emergency: capacity of the EU member states. Radiat Prot Dosim. 138:397–401.
- Yoshida MA, Hayata I, Tateno H, Tanaka K, Sonta S, Kodama S, Kodama Y, Sasaki MS. 2007. The chromosome network for biodosimetry in Japan. Radiat Meas. 42:1125–1127.