
 ?Mathematical formulae have been encoded as MathML and are displayed in this HTML version using MathJax in order to improve their display. Uncheck the box to turn MathJax off. This feature requires Javascript. Click on a formula to zoom.
Abstract
Purpose: In order to ensure efficient use of medical resources following a radiological incident, there is an urgent need for high-throughput time-efficient biodosimetry tools. In the present study, we tested the applicability of a gene expression signature for the prediction of exposure dose as well as the time elapsed since irradiation.
Materials and methods: We used whole blood samples from seven healthy volunteers as reference samples (X-ray doses: 0, 25, 50, 100, 500, 1000, and 2000 mGy; time points: 8, 12, 24, 36 and 48 h) and samples from seven other individuals as ‘blind samples’ (20 samples in total).
Results: Gene expression values normalized to the reference gene without normalization to the unexposed controls were sufficient to predict doses with a correlation coefficient between the true and the predicted doses of 0.86. Importantly, we could also classify the samples according to the time since exposure with a correlation coefficient between the true and the predicted time point of 0.96. Because of the dynamic nature of radiation-induced gene expression, this feature will be of critical importance for adequate gene expression-based dose prediction in a real emergency situation. In addition, in this study we also compared different methodologies for RNA extraction available on the market and suggested the one most suitable for emergency situation which does not require on-spot availability of any specific reagents or equipment.
Conclusions: Our results represent an important advancement in the application of gene expression for biodosimetry purposes.
Introduction
Biodosimetry is the dose estimation after exposure to ionizing radiation by means of changes in biological endpoints, or biomarkers. In the case of large-scale radiological accidents, when physical dosimetry is not available for all the individuals at risk of exposure, these biomarkers could be used to identify individual exposure cases. In such situations triage decisions have to be undertaken as soon as possible in order to split the exposed subjects into different categories, depending on their exposure dose and radiosensitivity (Etherington et al. Citation2011). This kind of triage will allow focusing the medical staff and facilities only on those subjects in need of urgent medical assistance (Etherington et al. Citation2011).
As of yet, the gold standard method in biodosimetry is the detection of dicentric chromosomes in peripheral blood lymphocytes (dicentric chromosome assay or DCA) (International Atomic Energy Agency Citation2011). Besides its sensitivity to doses down to 20 mGy when scoring a few thousands metaphases (Lloyd et al. Citation1992), this method has many other advantages, such as a high specificity to ionizing radiation, the possibility to detect partial body exposure and the possibility of exposure assessment even months after irradiation (International Atomic Energy Agency Citation2011). However, DCA is low in throughput: it is time-consuming, laborious and requires well-trained personnel for scoring. In 2010, the total capacity of European Union laboratories specialized in biodosimetry for DCA was estimated to be 1493 samples in the triage mode and 187 samples in the full mode per week, excluding the 48 h needed for lymphocyte culturing (Wojcik et al. Citation2010). This would be insufficient in case of a large-scale emergency with thousands of potentially irradiated subjects. Several automated systems allowing for faster dicentric scoring have been developed so far (Gruel et al. Citation2013; De Amicis et al. Citation2014; Garty et al. Citation2015), and several studies demonstrated the possibility of scoring a limited number of cells (20–50) for fast triage purposes (Beinke et al. Citation2013; Oestreicher et al. Citation2017). A simplification of dicentric scoring can also be achieved with the application of telomere and centromere fluorescence in situ hybridization – the technique which allows to simultaneously stain telomeres and centromeres (M'Kacher et al. Citation2015). FISH-based translocation analysis is also the only validated biodosimetry method allowing dose assessment years after actual exposure (Hall J et al. Citation2017), but this does not offer an advantage for emergency triage.
A promising new approach for biodosimetry that offers superior time-efficiency (Abend et al. Citation2016), is the analysis of changes in gene expression levels. Several genes, which respond to radiation exposure have been studied using different methodological approaches, such as whole genome microarray methods (Dressman et al. Citation2007; Fachin et al. Citation2007; Paul and Amundson Citation2008; Boldt et al. Citation2012; Knops et al. Citation2012; Macaeva et al. Citation2016) or quantitative PCR (Joiner et al. Citation2011; Kabacik et al. Citation2011; Manning et al. Citation2013; Tucker et al. Citation2014; Brzoska and Kruszewski Citation2015). Most of the identified genes are known to be regulated by p53 (e.g. MDM2 (Levine et al. Citation1997), DDB2 (Hwang BJ et al. Citation1999), FDXR (Hwang PM et al. Citation2001), PCNA (Xu and Morris Citation1999), GADD45A (Hollander et al. Citation1993), RPS27L (He and Sun Citation2007), SESN1 (Velasco-Miguel et al. Citation1999)), and are involved in canonical p53-mediated pathways such as cell cycle regulation, DNA damage repair and apoptosis. Because some of them are induced in isolated peripheral blood cells after exposure to doses as low as 5–25 mGy (Knops et al. Citation2012; Riecke et al. Citation2012; Manning et al. Citation2013; Nosel et al. Citation2013), it can be stated that in terms of sensitivity to low doses gene expression equals the DCA method. As a result, the development of a biodosimetry gene signature and associated assays which can be configured as devices suitable for low-cost, ‘point-of-care’ measurements make an appealing strategy (Brengues et al. Citation2010; Huang et al. Citation2011; Joiner et al. Citation2011).
Recently, we used microarrays to analyze the transcriptional response of human peripheral blood mononuclear cells (PBMCs) exposed ex vivo to radiation doses of 0.0, 0.1, and 1.0 Gy and observed that many differentially expressed genes were also alternatively transcribed/spliced in response to radiation (Macaeva et al. Citation2016). We thereby identified a signature of genes and exons that showed high performance in dose prediction (Macaeva et al. Citation2016).
One of the main difficulties in using changes in gene expression as a biomarker of exposure is the highly dynamic and transient nature of the signal. The expression of every single gene following radiation exposure is affected not only by the dose, but also by the time, and the kinetics of expression is different for every gene (Manning et al. Citation2013). This means that knowledge of the time span between exposure and measurement is pivotal for correct dose prediction. Using a signature of genes rather than one single gene may therefore, allow assessing the time after exposure based on the combination of their expression profiles.
In addition, finding the right methodological approach to monitor gene expression as early as possible following exposure is also important because the signal is lost within days (Hall J et al. Citation2017). Possible solutions to this include immediate snap freezing of blood in liquid nitrogen or dry ice, which might be challenging in field conditions, or addition of special whole blood preservation buffers (Schwochow et al. Citation2012), which would also solve the problem of effective preservation of easily-degradable RNA. Another challenge of using whole blood for gene expression studies is the heterogeneity of blood cells. About 99% of blood cells are red blood cells, including immature reticulocytes, which contain high levels of globin mRNA accounting for ∼70% of all mRNA in whole blood. This can compromise the detection of other specific mRNAs from white blood cells (Field et al. Citation2007). Although qPCR is less affected by globin mRNA contamination, this parameter is highly important for such techniques as microarrays (Liu et al. Citation2006) and next-generation sequencing (Schwochow et al. Citation2012).
In the present study we firstly compared RNA quality from blood samples processed using different RNA extraction methods. Next, the potential of a gene expression assay using a customized qRT-PCR array to predict both dose and time after exposure was investigated. Genes were chosen based on our previous study, taking into consideration the different sensitivities of single exons. Besides, we included three genes (PF4, GNG11 and CCR4) which were up-regulated in response to low-dose exposure (0.05 Gy) and down-regulated after a higher dose (1 Gy) (El-Saghire et al. Citation2013).
Materials and methods
Comparison of RNA extraction methods
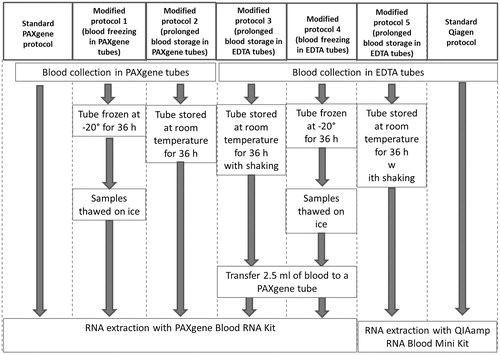
As a first step of the present study, the performance of two RNA extraction kits specifically designed for RNA extraction from whole blood – QIAamp RNA Blood Mini Kit (Qiagen, Hilden, Germany) and PAXgene Blood RNA Kit (PreAnalytiX, Hombrechtikon, Switzerland) – was tested under different conditions ().
Figure 1. Schematic representation of the experimental procedures.
Peripheral blood samples were collected from five healthy donors with informed consent and ethical approval from the local SCK•CEN Ethics Committee. The procedure was carried out in accordance with the ethical standards of the Helsinki Declaration of 1975, as revised in 2000.
RNA extractions were performed following the manufacturer’s instructions, unless mentioned otherwise (). RNA concentration was measured on a Trinean Xpose instrument (Trinean, Gent-Brugge, Belgium) and the quality of total RNA samples was assessed using Agilent 2100 Bioanalyser (Agilent Technologies, Santa Clara, CA, USA) by calculating the RNA integrity number (RIN). RIN for a sample is computed using several characteristics of an RNA electropherogram trace, the most important being the ratio of the area under the 18S and 28S rRNA peaks. Based on the results each sample is assigned a value of 1 to 10, with 10 being the least degraded. Globin mRNA contamination was assessed using qRT-PCR with primers specific to HBA1 and HBB genes using isolated PBMCs as a reference. PBMCs isolation was performed as previously described in Macaeva et al. (Citation2016). RNA extraction from isolated PBMCs was performed using the RNeasy Mini Kit (Qiagen) following the manufacturer’s instructions.cDNA synthesis was performed using the GoScript™ Reverse Transcription System (Promega, Leiden, The Netherlands) with random hexamer primers. For each gene, qRT-PCR reactions were run in duplicate using the MESA GREEN® qRT-PCR kit (Eurogentec, Seraing, Belgium) on an Applied Biosystems® 7500 Real-Time PCR instrument following the manufacturer’s instructions. qRT-PCR data were analyzed by 7500 Software v2.0.6 and Microsoft Excel using the Pfaffl method (Pfaffl Citation2001). The relative amount of transcript of the selected genes was normalized to PGK1 and HPRT1 reference genes using the geometric mean of the threshold cycle (Ct) values of these reference genes (Vandesompele et al. Citation2002).
Blood collection and in vitro irradiation
Peripheral blood samples were collected in EDTA coated tubes from healthy donors with informed consent and ethical approval from the local SCK•CEN Ethics Committee. All procedures were carried out in accordance with the ethical standards of the Helsinki Declaration of 1975, as revised in 2000. Half of the samples were used as reference samples, the other half was used as blind samples. Donor information can be found in .
Table 1. Donor information.
Each blood sample was collected in an EDTA-coated tube and aliquoted in either 5 ml (reference samples) or 2 ml (blind samples) tubes for irradiation. Reference samples were irradiated with 0, 25, 50, 100, 500, 1000, and 2000 mGy, after which the tubes were placed on a rocking platform in an incubator at 37 °C without CO2 supply. The irradiations were performed at room temperature with an Xstrahl machine (250 kV, 1.4 mm Cu +3.8 mm Al filtration) at a dose rate of 0.14 Gy/min. At 8, 12, 24, 36 and 48 h after irradiation, a 1 ml aliquot was taken from each sample and used for RNA extraction. The doses and fixation time points for blind samples were assigned randomly and are given in .
Table 2. Information on doses and time points assigned to blind samples.
RNA extraction, quantification and quality control
The QIAamp RNA Blood Mini Kit was used to extract RNA from the blood samples used in the biodosimetry part of the present study. All procedures were performed following the manufacturer’s instructions, unless stated otherwise. RNA concentration was measured on a Trinean Xpose instrument and the quality of total RNA samples was assessed using Agilent 2100 Bioanalyser (Agilent Technologies, Santa Clara, CA, USA). All samples had a RIN >8 and were therefore considered as suitable for further processing.
Reverse transcription and qPCR
cDNA synthesis on the samples used for biodosimetry part of this study was performed using the RT2 First Strand Kit (Qiagen) following the manufacturer’s instructions. qPCRs were run using custom RT2 Profiler PCR Arrays and the RT2 SYBR Green Mastermix (Qiagen) on an ABI7500 Fast instrument (Applied Biosystems). Standard 96-well plate-format arrays were used, including 25 genes of interest, four reference genes (HPRT1, PGK1, GAPDH and B2M), a positive PCR control, a human genomic DNA contamination control and a reverse transcription control. Each 96-well array could therefore be used to run three samples. The list of genes present on the arrays is provided in . Based on our previous results (Macaeva et al. Citation2016), for the genes alternatively transcribed/spliced in response to irradiation, primers were designed to target the most responsive exons (). qRT-PCR data were analyzed using the dedicated software available at:
After comparing the variability of expression (standard deviations of Ct values in 245 reference samples) of the four reference genes, it was decided to use only B2M for normalization. The obtained differences in threshold cycle (ΔCt) values compared to that of B2M were used to train the prediction models. Relative expression levels were tested for statistical significance using a 2-way ANOVA with Bonferroni post-hoc test.
Classification
Two models were built to predict both the radiation dose and time point of each blind sample based on the gene expression profiles. Two separate datasets were used for training and testing. For training the models, the data acquired from seven donors (reference samples, ) were used, while for testing we used the data of seven different donors (blind samples, ). Training both models consisted of five consecutive steps, (1) identifying the genes most likely responsible for the prediction of the radiation doses and time points (i.e. feature identification), (2) selecting the most informative features (i.e. feature selection), (3) building both models using the classifiers available (i.e. model training), (4) testing the models with a database unexposed to the training step (i.e. model testing), (5) selecting the best performing model for both problems (i.e. model nomination).
Feature (gene) identification was performed in our previous study (Macaeva et al. Citation2016). Both dose and time point were treated as a regression variable ranging from 0 mGy to 2000 mGy and 0 h to 48 h, respectively. Importantly, the testing dataset was not only constructed from new subjects but also new intermediate doses such as 30, 60, 400, 700, 900, 1200 and 1600 mGy not used for training the model were included. This is particularly important to illustrate the independency of the model from the set of training instances.
Secondly, we attempted to perform a feature selection step, important to reduce the complexity and to increase the accuracy of the model. To investigate if all features were necessary for the predictive model, we used the WEKA software implementation to assess the importance of all attributes. Interestingly, however, performing the principal component analysis illustrated the necessity for all features to describe 95% of the variance within the training dataset (data not shown). Consequently, all features were included for training both models using a wide range of classifiers available in WEKA (Hall et al. Citation2009).
Different classification and regression models were considered including Support Vector Machines (SVM), linear regression, Multi-Layer Perceptron (a neural network), nearest neighbour, and three decision tree models: M5Base (implementing base routines for generating M5 Model trees and rules), decision stump, Fast decision tree learner, as implemented in WEKA (Hall et al. Citation2009). Next, each of the trained classifiers was tested using the test dataset, during the fourth step (model testing). To select the optimal classifier, we trained and tested various models. We reported for each classifier Pearson correlation coefficient and the relative absolute error (RAE) calculated for dose prediction as following:
where
is the predicted dose,
is the true dose,
is the average of x values, for every n cases.
For time point prediction RAE was calculated as following:
where
is the predicted time point,
is the true time point,
is the average of x values, for every n cases.
Finally, we nominated the best performing model for each case (predicting the radiation doses and time points) achieving the lowest mean absolute error whilst having the highest correlation coefficient.
Results
Optimization of RNA extraction protocols for emergency situations
To optimize RNA extraction for emergency situations, different protocols were compared and the total RNA content, integrity and contamination were quantified ().
Figure 2. Comparison of RNA extraction protocols. (A) Quantity of RNA extracted following each protocol. Statistical comparison performed using two-tailed paired t-test. In case two bars are mark with the same letter(s) the difference is not statistically significant (p > .05), if the letters are different the difference between two conditions is statistically significant. (B) Quality of RNA extracted following each protocol. Statistical comparison performed using two-tailed paired t-test. In case two bars are mark with the same letter(s) the difference is not statistically significant (p > .05), if the letters are different the difference between two conditions is statistically significant. (C) Levels of contamination of RNA extracted from whole blood samples with PAXgene and QIAmp kits with excessive globin mRNA assessed as expression of α- and β-globin coding genes. Statistical comparison performed using unpaired t-test. SP: standard protocol; MP: modified protocol. Bars represent the mean of five measurement, error bars represent SD. **p < .005, ***p < .001.
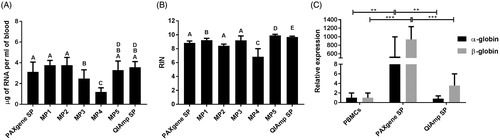
In this part of the study a few modifications of the standard protocols of two commercially available kits were tested: PAXgene tubes, which are specifically designed for direct collection of blood and preservation of RNA for up to 3 days at room temperature and up to 50 months at –20 °C and the QIAmp kit intended for molecular biology applications. The PAXgene system showed consistently high yields of high-quality RNA, in case blood was directly collected in PAXgene tubes (, Standard PAXgene protocol, Modified protocols 1 and 2). Alternatively, the option of collecting the blood in standard EDTA-coated tubes followed by transfer into PAXgene tubes was also explored (, Modified protocol 3). This approach resulted in extraction of high-quality RNA, although at lower yields compared to the standard PAXgene procedure. Importantly, sufficient RNA of acceptable quality could also be extracted from the blood samples which were frozen at –20 °C and transferred into PAXgene tubes after thawing (, Modified protocol 4). Since the QIAmp protocol does not allow processing of frozen blood, the options to modify the protocol were limited (Modified protocol 5). Nevertheless, both tested protocols involving this kit resulted in high yields of RNA of high quality (, Modified protocol 5 and QIAmp standard protocol). Also the possible contamination of RNA samples with excessive globin mRNA was tested (). In this respect, the QIAmp kit clearly outperformed PAXgene, showing low globin mRNA contamination comparable to those obtained for isolated PBMCs, used as a reference in which no contamination was to be expected.
Robust dose- and time-dependent response of the biodosimetric gene panel
In order to identify the best endogenous controls consistently expressed across the sample population, we compared the variability of expression of PGK1, HPRT1, GAPDH and B2M as reference genes. The standard deviations of Ct values for B2M were lower than those for PGK1, HPRT1 and GAPDH (). Also the differences between the minimal and maximal registered Ct values for B2M were the lowest (∼5 cycles difference compared to ∼10 cycles for the other genes). Therefore, in the subsequent analyses, the Ct values of target genes were normalized to B2M.
Blood samples from seven healthy volunteers exposed to X-ray doses ranging from 25 to 2000 mGy were used as reference samples at five different time points following exposure: 8, 12, 24, 36 and 48 hours. In total, expression levels of 25 genes were assessed (). The Ct values for all the samples are given in Supplementary Table 3.
Figure 3. (A–E) Heatmaps showing the average of expression levels in seven donors (relative to control samples per time point, log2 transformed) for all the 25 genes (shown in rows) included in the qPCR arrays in response to exposure to different doses (shown in columns) at five time points. (F) Heatmap showing the relative expression levels in sham-irradiated samples from seven donors relative to sham-irradiated samples at 8 h for all the 25 genes (shown in rows) at five time points (shown in columns).
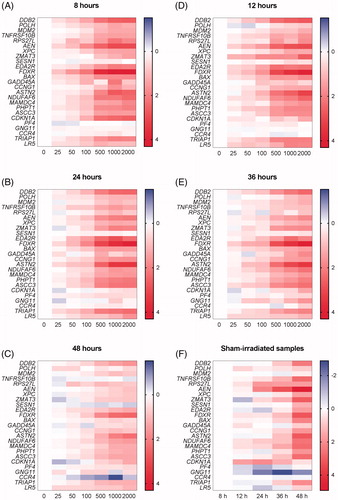
Table 3. Dose and time point prediction results for blind samples.
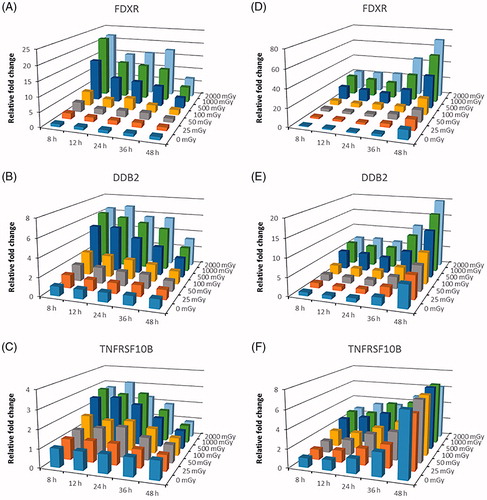
Overall, we observed dose-dependent increases in gene expression (up to 22-fold in the case of FDXR) for the majority of the genes, at all the different time points (). It was clear, however, that different genes had very different kinetics. For instance, induction of FDXR peaked after 8 h (), while that of DDB2 was stable up to 36 h after irradiation (). TNFRSF10B was stably induced up to 24 h, less so after 36 h and no longer induced after 48 h (). Importantly, for many genes (FDXR, DDB2, TNFRSF10B, AEN, XPC, BAX, ASTN2, NDUFAF6, MAMDC4, PHPT1, ASCC3, TRIAP1, LR5) these changes were significant at least at one-time point after exposure to the lowest dose of 25 mGy. We also found, in agreement with previous findings (Manning et al. Citation2013; Abend et al. Citation2016), that most genes showed a plateau at doses above 1000 mGy at which no further induction could be observed. However, some genes did not show any significant changes at all, e.g. SESN1, and the genes previously identified as having opposite changes in response to low- and high-dose radiation (PF4, GNG11, CCR4) (El-Saghire et al. Citation2013) ().
Figure 4. (A–C) Changes in expression of FDXR, DDB2 and TNFRSF10B relative to sham-irradiated samples at 8 h time point. Bars represent the average of samples from seven donors irradiated in vitro with doses from 0 to 2000 mGy and fixed at 5 time points after exposure. (D–F) Changes in expression of FDXR, DDB2 and TNFRSF10B relative to sham-irradiated samples per time point. Bars represent the average of samples from seven donors irradiated in vitro with doses from 0 to 2000 mGy and fixed at 5 time points after exposure.
Importantly, a time-dependent up-regulation in gene expression was seen for several genes (, ), particularly those involved in apoptosis (AEN, BAX, FDXR, TNFRSF10B) and DNA damage repair (ASCC3, DDB2, XPC). This was most evident after 48 h and suggested that even in unirradiated samples, cells were becoming apoptotic over time. Several genes were induced in control samples already after 12 h (), which affected the radiation response for these genes at later time points. Nevertheless, we could still observe dose-dependent changes in gene expression, even after 48 h although radiation-induced changes were in general less outspoken at this time point. This may be, at least in part due to the fact that gene expression was already induced in control samples.
Dose and time after exposure can be predicted from radiation-induced changes in gene expression
The ΔCt values of all the reference samples were used as the training dataset to build the models for dose and time point prediction. Next, the selected model was used to predict the dose and the time after exposure of the blind samples ( and and ).
Figure 5. The decision tree for the REPTree model built for dose prediction, ending with 11 leaves (for each the dose prediction is calculated).
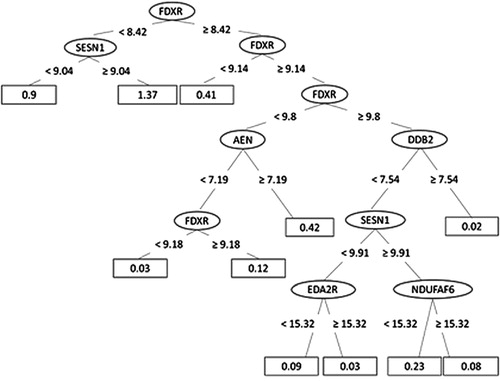
Figure 6. The decision tree for the M5Base model built for time point prediction, ending with 23 leaves (for each a linear model named LM1-LM23 has been calculated).
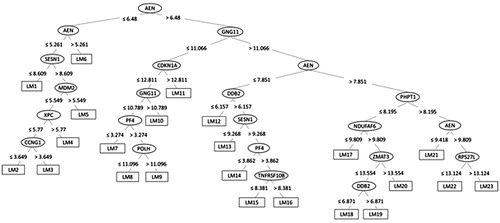
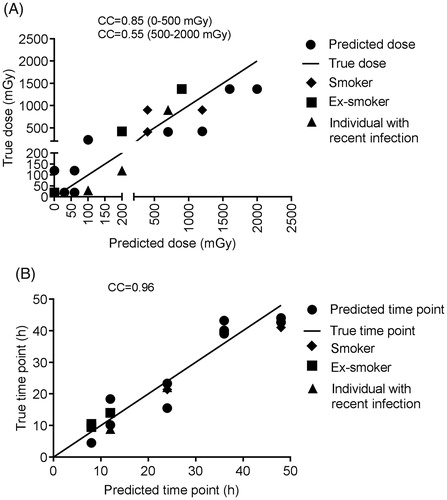
For the dose prediction, the fast decision tree learner (implemented as REPTree in WEKA) could achieve the highest Pearson correlation coefficient of 0.86 between the true and the predicted doses with the lowest RAE of 42%. The merit of this classifier is that it builds the decision based on the information gain and prunes the tree branches using reduced-error pruning (with backfitting). Dose prediction was more accurate for doses below 0.5 Gy (Pearson correlation 0.85) compared to higher doses (Pearson correlation 0.55), probably resulting from the previously described plateau effect of the gene expression response at doses above 1 Gy (Manning et al. Citation2013; Abend et al. Citation2016; Manning et al. Citation2017). Although most of the genes were required to explain the variability within the data, a set of four genes (MDM2, FDXR, ASCC3 and CDKN1A) was considered particularly important for dose prediction. For the time point prediction, the M5Base decision tree classifier (implemented in WEKA as M5P) was able to achieve a correlation coefficient between the true and the predicted time points of 0.96 (with lowest RAE of 28%). M5Base implements base routines for the generation of the M5 model (Quinlan Citation1992; Wang and Witten Citation1997). It functions as a decision tree by splitting the data into branches and leaves based on few parameters, but instead of assigning the ‘time points’ for each leave, a linear regression function is calculated for each leave (enabling a continuous numeric prediction).
The 48-h time point was the most difficult to predict with four predictions out of four outside of the ±4 h interval (). The most discriminative genes for time point prediction were AEN, ASCC3, CDKN1A, GNG11 and CCR4, although all genes were necessary to describe the dissimilarity within the data.
In case of both dose and time point prediction using only the most important genes did not result in significantly better model performance (data not shown). All three samples misclassified according to the true dose were also misclassified according to the true time point ().
Among the blood donors, one was a smoker, one recently stopped smoking and one individual reported a recent infection. Prediction of the doses or time points for these individuals was not particularly more problematic (). Also, the median age of donors whose blood was used for reference samples (27 years) was lower than that of the blind sample donors (54 years). Nevertheless dose prediction was still efficient suggesting that age does not affect dose prediction. It is also important to mention that all the blind samples were collected from male donors completely at random. To demonstrate the model’s performance when testing female records, a cross-validation approach for training and testing the model was applied. However, in this case calibration and blind samples were pooled, thereby violating the independence of the two datasets. The performance of this model was very close to the initial one (data not shown).
Figure 7. Dose (A) and time point (B) prediction results for the blind samples. CC: correlation coefficient.
Discussion
Gene expression is emerging as a highly powerful readout for biodosimetry. Several studies demonstrated the applicability of microarray technology for analyzing large sets of transcripts for dose prediction for exposure to acute doses (Dressman et al. Citation2007; Meadows et al. Citation2008; Paul and Amundson Citation2008; Macaeva et al. Citation2016). However, as was demonstrated in a recent biodosimetry exercise, the analysis of a short list of genes, or even one gene by means of qPCR technology, is far more straightforward and cheaper compared to microarray analysis, while the accuracy of dose prediction is essentially similar (Abend et al. Citation2016). Many of the genes included in our biodosimetry panel were also previously tested by other groups (Riecke et al. Citation2012; Manning et al. Citation2013; Tucker et al. Citation2014; Brzoska and Kruszewski Citation2015), suggesting their robustness as radiation biomarkers. However, our panel composition is unique because we selected the most radiation-sensitive exons of the respective genes for qRT-PCR analysis based on our previous results (Macaeva et al. Citation2016). We used seven X-ray doses ranging from 25 mGy to 2 Gy to generate reference samples. Moderately high doses of 1–2 Gy may result in acute radiation syndrome, therefore the individuals receiving doses above this threshold will benefit greatly from prompt treatment (Sullivan et al. Citation2013). However, in case of a radiological accident, most victims would be exposed to much lower doses. Although lower doses down to 100 mGy are not associated with immediate health effects they might require medical follow-up due to the risk of long-term effects, particularly cancer (UNSCEAR Citation2006). To add to that, the fears about the effects of radiation and the uncertainty about the exposure doses may lead to further stress and mental health effects, as has already happened after the Chernobyl and Fukushima accidents (WHO Citation2006; Brumfiel Citation2013; Bromet Citation2014). In this respect, we believe that assessment and communication of any radiation dose is important. As it is unlikely that any single biodosimetry assay can be used as a stand-alone tool to meet the requirements of throughput, time-efficiency and accuracy needed, it was suggested to perform stepwise triage starting with assessment of less than or greater than a 2-Gy dose, followed by a secondary high-throughput screening to further define individual doses (Sullivan et al. Citation2013). Thus, a combination of high-throughput methods with high accuracy in the low (e.g. gene expression), and the high dose ranges could prove to be an ideal match for practical biodosimetry in emergency cases.
An important aspect that we have addressed in this study is the dynamic nature of the gene expression response to radiation exposure which can have a major impact on accurate dose prediction in cases when the exact time point of irradiation is not known. Taking the example of FDXR, a gene often considered to be the most sensitive and accurate gene biodosimeter (Abend et al. Citation2016; Hall et al. Citation2017; Manning et al. Citation2017; O’Brien et al. Citation2018). In our experimental set-up, a ∼5-fold up-regulation of FDXR could indicate (i) the early (8–24 h), maximal response to a low dose of 100 mGy, (ii) the very early (<8 h) sub-maximal response to a higher dose, or (iii) the late (>36 h) residual response to a higher dose. This example shows that, no matter how sensitive, a single gene cannot sufficiently predict the dose when there is no indication of the time elapsed since exposure. In such a case, the combination of a panel of genes, each with their own kinetics and amplitudes is needed. The same example also highlights that is pivotal to take the time elapsed after exposure into consideration. The classification method used in our study allowed to classify the samples according to the time elapsed since exposure with high precision (errors ≤4 h). The importance of the time factor is also highlighted by the fact that all three samples misclassified according to the true dose were also misclassified according to the true time point. It is important to note, however, that the gene expression kinetics might be different following in vivo exposure. Thus, adaptation of our methodology for in vivo exposure situation may be required. The possibility of using specific weighting factors for adaptation of in vitro generated calibration curves for dose prediction of in vivo exposed blood samples from radiotherapy patients was successfully explored in a recent biodosimetry exercise (Abend et al. Citation2016). The potential of FDXR as radiation biomarker of in vivo exposures was thoroughly investigated in a recent study by O’Brien and co-authors (O'Brien et al. Citation2018). This study demonstrated that the expression of this gene was significantly up-regulated already at 2 h following a diagnostic CT-scan (low-dose exposure to 2.9–20.9 mGy dose to the blood) (O'Brien et al. Citation2018). The expression of FDXR was also significantly up-regulated 24 h following the first fraction of radiotherapy treatment in most patients involved in this study and its expression remained up-regulated during the fractionated treatment (O'Brien et al. Citation2018). Importantly, no significant differences in FDXR expression were found between ex vivo and in vivo irradiated samples from the same patients (O'Brien et al. Citation2018).
In many studies published so far, fold changes in gene expression between irradiated and control samples from the same subject were used (Kabacik et al. Citation2011; Riecke et al. Citation2012; Manning et al. Citation2013). In a real large-scale emergency, such data will not be available. Therefore, in the present study, we opted to use ΔCt values compared to the reference gene. This approach has been successfully applied in several exploratory studies (Tucker et al. Citation2014; Brzoska and Kruszewski Citation2015), as well as in two recent biodosimetry exercises (Abend et al. Citation2016; Manning et al. Citation2017).
For most of the studied genes we found a plateau in expression for high doses (1000 and 2000 mGy), which contributed to less precise dose prediction in the higher dose range as exemplified by the lower correlation coefficient (CC = 0.55) compared to that of the lower dose range (CC = 0.85). This may reflect a saturation of the response, but it might also be the result of in vitro culture conditions. Indeed, similar findings have been previously observed in other studies using ex vivo irradiated whole blood or cultured blood cells (Manning et al. Citation2013; Ghandhi et al. Citation2015; Abend et al. Citation2016; Manning et al. Citation2017). In contrast, in experiments using ex vivo irradiated blood which was diluted tenfold in RPMI culture medium, this effect was only observed at doses above 6 Gy (Tucker et al. Citation2014), comparable to what was seen in whole body irradiated mice in a study from the same group (Tucker et al. Citation2013). Similarly, in radiotherapy patients undergoing total body irradiation several genes included in our panel (e.g. CDKN1A, FDXR, and PHPT1) showed further up-regulation after 3.75 Gy compared to 1.25 Gy (Paul et al. Citation2011).
In the present study, we opted for using undiluted blood for our experiments, to interfere as little as possible with the samples as gene expression changes might be affected by culture conditions, and more specifically by addition of fetal bovine serum (Shahdadfar et al. Citation2005; Bieback et al. Citation2010). A similar approach as ours was used by Manning and co-authors, showing 99% cell viability in blood samples incubated for 24 h at 37 °C (Manning et al. Citation2013). In our study, an increase in expression with time, especially at 36 and 48 h was seen for a number of genes involved in apoptosis, suggesting an increase in the number of dying cells with time. This may have also influenced the radiation-induced response of these genes, and therefore the dose prediction. Nevertheless, we were able to accurately (absolute error ≤300 mGy) predict the radiation doses of 6 out of 8 blind samples from the 36-h and 48-h time points.
In vivo irradiation experiments performed by Tucker and co-authors in mice confirmed the possibility of dose prediction based on gene expression for at least 7 days after exposure (Tucker et al. Citation2013). Whether the same is true in humans remains to be investigated. Studies involving radiotherapy patients showed that prediction of in vivo radiation dose using gene signatures was possible for at least 24 h following exposure (Paul et al. Citation2011; Abend et al. Citation2016). Further in vivo validation of biodosimetric gene signatures at longer time intervals is therefore warranted.
In our study, we did not address the effect of dose rate on gene expression. Several studies addressing this issue were previously performed in total body irradiated mice (Paul et al. Citation2015) and ex vivo irradiated human blood (3.1 mGy/min vs 1.03 Gy/min) (Ghandhi et al. Citation2015). Overall, these studies showed that a significant number of genes responded similarly to low dose rate and acute exposures. This was especially seen for typical P53-regulated genes, many of which were also included in our gene panel, although the amplitude of the response was sometimes higher after high dose rate exposure. Interestingly, in both studies classification models could very efficiently discriminate between low and high dose rate irradiated samples, showing that gene signatures may be used to discriminate between acute and protracted exposures.
An important step for biodosimetric triage of casualties of a radiological accident is to appropriately collect and preserve (blood) samples for further analysis. For gene expression measurement the time elapsed from exposure to blood collection and sample fixation is critical for correct dose estimation, as gene expression in non-frozen and non-stabilized blood would still be subjected to change not only as a result of radiation exposure, but also due to ex vivo incubation itself (Baechler et al. Citation2004). Several approaches to solve this issue were previously tested. Brzoska and Kruszewski extracted RNA for gene expression analysis from whole blood which was frozen and stored at –75 °C (Brzoska and Kruszewski Citation2015). In a real-life situation this approach would, however, not be practical due to the lack of very low-temperature freezers. An alternative approach, tested during a recent RENEB biodosimetry exercise, includes the addition of RNA stabilization reagents which protect RNA from degradation allowing for sample storage and transportation at room temperature for several hours or even days. However, this methodology still requires the availability of significant quantities of such reagents at the accident site while the further processing of the samples might be affected by transport conditions (Manning et al. Citation2017). Therefore, we tested the freezing of whole blood at –20 °C, which would allow blood preservation without any specific equipment or reagents. Upon delivery to the biodosimetric laboratory, blood samples would be thawed and transferred to PAXgene tubes, allowing for recovery of sufficient RNA of acceptable quality. A recent biodosimetry exercise showed that dose prediction accuracy using our qRT-PCR arrays is not affected by the differences in RNA extraction methods, including those which result in high globin mRNA contamination (Manning et al. Citation2017). Thus, in case of significant damage to infrastructure after a large-scale accident, the suggested methodology of blood freezing at –20 °C could be substituted with RNA stabilization reagents as described above.
Taken together, in the present study, we proved the usefulness of a biodosimetric panel of genes in predicting both dose and time after in vitro exposure. Our results confirm that the analysis of expression of these genes, which can be carried out in virtually any laboratory possessing a qPCR instrument, can certainly provide sufficient information for triage purposes in comparatively short amount of time. The validity of our customized biodosimetric qPCR arrays was recently confirmed in an interlaboratory comparison exercise organized by RENEB (Manning et al. Citation2017). Although in this exercise different experimental procedures, including different dose assessment approach were used, we could still achieve good dose prediction (Manning et al. Citation2017), confirming the flexibility and versatility of our method. We also suggest a method allowing for further RNA extraction from blood samples stored at –20 °C, which is the most realistic for field conditions. Further research is needed to confirm the time- and dose-wise validity and applicability of our signature for in vivo situation, as well as to reveal the potential impact of confounding factors on the reliability of the gene expression-based biodosimetry.
Acknowledgments
The authors wish to thank the SCK•CEN medical service staff for the help with blood drawing, as well as all the blood donors involved in this study. Ellina Macaeva is a recipient of a joint doctoral SCK•CEN/UGent grant.
Disclosure statement
No potential conflict of interest was reported by the authors.
Additional information
Funding
Notes on contributors
Ellina Macaeva
Ellina Macaeva is a PhD student at the Radiobiology Unit of SCK•CEN working on transcriptional radiation biomarkers.
Mohamed Mysara
Mohamed Mysara is a bioinformatician at the Belgian Nuclear Research Centre.
Winnok H. De Vos
Winnok De Vos (PhD Bioscience Engineering) is research professor at Antwerp University and guest professor at Ghent University. He specialises in cell-centered research, with particular focus on the role of the cell nucleus in accelerated aging diseases. To this end, he relies on a multidisciplinary cocktail of techniques, including genome editing and deep coverage microscopy.
Sarah Baatout
Sarah Baatout is head of the Radiobiology Unit at the Belgian Nuclear Research Centre, guest professor at Gent University and maître de conférence at University of Namur.
Roel Quintens
Roel Quintens (PhD) is a senior scientist in the Radiobiology Unit at the Belgian Nuclear Research Centre. Dr. Quintens coordinates two research lines: (i) effects of prenatal irradiation on embryonic brain development, and (ii) identification of novel transcriptional radiation biomarkers.
Gene expression-based biodosimetry for radiological incidents: assessment of dose and time after radiation exposure.
References
- Abend M, Badie C, Quintens R, Kriehuber R, Manning G, Macaeva E, Njima M, Oskamp D, Strunz S, Moertl S, et al. 2016. Examining radiation-induced in vivo and in vitro gene expression changes of the peripheral blood in different laboratories for biodosimetry purposes: first RENEB gene expression study. Radiat Res. 185:109–123.
- Baechler EC, Batliwalla FM, Karypis G, Gaffney PM, Moser K, Ortmann WA, Espe KJ, Balasubramanian S, Hughes KM, Chan JP, et al. 2004. Expression levels for many genes in human peripheral blood cells are highly sensitive to ex vivo incubation. Genes Immun. 5:347–353.
- Beinke C, Barnard S, Boulay-Greene H, De Amicis A, De Sanctis S, Herodin F, Jones A, Kulka U, Lista F, Lloyd D, et al. 2013. Laboratory intercomparison of the dicentric chromosome analysis assay. Radiat Res. 180:129–137.
- Bieback K, Ha VA, Hecker A, Grassl M, Kinzebach S, Solz H, Sticht C, Kluter H, Bugert P. 2010. Altered gene expression in human adipose stem cells cultured with fetal bovine serum compared to human supplements. Tissue Eng Part A. 16:3467–3484.
- Boldt S, Knops K, Kriehuber R, Wolkenhauer O. 2012. A frequency-based gene selection method to identify robust biomarkers for radiation dose prediction. Int J Radiat Biol. 88:267–276.
- Brengues M, Paap B, Bittner M, Amundson S, Seligmann B, Korn R, Lenigk R, Zenhausern F. 2010. Biodosimetry on small blood volume using gene expression assay. Health Phys. 98:179–185.
- Bromet EJ. 2014. Emotional consequences of nuclear power plant disasters. Health Phys. 106:206–210.
- Brumfiel G. 2013. Fukushima: fallout of fear. Nature. 493:290–293.
- Brzoska K, Kruszewski M. 2015. Toward the development of transcriptional biodosimetry for the identification of irradiated individuals and assessment of absorbed radiation dose. Radiat Environ Biophys. 54:353–363.
- De Amicis A, De Sanctis S, Di Cristofaro S, Franchini V, Regalbuto E, Mammana G, Lista F. 2014. Dose estimation using dicentric chromosome assay and cytokinesis block micronucleus assay: comparison between manual and automated scoring in triage mode. Health Phys. 106:787–797. English.
- Dressman HK, Muramoto GG, Chao NJ, Meadows S, Marshall D, Ginsburg GS, Nevins JR, Chute JP. 2007. Gene expression signatures that predict radiation exposure in mice and humans. PLoS Med. 4:e106–e701.
- El-Saghire H, Thierens H, Monsieurs P, Michaux A, Vandevoorde C, Baatout S. 2013. Gene set enrichment analysis highlights different gene expression profiles in whole blood samples X-irradiated with low and high doses. Int J Radiat Biol. 89:628–638.
- Etherington G, Rothkamm K, Shutt AL, Youngman MJ. 2011. Triage, monitoring and dose assessment for people exposed to ionising radiation following a malevolent act. Radiat Prot Dosimetry. 144:534–539.
- Fachin AL, Mello SS, Sandrin-Garcia P, Junta CM, Donadi EA, Passos GA, Sakamoto-Hojo ET. 2007. Gene expression profiles in human lymphocytes irradiated in vitro with low doses of gamma rays. Radiat Res. 168:650–665.
- Field LA, Jordan RM, Hadix JA, Dunn MA, Shriver CD, Ellsworth RE, Ellsworth DL. 2007. Functional identity of genes detectable in expression profiling assays following globin mRNA reduction of peripheral blood samples. Clin Biochem. 40:499–502.
- Garty G, Bigelow AW, Repin M, Turner HC, Bian D, Balajee AS, Lyulko OV, Taveras M, Yao YL, Brenner DJ. 2015. An automated imaging system for radiation biodosimetry. Microsc Res Tech. 78:587–598.
- Ghandhi SA, Smilenov LB, Elliston CD, Chowdhury M, Amundson SA. 2015. Radiation dose-rate effects on gene expression for human biodosimetry. BMC Med Genomics. 8:22.
- Gruel G, Gregoire E, Lecas S, Martin C, Roch-Lefevre S, Vaurijoux A, Voisin P, Voisin P, Barquinero JF. 2013. Biological dosimetry by automated dicentric scoring in a simulated emergency. Radiat Res. 179:557–569.
- Hall M, Frank E, Holmes G, Pfahringer B, Reutemann P, Witten I. 2009. The WEKA data mining software: an update. SIGKDD Explor Newsl. 11:10–18.
- Hall J, Jeggo PA, West C, Gomolka M, Quintens R, Badie C, Laurent O, Aerts A, Anastasov N, Azimzadeh O, et al. 2017. Ionizing radiation biomarkers in epidemiological studies – an update. Mutat Res. 771:59–84.
- He H, Sun Y. 2007. Ribosomal protein S27L is a direct p53 target that regulates apoptosis. Oncogene. 26:2707–2716.
- Hollander MC, Alamo I, Jackman J, Wang MG, McBride OW, Fornace AJ Jr. 1993. Analysis of the mammalian gadd45 gene and its response to DNA damage. J Biol Chem. 268:24385–24393.
- Huang TC, Paul S, Gong P, Levicky R, Kymissis J, Amundson SA, Shepard KL. 2011. Gene expression analysis with an integrated CMOS microarray by time-resolved fluorescence detection. Biosens Bioelectron. 26:2660–2665.
- Hwang PM, Bunz F, Yu J, Rago C, Chan TA, Murphy MP, Kelso GF, Smith RA, Kinzler KW, Vogelstein B. 2001. Ferredoxin reductase affects p53-dependent, 5-fluorouracil-induced apoptosis in colorectal cancer cells. Nat Med. 7:1111–1117.
- Hwang BJ, Ford JM, Hanawalt PC, Chu G. 1999. Expression of the p48 xeroderma pigmentosum gene is p53-dependent and is involved in global genomic repair. Proc Natl Acad Sci USA. 96:424–428.
- International Atomic Energy Agency. 2011. Cytogenetic dosimetry: applications in preparedness for and response to radiation emergencies. EPR-biodosimetry.
- Joiner MC, Thomas RA, Grever WE, Smolinski JM, Divine GW, Konski AA, Auner GW, Tucker JD. 2011. Developing point of care and high-throughput biological assays for determining absorbed radiation dose. Radiother Oncol. 101:233–236.
- Kabacik S, Mackay A, Tamber N, Manning G, Finnon P, Paillier F, Ashworth A, Bouffler S, Badie C. 2011. Gene expression following ionising radiation: identification of biomarkers for dose estimation and prediction of individual response. Int J Radiat Biol. 87:115–129.
- Knops K, Boldt S, Wolkenhauer O, Kriehuber R. 2012. Gene expression in low- and high-dose-irradiated human peripheral blood lymphocytes: possible applications for biodosimetry. Radiat Res. 178:304–312.
- Levine SJ, Wu T, Shelhamer JH. 1997. Extracellular release of the type I intracellular IL-1 receptor antagonist from human airway epithelial cells: differential effects of IL-4, IL-13, IFN-gamma, and corticosteroids. J Immunol. 158:5949–5957.
- Liu J, Walter E, Stenger D, Thach D. 2006. Effects of globin mRNA reduction methods on gene expression profiles from whole blood. J Mol Diagn. 8:551–558.
- Lloyd DC, Edwards AA, Leonard A, Deknudt GL, Verschaeve L, Natarajan AT, Darroudi F, Obe G, Palitti F, Tanzarella C. 1992. Chromosomal aberrations in human lymphocytes induced in vitro by very low doses of X-rays. Int J Radiat Biol. 61:335–343.
- Macaeva E, Saeys Y, Tabury K, Janssen A, Michaux A, Benotmane MA, De Vos WH, Baatout S, Quintens R. 2016. Radiation-induced alternative transcription and splicing events and their applicability to practical biodosimetry. Sci Rep. 6:19251
- Manning G, Kabacik S, Finnon P, Bouffler S, Badie C. 2013. High and low dose responses of transcriptional biomarkers in ex vivo X-irradiated human blood. Int J Radiat Biol. 89:512–522.
- Manning G, Macaeva E, Majewski M, Kriehuber R, Brzoska K, Abend M, Doucha-Senf S, Oskamp D, Strunz S, Quintens R, et al. 2017. Comparable dose estimates of blinded whole blood samples are obtained independently of culture conditions and analytical approaches. Second RENEB gene expression study. Int J Radiat Biol. 93:87–98.
- Meadows SK, Dressman HK, Muramoto GG, Himburg H, Salter A, Wei ZZ, Ginsburg G, Chao NJ, Nevins JR, Chute JP. 2008. Gene expression signatures of radiation response are specific, durable and accurate in mice and humans. PLoS One. 3:e1912.
- M'Kacher R, El Maalouf E, Terzoudi G, Ricoul M, Heidingsfelder L, Karachristou I, Laplagne E, Hempel WM, Colicchio B, Dieterlen A, et al. 2015. Detection and automated scoring of dicentric chromosomes in nonstimulated lymphocyte prematurely condensed chromosomes after telomere and centromere staining. Int J Radiat Oncol Biol Phys. 91:640–649.
- Nosel I, Vaurijoux A, Barquinero JF, Gruel G. 2013. Characterization of gene expression profiles at low and very low doses of ionizing radiation. DNA Repair (Amst). 12:508–517.
- O'Brien G, Cruz-Garcia L, Majewski M, Grepl J, Abend M, Port M, Tichy A, Sirak I, Malkova A, Donovan E, et al. 2018. FDXR is a biomarker of radiation exposure in vivo. Sci Rep. 8:684.
- Oestreicher U, Samaga D, Ainsbury E, Antunes AC, Baeyens A, Barrios L, Beinke C, Beukes P, Blakely WF, Cucu A, et al. 2017. RENEB intercomparisons applying the conventional dicentric chromosome assay (DCA). Int J Radiat Biol. 93:20–29.
- Paul S, Amundson SA. 2008. Development of gene expression signatures for practical radiation biodosimetry. Int J Radiat Oncol Biol Phys. 71:1236–1244.
- Paul S, Barker CA, Turner HC, McLane A, Wolden SL, Amundson SA. 2011. Prediction of in vivo radiation dose status in radiotherapy patients using ex vivo and in vivo gene expression signatures. Radiat Res. 175:257–265.
- Paul S, Smilenov LB, Elliston CD, Amundson SA. 2015. Radiation dose-rate effects on gene expression in a mouse biodosimetry model. Radiat Res. 184:24–32.
- Pfaffl MW. 2001. A new mathematical model for relative quantification in real-time RT-PCR. Nucleic Acids Res. 29:e45.
- Quinlan J. Learning with Continuous Classes. 5th Australian Joint Conference on Artificial Intelligence; 1992. Singapore.
- Riecke A, Rufa CG, Cordes M, Hartmann J, Meineke V, Abend M. 2012. Gene expression comparisons performed for biodosimetry purposes on in vitro peripheral blood cellular subsets and irradiated individuals. Radiat Res. 178:234–243.
- Schwochow D, Serieys LE, Wayne RK, Thalmann O. 2012. Efficient recovery of whole blood RNA-a comparison of commercial RNA extraction protocols for high-throughput applications in wildlife species. BMC Biotechnol. 12:33.
- Shahdadfar A, Fronsdal K, Haug T, Reinholt FP, Brinchmann JE. 2005. In vitro expansion of human mesenchymal stem cells: choice of serum is a determinant of cell proliferation, differentiation, gene expression, and transcriptome stability. Stem Cells. 23:1357–1366.
- Sullivan JM, Prasanna PG, Grace MB, Wathen LK, Wallace RL, Koerner JF, Coleman CN. 2013. Assessment of biodosimetry methods for a mass-casualty radiological incident: medical response and management considerations. Health Phys. 105:540–554.
- Tucker JD, Divine GW, Grever WE, Thomas RA, Joiner MC, Smolinski JM, Auner GW. 2013. Gene expression-based dosimetry by dose and time in mice following acute radiation exposure. PLoS One. 8:e83390.
- Tucker JD, Joiner MC, Thomas RA, Grever WE, Bakhmutsky MV, Chinkhota CN, Smolinski JM, Divine GW, Auner GW. 2014. Accurate gene expression-based biodosimetry using a minimal set of human gene transcripts. Int J Radiat Oncol Biol Phys. 88:933–939.
- UNSCEAR. 2006. Report. Volume I: Report to the General Assembly, Annex A: Epidemiological studies of radiation and cancer. United Nations.
- Vandesompele J, De Preter K, Pattyn F, Poppe B, Van Roy N, De Paepe A, Speleman F. 2002. Accurate normalization of real-time quantitative RT-PCR data by geometric averaging of multiple internal control genes. Genome Biol. 3:RESEARCH0034.
- Velasco-Miguel S, Buckbinder L, Jean P, Gelbert L, Talbott R, Laidlaw J, Seizinger B, Kley N. 1999. PA26, a novel target of the p53 tumor suppressor and member of the GADD family of DNA damage and growth arrest inducible genes. Oncogene. 18:127–137.
- Wang Y, Witten I. Induction of model trees for predicting continuous classes. 9th European Conference on Machine Learning; 1997.
- WHO. 2006. Health effects of the chernobyl accident and special health care programmes. Geneva: World Health Organization.
- Wojcik A, Lloyd D, Romm H, Roy L. 2010. Biological dosimetry for triage of casualties in a large-scale radiological emergency:capacity of the EU member states. Radiat Prot Dosimetry. 138:397–401.
- Xu J, Morris GF. 1999. p53-mediated regulation of proliferating cell nuclear antigen expression in cells exposed to ionizing radiation. Mol Cell Biol. 19:12–20.