
Abstract
Purpose: The FIGARO low dose 60Co gamma irradiation facility at the Norwegian University of Life Sciences, Ås, Norway, is dedicated to the study of effects on living organisms from acute or chronic ionizing radiation exposures, either alone or in combination with other stressors such as UV radiation, metals or radionuclides. Here, we present a framework of working guidelines and computer software for characterization of absorbed dose rates and accumulated doses to organisms exposed within the continuous gamma field at FIGARO. The aims of the framework are to ensure gamma exposures are well characterized, that results from exposures are correctly interpreted in terms of absorbed dose rates and accumulated doses, and that sufficient information is available so that exposures can be reproduced later or at other facilities.
Methods: The software of the framework includes a Geant4 application for Monte Carlo radiation transport simulations and tools for dose planning, recording and reporting. The working guidelines are prepared for expert users who provide simulated, calculated or estimated absorbed dose rates and for regular users who conduct exposure experiments and are responsible for record keeping. To demonstrate the developed framework, we use a case study where 14 freshwater microcosms are exposed to four levels of gamma dose rates at FIGARO.
Conclusion: The framework guides users towards good dosimetry practices. Lessons learned could be transferable to other gamma irradiation facilities.
Introduction
Ionizing radiation is an unavoidable part of the environment. In exposure situations that result from anthropogenic activities, it may be necessary either to demonstrate that the environment is adequately protected (ICRP Citation2007) or to apply measures to achieve such protection. Assessments of risk to the environment are fundamentally dependent on our knowledge of dose-response relationships for affected organisms or systems. Such radiobiological and radioecological studies can be conducted at nuclear legacy sites or at artificially contaminated field sites, and model experiments can be conducted in the laboratory.
The FIGARO 60Co gamma irradiation facility at the Norwegian University of Life Sciences (NMBU) is dedicated to the study of effects on living organisms from acute or chronic ionizing radiation exposures, either alone or in combination with other stressors such as UV radiation, metals or radionuclides. The facility was opened in 2003 and upgraded to a climate controlled facility in 2012 with funding from the EU DoReMi project. Today, it consists of a 20 m long climate controlled exposure hall with a 60Co source placed at the front end, along with attached laboratory facilities. Due to the length of the hall, exposure levels vary by close to four orders of magnitude for small setups such as micro plates and more than two orders of magnitude for larger setups. Since its opening in 2003, FIGARO has supported research on a broad range of test organisms (Lind et al. Forthcoming).
The purpose of the current paper is to present a framework of working guidelines and computer software for FIGARO, with the aim of ensuring that exposures are well characterized, that results from exposures are correctly interpreted in terms of absorbed dose rates and accumulated doses, and that sufficient information is available so that exposures can be reproduced later or at other facilities. The software for the framework includes a Geant4 (Agostinelli et al. Citation2003, Allison et al. Citation2006, Citation2016) Monte Carlo radiation transport model for FIGARO, and applications for dose planning and for dose recording and reporting. As a demonstration, we present results from applying the framework to a case study where 14 freshwater microcosms (Hevrøy et al. submitted) were exposed to four levels of dose rates at FIGARO.
Background
The NMBU FIGARO irradiation facility
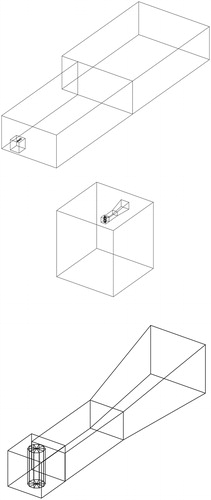
The source at FIGARO consists of a set of 60Co cylinders welded into roughly 1 cm ×1 cm ×1 cm large stainless steel capsules. The capsules are located in a source holder, which is installed in lead (18 cm) and concrete (20 cm) housing. A pneumatic system controls the opening and closing of the beam, via a lead block with an opening channel that functions as a collimator. The basic layouts of the source housing and exposure hall are illustrated by the Geant4 model (). From the current maximum permissible loading of the source of 400 GBq of 60Co (valid from 2016) the corresponding maximum permissible air kerma rate 100 cm from the source focus is 122 mGy/h. The source was first filled in 2003 and then refilled in 2013, when 13 new source capsules with a combined 60Co activity of 390 GBq were added to the bottom of the source holder, beneath the old generation of capsules (which are still present in the source).
Figure 1. The geometry of the Geant4 model of FIGARO.
Following the refill, the Secondary Standard Dosimetry Laboratory (SSDL) at the Norwegian Radiation Protection Authority (NRPA) characterized the field in terms of air kerma rates free in air with ionization chambers traceable to the Bureau International des Poids et Mesures (BIPM). Based on the characterization of the field, an Excel spreadsheet for dose planning on the central field axis (defined to 78 cm above the floor) was developed. This axis is hereafter referred to as the SSDL-defined field axis. Air kerma rates were measured at eight points along this axis, spanning the length of the exposure hall, plus at an additional 10 points across two cross sections of the hall to determine the width of the field, and at four points over one cross section to determine its height (data available as supplementary information). On the reference date (20 February 2013) the air kerma rate on the SSDL-defined field axis 100 cm from the source focus was determined to be 139.4 mGy/h with a relative standard uncertainty of 3.2% (Bjerke and Hetland Citation2014). In the day-to-day operations of FIGARO, air kerma rates are measured with an optically stimulated luminescence (OSL) dosimetry system from Landauer (Landauer, Inc., Greenwood, IL), featuring so-called nanoDot detectors (with additional buildup (Hansen and Hetland Citation2017)), plus a microStar reader and a tabletop annealer (Landauer [date unknown]).
Exposure levels at FIGARO can be put into context by comparing the current (1 October 2017) exposure rates at 100 cm distance to the source focus (air kerma rate 76.2 mGy/h, exposure rate 2.24 mC/kgh, equivalent to 8.69 R/h), as well as near the back wall of the hall at 1900 cm distance to the source focus (air kerma rate 0.200 mGy/h, exposure rate 5.88 µC/kgh, equivalent to 22.8 mR/h), with available data on exposure levels following severe nuclear accidents (UNSCEAR Citation2008). These include the Chernobyl accident in April of 1986, where exposure rates in air between the reactor and the town of Pripyat from external gamma ranged from 100 R/h to 0.1 R/h at the time of the accident (UNSCEAR Citation2000), but had fallen to around 20 mR/h near Pripyat in mid-May of 1986, and to around 1 mR/h near Pripyat by mid-May of 1988 (Kryuchkov et al. Citation2009). Current exposure levels at FIGARO are therefore comparable to the exposure levels from external gamma that were observed in the environment up to a few kilometers from the Chernobyl power plant in the weeks following the accident.
Methods
Working guidelines and computer software for the framework
The working guidelines as well as the computer software and Geant4 code for the exposure characterization and dosimetry framework for FIGARO are freely available on GitHub (github.com/lindbohansen/FIGARO). The working guidelines delegate between expert users who provide simulated, calculated or estimated absorbed dose rates for each type of setup at each relevant position in the field, and regular users who conduct exposure experiments and are responsible for record keeping, e.g. of beam-open and beam-shut times and of rotations of setups between positions. Both types of users should collaborate on and dedicate time to dose planning. The software of the framework includes the code for the Geant4 model, plus applications for dose planning (under development) and for dose recording and reporting, written in R (R Core Team Citation2017) with R Markdown (Allaire et al. Citation2016). An associated wiki (https://github.com/lindbohansen/FIGARO/wiki/FIGARO-wiki) will hold user documentation and examples.
The Geant4 FIGARO model
Geant4 (Agostinelli et al. Citation2003; Allison et al. Citation2006, Citation2016) is a toolset for Monte Carlo simulations of the passage of particles through matter, which is freely distributed under the terms of the Geant4 Software License (Geant4 Collaboration Citation2006). The Geant4 model of FIGARO is developed for Geant4 version 10.3.1 using the QGSP_BERT_HP physics list, and has been verified under CentOS Linux 7.
The model is built with information from several sources. Physical dimensions of the exposure hall and source housing were preferably measured with a laser measure (Bosch GLM 50C, range 5 cm to 50 m, accuracy ±1.5 mm). The inner dimensions of the collimator and source holder were taken from technical schematics. The material composition of the source was implemented as a stainless steel cylinder with a uniform density calculated from the known mass of steel and Co in the source. Actual dimensions are available in the source code.
The 60Co activity distribution of the source is currently not given a priori because the refilling of the source in 2013 was conducted by dropping the 60Co capsules into the source holder. The software of the framework is therefore designed to identify an adequate model of this activity distribution based on air kerma rates measured in the exposure hall. This is achieved by solving a set of linear inverse models. The models take as input the air kerma rates that have been measured at several points across the gamma field, as well as the simulated air kerma rates at these points from a set of modelled sources. The linear inverse models are solved for the unknown strengths of the modelled sources with the lsei function from the R package limSolve (Soetaert et al. Citation2009). The current set of modelled sources has been iteratively developed from an initial guess of a single source through to its current implementation as a set of 22 sources, in order to achieve sufficient agreement between simulated and measured air kerma rates in the exposure hall.
In the software framework, the default simulations record air kerma rates over user-specified cross sections of the exposure hall on the reference date (20 February 2013). Expert users can update the Geant4 model with the geometries of actual exposure setups to simulate quantities such as whole-system or whole-body absorbed dose rates. Because such simulations cannot be directly validated without resorting e.g. to calorimetry, we instead validate simulations of the absorbed dose to water at a point, by modelling a 9 L aquarium for which we have measurements of the absorbed dose rate to water at a depth of 7.5 cm from previous work (Hurem et al. Citation2017).
Measurements and simulations for the microcosm exposures
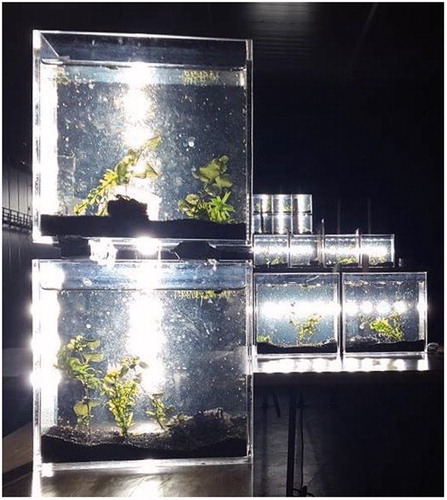
To demonstrate the exposure characterization and dosimetry framework, we use a case study where 14 freshwater microcosms (Hevrøy et al. 2017) were exposed to four levels of gamma dose rates at FIGARO. The microcosm containers were Plexiglas boxes with inner dimensions of 20 cm × 20 cm ×10 cm and 6 mm thick walls. During the exposures () the containers were placed in the gamma field so that the smallest dimension of 10 cm controlled the depth. Air kerma rates over the front face of microcosms were measured with nanoDots. The microcosms contained various organisms (snails, aquatic plants, phyto- and zooplankton, plus leaf litter and associated bacterial communities). Whole-system absorbed dose rates to water were therefore chiefly used to characterize the exposures, which was appropriate since the main aim of the microcosms study (Hevrøy et al. 2017) was to investigate ecological effects on the whole system. To this end, a model of the setup of the 14 microcosms was added to the already developed model of the FIGARO exposure hall and source. The simulations recorded whole-system absorbed dose rates to water for each microcosm and air kerma rates across the front and back faces of empty microcosms. Regular users supplied information on beam-open and beam-shut times and on how microcosms were rotated internally at a dose level (i.e. at a specified distance to the source focus) so as to average out differences in air kerma rates between neighboring positions in the gamma field. The resulting dose report for the microcosm exposures is available as supplementary information.
Figure 2. The setup of 14 4 L freshwater microcosms (Hevrøy et al. 2017) at FIGARO in 2016.
Results
Air kerma rates free in air for the open field
The default Geant4 simulations of FIGARO record air kerma rates over user-specified cross sections of the exposure hall on the reference date (20 February 2013). Based on the current best estimate for the activity distribution of the source, relative deviations between simulated and measured air kerma rates () have a median value of 1.3% for the dataset where air kerma rates were measured with ionization chambers by the SSDL, and a median value of 4.0% for datasets where air kerma rates were measured with nanoDots at several distances to the source focus and to the SSDL-defined field axis. The modelled field as a function of height from the floor when the width is limited to the SSDL-defined field axis, and as a function of width when the height is limited to this axis, illustrates the agreement between simulated and measured air kerma rates for the SSDL dataset (). Air kerma rates over a range of cross sections of the hall () show the shape of the field, and will feature as inputs to the dose planning application (under development).
Figure 3. Simulated (lines) and measured (error bars) air kerma rates free in air on the reference date (20 February 2013) over cross sections of the hall 102 cm, 902 cm and 1502 cm from the source focus. The subfigures to the left show air kerma rates versus horizontal distance from the SSDL-defined field axis (width) when the vertical distance from the floor (height) is kept constant around 78 cm. The subfigures to the right show air kerma rates versus vertical distance from the floor (height) when the horizontal distance from the SSDL-defined field axis (width) is kept constant around 0 cm. The measured data are from the SSDL dataset.
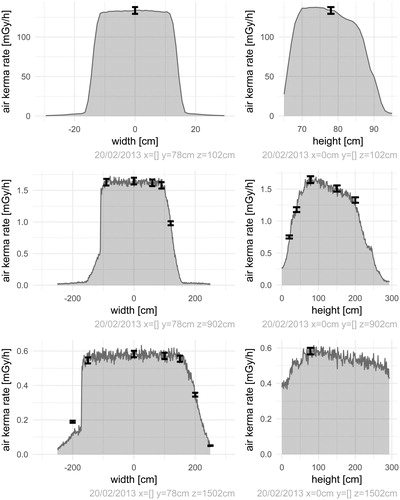
Figure 4. Simulated air kerma rates over cross sections of the hall perpendicular to the central field axis. The color scales for each figure show air kerma rates free in air in units of mGy/h on the reference date (20 February 2013). The abrupt drop in air kerma rates on the left side at 902 cm is due to the field meeting the wall.
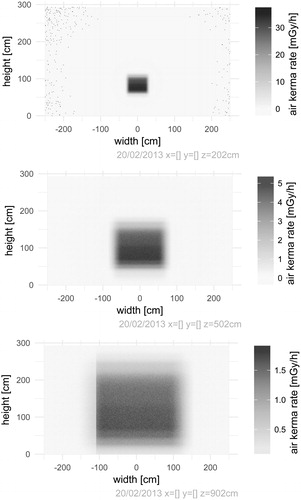
Table 1. Quartiles of relative deviations between simulated and measured air kerma rates, respectively when the measured data are from the SSDL dataset (where the relative standard uncertainty on measured air kerma rates is 3.2%) or from nanoDots datasets (where the relative standard uncertainty on measured air kerma rates is estimated to 5%).
Along the SSDL-defined field axis, the simulations show that the energy fluence of the gamma field in the range (1.0,1.5) MeV constitutes from about 80% (at 102 cm to the source focus) to 75% (at 1902 cm to the source focus) of the overall energy fluence. The relatively small additional loss of energy fluence in the (1.0,1.5) MeV range between 102 cm and 1902 cm, is likely a consequence of the fact that most scattering interactions occur in the source itself and in the materials of the source housing and collimator channels. We caution that these results have not been validated against measured spectral data. A Monte Carlo radiation transport study of a 60Co therapy unit reports a proportion of unscattered primary photons to scattered photons of roughly 65% (Teimouri Sichani and Sohrabpour Citation2004).
Simulated absorbed dose rates to water
In lieu of validating simulations of whole-system or whole-body absorbed dose rates, we validate simulations of the absorbed dose rate to water at a point by modelling a 9 L aquarium for which we have measured the absorbed dose rate to water at a depth of 7.5 cm in previous work to 54 ± 2 mGy/h (Hurem et al. Citation2017). Based on current best estimates for the strengths of the modelled sources, the simulated value was 53.6 mGy/h. The values are in excellent agreement, but further validation of simulated absorbed dose rates should be conducted for future exposures; over various cross sections of the gamma field to validate its geometry, and at a range of water depths to validate the simulated spectrum.
Applying the dosimetry framework to microcosm exposures
Based on input from regular users and expert users, the dose recording and reporting application calculates whole-system or whole-body accumulated absorbed doses along with average, minimum and maximum absorbed dose rates () plus additional information (the resulting dose report for the microcosm exposures is available as supplementary information). The dose report suggests how users can report information on doses as text in e.g. a publication (Setup 19 received an accumulated absorbed dose to water for the whole-microcosms of 8.8 Gy over a net exposure time of 466 h at an average beam-on absorbed dose rate of 19. mGy/h (range from 17. mGy/h to 20. mGy/h)). It also provides a .csv file with these data () for use in further analyses. The framework is designed to encourage users to consider effects from their exposures versus numerical values of accumulated absorbed doses and dose rates whenever appropriate, rather than using ordinal lists of (sometimes nominal) dose levels.
Table 2. Microcosms received the following accumulated whole-system absorbed doses to water at the following average, minimum and maximum whole-system absorbed dose rates.
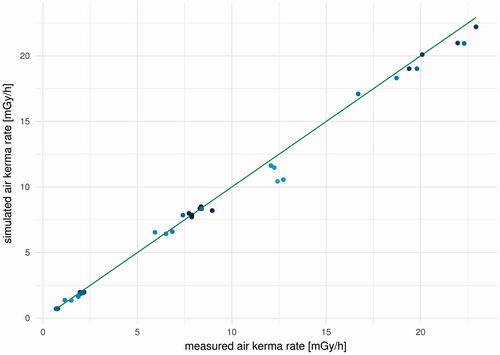
At the discretion of expert users, the dose recording and reporting application reports simulated air kerma rates across the front of setups and compares simulated air kerma rates with measured air kerma rates (). The latter can serve as a useful checkpoint, calling for caution when simulated and measured air kerma rates show larger than expected deviations. If this occurs, it is reasonable to first investigate setup positions (in the simulations and in real life), beam-open and beam-shut times during measurements, and the recording of this information.
Figure 5. Simulated air kerma rates over the back and front of empty microcosm containers versus air kerma rates at the same positions measured with nanoDots (on 2 November 2016, relative standard uncertainty estimated to 5%). The green solid line shows the criterion for perfect agreement (simulated value equal to measured value). The color scale on the data points illustrates the distance from the SSDL-defined field axis (over a cross section of the hall perpendicular to this axis) divided by the distance (along this axis) to the source focus. Lighter points represent larger values, e.g. measurement points that are far away from the SSDL-defined field axis.
Discussion
In this paper, we have presented and demonstrated an external gamma exposure characterization and dosimetry framework for FIGARO. The framework encourages users to consider effects data from gamma exposures at FIGARO against whole-system or whole-body absorbed dose rates and accumulated doses. When effects data are presented versus absorbed dose rates and accumulated doses, and with information on the type of exposure, dose-response results from different experiments or situations can be compared. When this information is missing, it is difficult to interpret results from exposures, to compare results with literature data and to put these results into context.
In the working guidelines of the framework, it is the responsibility of expert users to provide simulated, calculated or estimated whole-system or whole-body absorbed dose rates (on reference dates). The Geant4 model of the FIGARO exposure hall and source can be updated with the geometries of concrete setups so that such absorbed dose rates can be simulated, as was demonstrated for the microcosm exposures (Hevrøy et al. 2017). Otherwise, expert users can resort to tabulated information (e.g. on depth dose curves through water phantoms (McKenzie Citation1996)), direct measurements of absorbed doses (at certain points, e.g. in phantoms (Bjerke and Hetland Citation2014; Graupner et al. Citation2016)) or any other appropriate methods: ideally a combination of methods is preferable. It is important to be aware that different setups require different approaches. For thin specimens exposed in air (such as plants) it is necessary to consider buildup conditions (or the lack thereof); for larger organisms in air (like mice) we may want to calculate whole-body absorbed dose rates for different orientations and positions of the animals in their cages and estimate an average (Graupner et al. Citation2017); and for setups with soil or water habitats, we need to account for the variation in absorbed dose rates with depth due to attenuation and scattering in the media (Hurem et al. Citation2017). Geant4 simulations are useful in all these cases, but are limited by the ease and accuracy by which setups can be modelled. The current Geant4 application for FIGARO can be improved by allowing users to define setups via macros rather than directly in the source code.
The results presented in this paper are valid for the current distribution of 60Co activity in the source. When the source is refilled, the field in the exposure hall will change. This will require new reference measurements of air kerma rates and it will require new best estimates for the strengths of the modelled sources. With an improved source design, it could be feasible to significantly reduce the number of modelled sources. We recommend that a source refill incorporates a source whose geometry and activity distribution are well characterized. A source with a smaller size will make the field flatter (especially in the vertical direction) so that larger setups may be placed closer to the source focus.
Reproducibility has been a main motivation for developing the framework; we want sufficient information on exposures at FIGARO to be available and accessible, so that exposures can be reproduced either at FIGARO or at other facilities.
dosereport-final.pdf
Download PDF (324.8 KB)ssdl_2013.csv
Download Comma-Separated Values File (965 B)Acknowledgements
The authors wish to thank H. Bjerke and P.O. Hetland at the SSDL at the NRPA and D. A. Brede at CERAD/NMBU for measurements at FIGARO and for many good discussions. We are grateful to T.H. Hevrøy, A. L. Golz, L. Xie and C. Bradshaw for their permission to include data from the work on microcosms as an example of a dosimetry evaluation.
Disclosure statement
The authors report no conflicts of interest.
Additional information
Funding
Notes on contributors
E. L. Hansen
E. L. Hansen, PhD, is a Senior Advisor at the Norwegian Radiation Protection Authority. She holds a research position at the Centre for Environmental Radioactivity (CERAD CoE), where she also completed her post doc. Her background is in physics.
O. C. Lind
O. C. Lind, PhD, is an Associate Professor of Radioecology/Environmental Chemistry and Research Director at the Centre for Environmental Radioactivity (CERAD CoE), Norwegian University of Life Sciences, Norway.
D. H. Oughton
D. H. Oughton, PhD, is a Professor of Environmental/Nuclear Chemistry and Research Director at the Centre for Environmental Radioactivity (CERAD CoE), Norwegian University of Life Sciences, Norway.
B. Salbu
B. Salbu, Doctor of Philosophy, is a Professor of Radiochemistry/Analytical Chemistry and Director at the Centre for Environmental Radioactivity (CERAD CoE), Norwegian University of Life Sciences, Norway.
Related Research Data
References
- Agostinelli S, Allison J, Amako K, Apostolakis J, Araujo H, Arce P, Asai M, Axen D, Banerjee S, Barrand G, et al. 2003. Geant4 - a simulation toolkit. Nucl Instrum Methods Phys Res A. 506:250–303.
- Allaire JJ, Cheng J, Xie Y, McPherson J, Chang W, Allen J, Wickham H, Atkins A, Hyndman R. 2016. rmarkdown: dynamic documents for R. R package version 1.1. https://CRAN.R-project.org/package=rmarkdown
- Allison J, Amako K, Apostolakis J, Araujo H, Arce Dubois P, Asai M, Barrand G, Capra R, Chauvie S, Chytracek R, et al. 2006. Geant4 developments and applications. IEEE Trans Nucl Sci. 53:270–278.
- Allison J, Amako K, Apostolakis J, Araujo H, Arce P, Asai M, Aso T, Bagli E, Bagulya A, Banerjee S, Barrand G, et al. 2016. Recent developments in Geant4. Nucl Instrum Methods Phys Res A. 835:186–225.
- Bjerke H, Hetland PO. 2014. The gamma irradiation facility FIGARO - report on the measurements of dose rate in the cobolt-60 irradiation field. Technical Document. 2.. Østerås, Norway: Norwegian Radiation Protection Authority.
- Geant4 Collaboration. 2006. Geant4 Software License Version 1.0 [accessed 2017 Oct 23]. http://geant4.web.cern.ch/geant4/license/LICENSE.html
- Graupner A, Eide DM, Instanes C, Andersen JM, Brede DA, Dertinger SD, Lind OC, Brandt-Kjelsen A, Bjerke H, Salbu B, et al. 2016. Gamma radiation at a human relevant low dose rate is genotoxic in mice. Sci Rep. 6:32977.
- Graupner A, Eide DM, Brede DA, Ellender M, Hansen EL, Oughton DH, Bouffler SD, Brunborg G, Olsen AK. 2017. Genotoxic effects of high dose rate x-ray and low dose rate gamma radiation in ApcMin/+ mice. Environ Mol Mutagen. 58:560–569.
- Hansen EL, Hetland PO. 2017. Air kerma measurements with Landauer nanoDots in Cs-137 and Co-60 beams. Part I - SSDL exposures free in air. Technical Document 8. Østerås, Norway: Norwegian Radiation Protection Authority.
- Hevrøy TH, Golz A-L, Xie L, Hansen EL, Bradshaw C. Submitted. Ecological effects of ionizing radiation in a freshwater microcosm.
- Hurem S, Gomes T, Brede DA, Hansen EL, Mutoloki S, Fernandez C, Mothersill C, Salbu B, Kassaye YA, Olsen AK, et al. 2017. Parental gamma irradiation induces reprotoxic effects accompanied by genomic instability in zebrafish (Danio rerio) embryos. Environ Res. 159:564–578.
- ICRP. 2007. The 2007 Recommendations of the International Commission on Radiological Protection. ICRP Publication 103. Ann ICRP. 37:2–4.
- Kryuchkov V, Chumak V, Maceika E, Anspaugh LR, Cardis E, Bakhanova E, Golovanov I, Drozdovitch V, Luckyanov N, Kesminiene A, et al. 2009. RADRUE method for reconstruction of external photon doses for Chernobyl liquidators in epidemiological studies. Health Phys. 97:275–298.
- Landauer. [date unknown]. InLight\textregistered Complete Dosimetry System Solution nanoDot\texttrademark Dosimeter, [accessed Oct 23] http://www.landauer.com/uploadedFiles/InLight/_nanoDot/_FN.pdf
- Lind OC, Oughton DH, Salbu B. Forthcoming. The NMBU FIGARO low dose irradiation facility. Int J Radiat Biol. 1 [accessed 2018 Nov 1]; Doi: 10.1080/09553002.2018.1516906.
- McKenzie AL. 1996. Cobalt-60 gamma-ray beams. BJR Suppl. 25:46–61.
- R Core Team. 2017. R: a language and environment for statistical computing.. Vienna, Austria: R foundation for statistical computinghttps://www.R-project.org/
- Soetaert K, Van den Meersche K, van Oevelen D. 2009. limSolve: solving linear inverse models. R-package version 1.5.1. https://CRAN.R-project.org/package=limSolve
- Teimouri Sichani B, Sohrabpour M. 2004. Monte Carlo calculations for radiotherapy machines: Theratron 780-C teletherapy case study. Phys Med Biol. 49:807–818.
- United Nations Scientific Committee on the Effects of Atomic Radiation (UNSCEAR). 2000. Exposures and effects of the Chernobyl accident. UNSCEAR 2000 Report Vol. II. Annex J.
- United Nations Scientific Committee on the Effects of Atomic Radiation (UNSCEAR). 2008. Radiation exposures in accidents. UNSCEAR 2008 Report Vol. II. Annex C.