
Abstract
Purpose: To examine the effects of low-dose exposure to uranium with a systems biology approach, a multiscale high-throughput multi-omics analysis was applied with a protocol for chronic exposure to the rat kidney.
Methods: Male and female rats were contaminated for nine months through their drinking water with a nontoxic solution of uranyl nitrate. A multiscale approach enabled clinical monitoring associated with metabolomic and transcriptomic (mRNA and microRNA) analyses.
Results: A sex-interaction effect was observed in the kidney, urine, and plasma metabolomes of contaminated rats. Moreover, urine and kidney metabolic profiles correlated and confirmed that the primary dysregulated metabolisms are those of nicotinate-nicotinamide and of unsaturated fatty acid biosynthesis. Upstream of the metabolic pathways, transcriptomic profiles of the kidney reveal gene activity focused on gene regulation mechanisms, cell signaling, cell structure, developmental processes, and cell proliferation. Examination of epigenetic post-transcriptional gene regulation processes showed significant dysregulation of 70 micro-RNAs. The multi-omics approach highlighted the activities of the cells' biological processes on multiple scales through analysis of gene expression, confirmed by changes observed in the metabolome.
Conclusion: Our results showed changes in multi-omic profiles of rats exposed to low doses of uranium contamination, compared with controls. These changes involved gene expression as well as modifications in the transcriptome and the metabolome. The metabolomic profile confirmed that the main molecular targets of uranium in kidney cells are the metabolism of nicotinate-nicotinamide and the biosynthesis of unsaturated fatty acids. Additionally, gene expression analysis showed that the metabolism of fatty acids is targeted by processes associated with cell function. These results demonstrate that multiscale systems biology is useful in elucidating the most discriminative pathways from genomic to metabolomic levels for assessing the biological impact of this low-level environmental exposure, i.e. the exposome.
1. Introduction
The rates of diseases such as metabolic syndrome, infertility, neuropsychiatric disorders, and cancers have been rising for decades (Mnif et al. Citation2011; Schug et al. Citation2011; Campion et al. Citation2012; Vandenberg Citation2012; Skinner et al. Citation2013). According to the World Health Organization (WHO), in 2012 more than 12 million people died because of their unhealthy environment (WHO Department of Public Health Easdoh Citation2016). Among the many factors that may explain these outcomes, the chronic low-dose environmental exposure of populations to multiple stressors is a priority policy concern for public health improvement. Risk assessments of these exposures require enhanced efforts, especially for identifying early biomarkers of delayed disruptive events that are easy to use for diagnostic purposes in a large-scale exposed population. In this context, ionizing radiations are one of the environmental stressor sources that could combine with chemical exposure to produce synergistic effects. Over the past century, military and civil activities have added cumulative doses of ionizing radiation (MacKenzie Citation2000; Hu et al. Citation2010) to those from natural sources (telluric and cosmic), thereby heightening the risk of adverse effects and delayed diseases (European-Commission Citation2009). Moreover, the risk from internal contamination by radionuclides, compared to external ionizing radiation emitters, is still higher, because of its greater cell toxicity (which nonetheless varies with its biokinetics and target organ). Improvement in radioprotection of populations chronically exposed to low-dose radionuclide contamination has, therefore, become a social and scientific concern.
Among the radionuclides, uranium is a particularly interesting telluric element (∼2 mg Kg−1 in Europe) with its dual toxicity (radioactive as an alpha particle emitter and chemical as a heavy metal). Low doses of uranium can be easily ingested by mammals from many sources including spring water, phosphate fertilizers, nuclear fuel exploitation, and military weapons. Depending on where they live, therefore, human populations can be chronically exposed to low doses of environmental uranium (Pereira et al. Citation2014; Zhivin et al. Citation2014; Jakhu et al. Citation2016; Besic et al. Citation2017; Bigalke et al. Citation2018; Faa et al. Citation2018).
By definition, low doses induce only small biological effects (Hubert Citation2010). Nevertheless, delayed adverse effects of such exposures cannot be ruled out, especially when they are chronic or take place during a sensitive fetal developmental window (Poore et al. Citation2017) or growth (Preston Citation2004), or are affected by sex-dependent differences in toxicology (Gochfeld Citation2017). Unfortunately, the absence of any clinical signs of low-dose exposure makes understanding these effects in complex dynamic systems very challenging, in part because of the lack of scientific knowledge and in part due to the multiplicity of parameters influencing it (i.e. nonlinear low-dose-response relations (Calabrese Citation2004; Tubiana et al. Citation2009; Lagarde et al. Citation2015) that overlap numerous confounding factors (Mothersill and Seymour Citation2009, Citation2014).
However, the emergence of new analytical technologies, characterized by their chemical selectivity, instrumental sensitivity, and the robustness of their analytical methods (the so-called ‘omics’ technologies), has improved our ability to analyze complex molecular systems. For example, global untargeted observations can be performed in a homeostatic biological background (Morgan and Bair Citation2013). Moreover, these omic methods allow a multiscale systems biology approach, i.e. enable the study of dynamic gene expression by the joint analysis of mRNAs, miRNAs (micro-RNAs), and molecules at the top level of the system, such as metabolites (the global analysis of which is metabolomics) (Oliver et al. Citation1998). These final products of gene expression are considered the last step leading to the individual’s phenotypic presentation, so that analysis of the metabolome can be used to describe the homeostatic state of a living organism at a given time (Fiehn Citation2002). These methodological approaches, combined with statistical methods for processing data, may help to understand the underlying dynamic mechanisms of homeostatic regulation by explaining the molecular relations that allow the cell to survive in a stressful environment. In addition, comparison of different phenotypic traits makes it possible to identify potential biomarkers for a given pathological state.
Our aim in this study was to analyze the in vivo effects of chronic low-dose uranium intake in rats by using multi-omics approaches including transcriptomics (mRNAs and miRNAs) and metabolomics to determine the specify cellular system dysregulated. Close attention was paid to the kidneys, which are known to be the toxicological target of uranium and to differ morphologically between male and female rats. This work could be useful for improving health policies, by identifying early prognostic markers for an elevated risk of delayed adverse effects in the different molecular profiles.
2. Material and methods
2.1. Materials
Ultrapure water was produced from a Milli-Q® system (Merck Millipore, France). Natural uranium (NU, Mc Arthur) was obtained from CERCA (Pierrelatte, France). Uranyl nitrate hexahydrate (UO2(NO3)2,6H2O) was prepared to obtain a final uranium concentration (NU) of 40 mg L−1 in drinking water obtained from Evian® (Evian-les-Bains, France) for a daily uranium intake dose of 1 mg per rat (1.8 mg Kg−1 on average) (Paquet et al. Citation2006; Dublineau et al. Citation2014). The amount of uranyl intestinal absorption is estimated around 0.06% for rats. In our experimental model, the daily uranium dose transferred from intestine to the blood flow was estimated to 0.001 mg Kg−1 d−1. The specific activity of the NU was 2.42 × 10⁴ Bq g−1, and its isotopic composition was 238U = 99.307%, 235U = 0.688%, and 234U = 0.005%. Claritas PPT grade nitric acid, used for uranium assays, was produced by Horiba Scientific (Longjumeau, France). Isoflurane used for anesthesia was produced by Abbot France (Rungis, France).
2.2. Animal experiments
2.2.1. Animal treatment
Outbred Sprague-Dawley rats, 12 weeks old and 16 days pregnant, were obtained from Charles River Laboratories (L’Arbresle, France). They were housed individually and maintained in a monitored environment (temperature 21 °C and 50% humidity) under a light-dark cycle (dark on from 8:00 pm to 8:00 am). A standard rodent pellet diet and water were available ad libitum.
From birth, both mothers and newborns of the treated group were exposed to NU through their drinking water. During the three weeks of weaning, offspring were mostly contaminated by the mother’s milk (human offspring receive ∼5% of the mother’s daily uranium dose (Wappelhorst et al. Citation2002). After weaning, mothers were euthanized. Their offspring were housed, each paired with a rat from a different mother (assigned by randomization to form groups of 20 animals per condition) to the age of 9 months; during this period they were contaminated by NU through their drinking water. Finally, the control group of rats received uncontaminated Evian® drinking water ad libitum. All animals were euthanized at 9 months of age. The experimental procedures were approved by the Animal Care Committee of the Institute of Radioprotection and Nuclear Safety (IRSN) and complied with the French regulations for animal experimentation (Ministry of Agriculture Act No. 87-848, 19 October 1987, modified 20 May 2001).
2.2.2. Sample collection
Based on previous results (Grison et al. Citation2016), at the age of 6 months, the rats were placed in metabolic cages (in the morning, one per cage), with access to a rodent ground pellet diet and water (contaminated or not) ad libitum. Urine was collected twice a day for 48 h, with sodium azide (0.01%) added to prevent bacterial growth (Griffin et al. Citation2001) and stored at 4 °C. All urine samples for each rat were pooled, mixed, and frozen at −80 °C. At the age of 9 months, the rats were moved back to conventional cages (one per cage) with food and drink ad libitum until the evening to reduce stress. To control the diet cycle, food was removed in the evening until the next morning. Five hours before euthanasia, around 12 g of standard rodent pellet food was added directly to each cage to normalize food intake for all rats. Four hours later, rats were anesthetized by inhalation of 5% isoflurane before an intracardiac puncture euthanized them and collected blood, in heparinized tubes. Whole blood was centrifuged (5000 rpm) and plasma supernatants were immediately frozen at −80 °C. Kidneys were dissected on ice, weighed, deep-frozen in liquid nitrogen, and stored at −80 °C until analysis and measurement of uranium concentration.
2.3. Clinical evaluation
2.3.1. Animal monitoring
Throughout this protocol of NU exposure, intake of food and water was weighed weekly and each rat monthly.
2.3.2. Uranium level in kidney samples
To measure the NU burden in kidneys, samples were prepared by adding 8 mL of ultrapure nitric acid (69%) and 2 mL of hydrogen peroxide (30%), and then mineralized in a 1000 W microwave (Ethos Touch, Milestone Microwave Laboratory Systems, (Sorisole, Italy) with an increasing rate of 9 degrees per minute until a temperature of 180 °C that was maintained for 10 min. Samples were analyzed by inductively coupled plasma-mass spectrometry (ICP-MS; XSERIES 2, ThermoElectron, France). Experimental conditions were optimized by using a multi-element standard solution (ThermoElectron, France), and bismuth 209 was added to all samples as an internal standard at 1 µg L−1. A calibration curve was calculated based on a standard solution at 1000 mg L−1 in 2% nitric acid freshly diluted to obtain (0, 0.001, 0.005, 0.01, 0.1, 0.5, and 1 µg L−1) in 2% nitric acid. A linear relation-count number (iU) = f([iU]) was calculated for each isotope, i = [235;238] with [iU] equal to the isotope concentration in µg L−1. The ICP-MS limit of detection for uranium is 1 ng L−1.
2.3.3. Chemical assessment in plasma and urine samples
An automated spectrometric system (Konelab 20 from ThermoElectron Corporation, France) was used for biochemical measurements of thawed plasma and urine samples, with the manufacturer’s biological chemistry reagents and protocols. To obtain a global overview, some biochemical and clinical parameters were measured in plasma, including ALAT/GPT, ASAT/GOT, albumin, direct bilirubin, total bilirubin, calcium, cholesterol, CK-MB, creatinine, iron, glucose, HDL-cholesterol, chlorine, potassium, sodium, LDH, LDL-cholesterol, magnesium, alkaline phosphatase, phosphorus, total proteins, phospholipids B, transferrin, triglycerides, and urea. In addition, urinary volume/24 h, amylase, uric acid, creatinine, glucose, chlorine, potassium, sodium, phosphorus, calcium, total proteins, and urea were measured in urine. Values of the biochemical and clinical parameters are reported as means ± standard errors of the means (SEM). Statistical analysis was also performed with SigmaStat statistical software (SPSS, Paris, France) to calculate items such as Student's t-test in normal populations or the rank sum test in non-normal populations for comparison of the control and contaminated groups. Statistical significance was defined by a p value less than .05.
2.4. Omics approaches
2.4.1. Metabolomic analyses
2.4.1.1 Sample preparation procedures
2.4.1.1.1. Kidney samples
Thawed kidney tissue samples (10–20 mg) were added to cold methanol (40 µL per mg) and placed in a powerful grinding mixer mill system (MM400, Retsch Technology) with two metallic balls. Samples were homogenized for 2 min at 25 Hz, incubated 30 min at 20 °C, and centrifuged for 15 min at 11,000 rpm and 4 °C. From each sample, 350 µL of supernatant was again centrifuged under the same conditions, and the upper phase dried in a new vial under nitrogen flow. Dried extracts were dissolved into 175 µL of water plus 0.1% formic acid. Samples were vortexed for 1 min and centrifuged as described above. Finally, the supernatant was transferred into HPLC vials and stored at −80 °C until analysis.
2.4.1.1.2. Plasma samples
For hydrophilic plasma metabolites, samples were diluted with two volumes of cold methanol (−20 °C) and slightly homogenized before incubation for 30 min at −20 °C to precipitate proteins and then centrifuged for 15 min at 11,000 rpm and 4 °C. Plasma supernatant was collected and centrifuged a second time for 45 min under the same conditions. Supernatant was dried under nitrogen flow and stored at −80 °C until analysis. Dried plasma extracts were dissolved in 500 µL water plus 0.1% formic acid. Samples were vortexed for 1 min and centrifuged for 15 min at 11,000 rpm and 4 °C. Supernatant was transferred into HPLC vials and stored at −80 °C before analysis (Pereira et al. Citation2010).
2.4.1.1.3. Urine samples
All urine samples were treated before mass spectrometry analysis. Each sample was first centrifuged for 15 min at 11,000 rpm and 4 °C. Then, 100 µL of urine supernatant was diluted with 300 µL ultrapure water (1:4 v/v) and centrifuged again for 5 min at 3000 rpm and 4 °C. Supernatant was divided into 50 µL aliquots, each transferred into an HPLC vial and stored at −80 °C until analysis.
2.4.1.2. LC-MS analyses
Liquid chromatography-mass spectrometry (LC-MS) analyses were performed with electrospray ionization (ESI)-hybrid quadrupole-time of flight (micrOTOF) mass spectrometer (Bruker, Wissembourg, France) coupled to the Agilent 1200 RRLC chromatographic system. Chromatographic separation was performed as described previously (Grison et al. Citation2016).
Mass spectra were acquired in the m/z 50-1500 range with a cycle time of 15 min per analysis. Internal mass calibration was performed by injecting sodium formate acetate solution at the beginning of every run. The conditions of instrumentation have previously been described (Grison et al. Citation2016). Tandem mass spectrometry (MS/MS) experiments were performed on the monoisotopic peaks of some metabolite species, with the following parameters: precursor ion isolation width 0.8 u, cell collision energy about 15–30 eV.
All group samples were randomized and analyzed in 5 analytical batches of 60 samples each, to minimize analytical variability (Dunn et al. Citation2011). In addition, a quality control sample (QC) representing a pool of each matrix collected from every prepared sample was made-up to evaluate data quality. The QC sample was injected ten times at the beginning of each batch for column equilibration and then analyzed throughout the batch series after every set of 5 samples.
2.4.1.3. Data analysis
2.4.1.3.1. Data pre-processing and chemometric analyses
LC-MS raw data were converted to netCDF file format with the manufacturer's DataAnalysis software (Bruker, Wissembourg, France). The pre-processing workflow, based on XCMS software including the CAMERA script and all alignment and filtration steps, were as previously described (Grison et al. Citation2016). SIMCA-P + 12.0 software (Umetrics, Umeå, Sweden) was used for multivariate statistical analyses. Partial least squares discriminant analysis (PLS-DA) models were validated by CV-ANOVA and permutation tests.
2.4.1.3.2. Metabolite selection and identification
The most discriminant variables were selected, according to their variable importance in projection (VIP) scores SIMCA algorithm; and normal probability plot (NNP) distribution were used to determine the appropriate threshold of significance. The robustness of these features for discriminating the control and NU groups was validated by testing the receiver operating characteristic (ROC) curve.
Putative metabolite annotation was performed by using the MZedDB database browser (Aberystwyth University, United Kingdom), freely available online (Draper et al. Citation2009), based on the chemical formulas generated from the accurately measured masses (error <10 ppm) and isotopic patterns (calculated with Bruker DataAnalysis software). The putative annotations enabled the purchase of authentic standard molecules, and MS/MS experiments were performed when sufficient peak intensity was obtained for discriminant ions in the biological samples. Full MS and MS/MS spectra were compared between authentic standard molecules, biological samples, and spectral databases (mainly HMDB, Metlin, and MassBank) for metabolite identification. Finally, we used both the Cytoscape plug-in Metscape (Gao et al. Citation2010) to map the metabolites into KEGG metabolic pathways and Metaboanalyst (Xia and Wishart Citation2016) to analyze the metabolomic data.
2.4.2. Transcriptomic analyses
2.4.2.1. Sample preparation procedures
Total RNA was isolated from 30 mg of frozen kidney sample with the mirVanaTMisolation kit (ThermoFisher Scientific, France), according to the manufacturer’s protocol.
2.4.2.2. RNA microarray analysis
Total RNA concentration and purity were assessed by a NanoDrop ONE Spectrophotometer (ThermoFisher Scientific, France), and RNA integrity was evaluated with the RNA 6000 Nano Chip Kit (Series II) and Agilent 2100 Bioanalyzer System (Agilent Technologies, Waldbronn, Germany and Palo Alto, CA). Quality of RNA was defined by a 260/280 absorbance ratio >1.8; a 260/230 ratio >1.5 and a RIN value >7.5 were desired.
Each experimental group (control and NU-contaminated) was differentially labeled by Cyanine 3-CTP (Cy3) or Cyanine 5-CTP (Cy5). Labeled RNAs were hybridized on SurePrint G3 8 × 60 K microarrays (Agilent Technologies) at 65 °C for 17 h in an Agilent Microarray hybridization chamber rotating at 10 rpm, according to the manufacturer's protocol for two-color microarray-based gene expression analysis, low input quick amp labeling, version 6.9.1. Slices were scanned with the DNA Microarray Scanner SureScan (Agilent Technologies). Fluorescent signal intensities for each microarray spot were extracted and quantified by using Feature Extraction software V 10.7.3.1 (Agilent Technologies).
2.4.2.3. miRNA expression analysis
In accordance with the manufacturer’s protocol, Megaplex with Preamplification (Applied Biosystems, Foster City, CA) was used to analyze miRNA expression profiles from 3 µL containing 100 ng total RNAs previously extracted from kidney samples (n = 20). The qPCR was performed on a QuantStudio 12 K Flex system with 384 TLDA arrays (Applied Biosystems).
2.4.2.4. Data analysis
2.4.2.4.1. Data pre-processing and statistical analysis
The raw data obtained from the DNA microarray (N = 10) were analyzed by R version 3.3.2 with the R-package Limma, by following the instruction in the manual (Ritchie et al. Citation2015). Genes were considered differentially expressed (DE) when the adjusted p value was below .05.
For miRNA expression, comparative threshold (Ct) values were analyzed by QuantStudio 12 K Flex Software V1.2.2 and then by Expression Suite Software V1.0.4 (Applied Biosystem, ThermoFisher Scientific, Villebon sur Yvette, France) to obtain a clean data matrix. Cleaned data were exported to DataAssist v3.01 (Applied Biosystem, ThermoFisher Scientific, Villebon sur Yvette, France) to exclude outlier samples and miRNAs. Given the difficulty of observing statistical differences for miRNAs known for their low level of fluctuation, especially in low-dose exposure contexts, we used an ‘elastic net’ linear regression model to search for miRNAs that contributed to either the control or the uranium group. Elastic Net performs best when there are many more predictors (p) than observations (n). The data table obtained after miRNAomics contains values that are no longer available after quality control. We used the Bayesian PCA (principal component analysis) tool available in the R-PCA Methods Bioconductor package (Schmitt et al. Citation2015) to impute the missing values.
After data imputation, the Elastic Net method from the glmnet R-package was run (Friedman et al. Citation2010). The mixing parameter alpha for Elastic Net was tuned through a line search with a range between 0 (Ridge) and 1 (LASSO) with increasing steps of 0.01. The best values for alpha and for lambda were estimated through cross-validation to produces the lowest mean-cross-validated error with a fixed folded vector. Both values were then used to calculate the best predictors.
2.4.3. Multiscale systems biology
The list of miRNAs obtained from Elastic Net was used to depict a multiscale network of the data from the miRNAomic, transcriptomic, and metabolomic analyses. A database search was performed to find targets of the miRNA. The miRTarBase database (Hsu et al. Citation2011; Chou et al. Citation2018), which includes experimentally validated miRNA-target interactions, was searched to find these targets. We defined a target of interest whether the gene is present in one of the following metabolic pathways identified by the metabolomic results (those to which the most discriminant metabolites identified belonged). In addition, other pathways in which as genes obtained from the transcriptomic results were also included. The interactions between miRNA and their targets, and interactions between genes and pathways were visualized in a multiscale network with Cytoscape version 3.4.0 (Shannon et al. Citation2003).
3. Results
3.1. Clinical monitoring
The clinical evaluation based on consumption of drinking water and of food and on body weight gain showed no significant statistical differences between controls and the contaminated group among either males or females.
Similarly, none of the clinical markers assessed in plasma and urine samples, including ions and kidney markers (data not shown), revealed any significant differences that might reflect either a significant metabolic disorder or an adverse health effect associated with these NU exposure conditions. A mean NU concentration in kidney tissue less than 500 ng.g−1 (data not shown) confirmed its tubular accumulation in the chronically contaminated rats and, as previously reported, its non-nephrotoxic level, confirmed by histological observations (Leggett Citation1989; Dublineau et al. Citation2014; Poisson et al. Citation2014). Moreover, for 1.6 g of kidney mass, the absorbed dose rate in the kidneys of the contaminated rats, was estimated at 9 months of age at 5.4 9 10-7 Gy d-1. Under the maximizing assumption of a constant dose rate over 9 months, the maximum dose absorbed by the kidneys at sacrifice should still be as low as 0.15 mGy and considered as a very low dose of radiological exposure as previously reported (Grison et al. Citation2013).
3.2. Metabolomic profiles
3.2.1. Discrimination of sex and NU contamination in kidney profiles
The LC-MS data for the supernatant extracted from the kidney tissue (624 variables) were run on different PLS-DA models. The first model was calculated on the matrix that included all samples – males, females, NU-exposed, and control – and taking into account the dummy matrix representing the sex effect. This PLS-DA model showed a very clear separation between males and females (CV-ANOVA = 2.5e−32, R2Y = 95.9%, Q2Y = 91.3%). That is, as expected, it revealed a highly discriminant molecular dimorphism associated with the sex of rats, which obscured the effect of the 9-month NU contamination. Therefore, a second PLS-DA model was calculated on the same matrix but treating the exposure effect as the dummy matrix. This model (CV-ANOVA = 1.2e−28, R2Y = 94.5%, Q2Y = 87.8%) successfully discriminated between the control and contaminated rats (male and female combined). In this model, however, the distinction between the male and female rats could not be observed directly.
Next, two validated and robust PLS-DA models were run separately for males and females to assess the sex differences associated with NU exposure (CV-ANOVA = 3.1e-16/2.0e−19, R2Y = 91.2/92.2%, Q2Y = 89.5/90.2%). The untargeted metabolomic analysis clearly discriminated NU contamination in both the male and female rat groups and confirmed the high impact of NU on the kidney cell metabolism.
Based on their VIP (>2.24) and NPP threshold (p > 95%), LC-MS identified 31 features discriminating NU from control rats among both males and females. Among the males in the NU group, 27 variables increased and 4 decreased, and among the females, 26 increased and 5 decreased. Of these discriminant features, 23 were common to both sexes (74% similarity) and thus revealed the low sexual dimorphism relative to NU exposure (). Most of these 23 discriminant features increased (from +27 to 192%). PLS-DA characteristics combined in a composite score yielded an area under the curve (AUC) value equal to 1 when tested by the ROC curve) (figure not shown). This result validates the robustness of these features for discriminating between the control and NU groups.
Table 1. Main discriminant markers in the three biological matrices (plasma, urine and kidney) for both male (M) and Female (F). Rate differences between control and NU contaminated values are noted in percentage. (B) In plasma, 34 variables were discriminative for male (blue) and 34 for female (pink). 17 were common for both. In kidney, 31 variables were discriminative for male and 31 for female. 23 were common for both. In urine 226 variables were discriminative for male and 222 for female (17 were common for both).
Table
3.2.2. Discrimination of sex and NU contamination in plasma profiles
As expected, the PLS-DA for plasma profiles, calculated with sex as the predictor variable Y (CV-ANOVA p = 0, R2Y(cum) = 97.4%, Q2 (cum) = 95.4%) demonstrates a very clear separation between males and females after 9 months of contamination. Discrimination between the control and contaminated group was also good with the PLS-DA model using NU contamination as predictor variable Y (CV-ANOVA p = 9.4e−24, R2Y(cum) = 84.7%, Q2(cum) = 80.2%).
The PLS-DA model (CV-ANOVA p = 6.5e−15, R2Y(cum) = 93%, Q2(cum) = 86.8%) showed that the features in the male group very clearly discriminated the NU-contaminated from the control group. The model's discrimination for female rats was also good, although not as good as for males (CV-ANOVA p = 4.0e−8, R2Y(cum) = 77.5%, Q2(cum) = 68.1%). For both male and female models, the NPP, based on the PLS-DA coefficients for each mode, again selected the same number of features for male and female rats (34 each), and 17 features increased and 17 decreased for both the male and female groups of contaminated rats (). The comparison of these discriminant features in the plasma metabolome showed that 17 were shared by males and females: 4 decreased and 13 increased among the contaminated rats. This result indicates low sexual dimorphism between males and females, with only 50% of shared features discriminating NU exposure. The VIP score rate showed that 5 of these 17 common features were among the most discriminative ().
3.2.3. Discrimination of sex and NU contamination in urine profiles
The PLS-DA discriminant analysis performed on all male and female samples (exposed and non-exposed) with sex as predictor variable Y confirmed a sex difference observable in the metabolome (CV-ANOVA p = 0, R2Y(cum) = 99.3%, Q2(cum)=98.1%). Like those for the other biological matrices, this strong sex fingerprint (all observable by PCA analysis) prevented a direct distinction between contaminated and non-contaminated rats. The PLS-DA model calculated with NU contamination as the predictor variable Y initially did not discriminate NU contaminated rats (p = 1) in a mixed population of males and females; this situation changed when the most discriminant features were selected based on their VIP score in the PLS-DA model (CV-ANOVA p = 4.6e−10, R2Y(cum) = 79.0%, Q2(cum)=61.6%).
Discrimination between control and contaminated rats by the PLS-DA model of male rats only was good after variable selection (CV-ANOVA p = 1.0e−5, R2Y(cum) = 95.7%, Q2(cum) = 76.2%). Of the 226 discriminant features selected for their high NPP threshold value, 115 decreased and 111 increased in the contaminated group. The PLS-DA was also able to discriminate between control and contaminated female rats after variable selection (CV-ANOVA p = 7.9e−11, R2Y(cum) = 98.4%, Q2(cum) = 89.4%). They had 222 discriminant features selected for their NPP values, based on the PLS-DA coefficients, 106 decreased and 116 increased in the contaminated group. The males and females shared 34 discriminant features (15 decreased and 19 increased in the contaminated group). These metabolomic analyses of the urine showed that the sexual difference is strong, with only 18% similarity between the male and female groups ().
3.2.4. Main marker identity
Putative annotation of the most discriminant features was performed with the freely accessible MZedDB database browser. The MS/MS spectra of some of these discriminative ions in biological samples were then compared with their authentic standard molecules to confirm the putative identification. presents a list of the main discriminative markers identified in each of the three biological matrices. Palmitic acid, pentanoic acid, nicotinamide D-ribonucleotide, riboflavin-5-phosphate, phytosphingosine, prostaglandin F1 alpha, 2-lysolecithin, glycochenodeoxycholate 7-sulfate, linoleic acid, oleic acid, 25-Hydroxyvitamin D3, and palmitoleoyl-ethanolamide were identified in kidney tissue. Docosatetraenoyl ethanolamide, arachidonylethanolamide, dihomo-gamma-linolenoyl ethanolamide, androstanediol, and 7a-hydroxyandrost-4-ene-3,17-dione were identified in plasma. Finally, N1-methyl-2-pyridone-5-carboxamide, 4-hydroxyphenylacetylglycine, 4-pyridoxic acid, lysophosphatidylcholine (LysoPc 16:0), creatine, and N1-methylnicotinamide were found in urine.
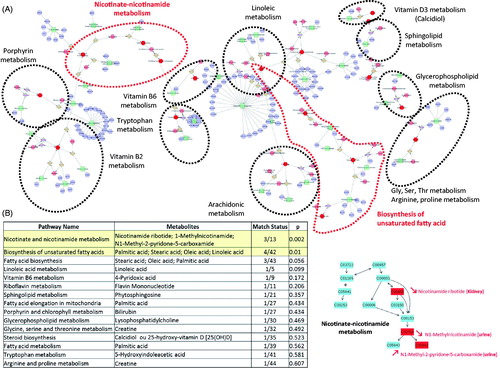
Their putative identifications show that these discriminant metabolites represent essentially the metabolisms for fatty acid, nicotinate-nicotinamide, steroids, vitamin B6, and tryptophan ().
Figure 1. (A) Network of the most discriminant metabolites observed (Cytoscape, Metscape App). Other unreported metabolites are colored pink, biochemical reactions light brown, enzymes in green, and genes in purple. (B) The nicotinate-nicotinamide metabolism was ranked by MetaboAnalyst as the metabolism most strongly affected, with a total of 3/13 affected metabolites (2 revealed in urine and 1 in kidney). Discriminative metabolites are highlighted in red.
3.2.5. Interactions of metabolic pathways
To describe discriminative metabolite relations and to detect the metabolic pathways most strongly affected, metabolic networks of all annotated and identified discriminative metabolites were constructed with the Metscape plug-in for Cytoscape and MetaboAnalyst (http://metaboanalyst.ca). The Metscape analysis of the discriminant markers detected in all three matrices (shown in ) revealed metabolic interactions with some metabolic pathways, including those for tryptophan, riboflavin, nicotinate-nicotinamide, pyridoxine, glycerophospholipid, di-unsaturated fatty acid, linoleate, de novo fatty acid biosynthesis, glycine, serine, alanine, threonine, glycosphingolipid, and cholecalciferol. No plasma metabolites were mapped in these pathways (). The MetaboAnalyst classification tool then showed that nicotinate-nicotinamide (p = .002) and the biosynthesis of unsaturated fatty acid metabolisms (p = .01) were the two metabolic pathways most strongly affected.
3.3. Transcriptomic profiles in male kidney samples
In view of the previous reports of metabolomic results in male rats only, this study also arbitrarily omitted genetic analysis of female rats.
3.3.1. mRNA array
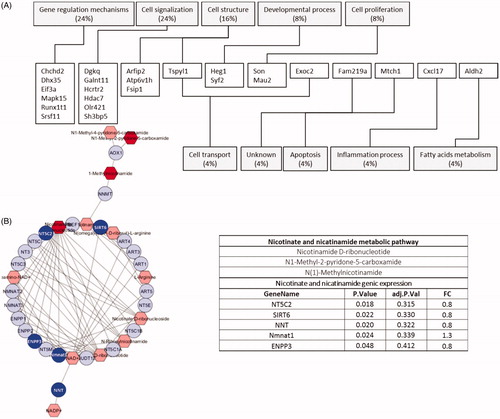
Transcriptomic analysis showed 49 (putative) genes differentially expressed and belonging to a variety of different functional classes, including gene regulation mechanisms (24%), cell signaling (24%), cell structure (16%), developmental processes (8%), and cell proliferation (8%) (). Other genes e.g. NT5C2, SIRT6, NNT, Nmnat1, and ENPP3 might be functionally linked to metabolites, through either a direct or indirect link, according to the Metscape plug-in running the KEGG pathways database ().
Figure 2. (A) Genes differentially expressed in NU-contaminated kidneys. (B) Nicotinate-nicotinamide network (MetScape application of Cytoscape). Discriminant genes (deep blue) and metabolites (dark red) are shown. The p value was not adjusted in order to reveal putative experimental multiscale links.
3.3.2. miRNA analysis
The aim of Elastic Net was to obtain a list of variables that can be used as predictors for the phenotypes of interest. With lambda as 0.01336 and alpha 0.34, Elastic Net obtained a set of 70 miRNAs that can be used as predictors for affected metabolic pathways or cell biological processes (). The results showed an increase in expression (fold change >1) for 42 miRNAs (left-hand side of table) and a decrease (right-hand side of table) in expression (fold change <1) for 28.
Table 2. Micro-RNAs differentially expressed in kidneys of NU-contaminated rates. The left-hand side table shows increased expression of the fold-change (FC), the right-hand side shows a decrease in FC, respectively.
3.4. Multiscale systems biology
The construction of the network was based on links between the discriminative miRNA transcripts, differentially expressed (DE) genes, and metabolomic observations (). miRNAs are linked to mRNAs, presented in deep blue if discriminative in this study (adjusted p value <.05) and in light blue for putative (unadjusted p value <.05) target mRNAs. Metabolic pathways or biological functions are represented in red and increase in size with the number of connecting edges to their transcripts.
Figure 3: Multiscale network depicting data from miRomics in green, transcriptomics in blue, and metabolomics in red. Significantly differential gene expression is noted in deep blue.
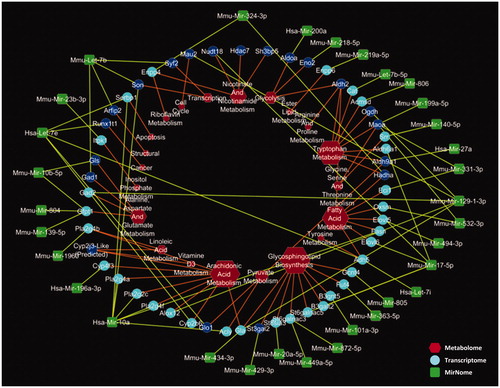
In this network, pathways associated with the metabolism of fatty acids, glycosphingolipids, and arachidonic acid were highly connected, compared with others, such as tryptophan and nicotinate-nicotinamide (, in red). In addition, other pathways, including those for amino acid metabolisms, energy metabolism, and cellular processes, including cell cycle, transcription, apoptosis, and cancer development, as well as aspects of cell structure were connected to DE genes obtained from transcriptomic analyses.
4. Discussion
Organisms undergo stress during either acute or chronic low-dose environmental exposure, e.g. when living in a polluted area. Environmental exposures are suspected to induce delayed adverse effects that might cause increased susceptibility to some cancers and to metabolic diseases through direct metabolic dysregulation or affecting gene transcription by epigenetic regulation processes that can even impact the offspring. However, low-dose exposure has a low-level impact, with measurable effects within or just above the range of homeostatic fluctuation. New analytical strategies must be developed that are able to describe these biological effects that have amplitudes that are often too small to be easily distinguished from the biological background. For example, in our study, despite the retention of NU in the kidney, no clinical signs related to body weight, food/water consumption, or urine/plasma chemical parameters differentiated the contaminated groups of rats of both sexes from the uncontaminated groups. These observations are consistent with previous studies (Grison et al. Citation2013; Dublineau et al. Citation2014) and demonstrate that clinical parameters do not account for any biological effects at this low level of contamination (concentration in kidney less than 450 ng g−1 for a total radiological dose absorbed less than 0.15 mGy). An important point in health risk evaluation is the easily observed genetic differences between the sexes and between people of different ethnic origins; these must be taken into account when drawing conclusions. In addition, age, quality of life, living area, and psychosocial environment are other important parameters that may alter the biological response to various stress stimulants.
In our study, the rat model was contaminated from birth to mimic a real situation in which a growing organism (more sensitive than adults) is exposed to an uranium-polluted residential area to investigate the effect of chronic uranium contamination during growth. As expected, the metabolomic analyses confirmed that the differential effect of sex on uranium exposure was higher in urine and plasma than in kidney samples (respectively, 82%, 50%, and 26% of the metabolite features were sensitive to either gender). These sex-based genetic differences can imply impairment in functionality and cellular sensitivity due to modulation in xenobiotic biokinetics, which can result in higher doses of exposure. In terms of risk, this low metabolic dimorphism in the kidney does not rule out strong differential effects, which will depend on the specific metabolic pathway. Although clinical diagnostics showed no effects, metabolomic results did show a biological effect associated with the chronic low-dose uranium intake. In particular, the metabolisms of fatty acids, nicotinate-nicotinamide, steroids, vitamin B6, and tryptophan were affected by NU exposure. A classification test based on the number of discriminative metabolites involved in each pathway shows that the highest score was for nicotinate-nicotinamide, with unsaturated fatty acids in second place. The nicotinate-nicotinamide pathway has previously been reported to be involved in a uranium-related dose-response effect (Grison et al. Citation2016). Urine is composed of metabolic waste that reflects the maintenance of homeostasis. The final status of urine and its absence of subsequent metabolic regulation in urine certainly appear to reflect the functional state of organs and any renal metabolic or physiological disruptions better than plasma does.
In urine, the N1-methyl nicotinamide (NMN) level decreased, consistent with our previous results for male rats only (Grison et al. Citation2013; Grison et al. Citation2016). In addition, an increased level of N1-methyl-2-pyridone-5-carboxamide was observed (putatively confirmed). This result was affected, however, by the sexual dimorphism that, albeit low, appears to affect the consequence of NU exposure on kidney physiology. These data confirm the need to consider sex dimorphism as well as other constitutive factors such as age, health status, and ethnic origin in human health risk assessment. Nevertheless, metabolomic analysis of urine samples can be a convenient and sensitive method for risk assessment and diagnostic purposes that can detect metabolic dysregulation of the kidneys due to accidental low-dose uranium exposure.
Plasma is another relevant biological matrix due to its easy accessibility, and it can be used to discriminate between contaminated male and female rats. The metabolites identified cannot be directly associated with the renal effects observed. Nevertheless, docosatetraenoyl, ethanolamide, arachidonylethanolamide, and dihomo-gamma-linolenoylethanolamide are endocannabinoid molecules associated with the cannabinergic neurotransmitters and can directly influence brain functions and behavior (Vlachou and Panagis Citation2014).
Among all the discriminative metabolites identified in the three biological compartments (), the nicotinate-nicotinamide and unsaturated fatty acid pathways were identified in more than one matrix; they were found after analyses of both kidneys and urine. Other dysregulated pathways include those for the metabolism of linoleic acid, vitamin B6, riboflavin, sphingolipids, glycerophospholipids, glycine, serine, threonine, other fatty acid metabolisms, tryptophan, arginine, and proline, for the biosynthesis of fatty acids and steroids and finally for the elongation of fatty acids in mitochondria. Among these pathways, several have already been described as biomarkers of oxidative stress after exposure to copper (Taylor et al. Citation2009) and long-term exposure to heavy metals (Sarma et al. Citation2018). Moreover, fatty acids have been described as one of the most important biomarkers of chemical stressors such as heavy metals (Filimonova et al. Citation2016); they are associated with oxidative stress (Reglero et al. Citation2009) and closely linked to the inflammatory immune response (Cornet et al. Citation2018) ().
These pathways indicate the broad effect of uranium through inter-network relations between metabolic pathways and possible physiological consequences. Urine appears to be a more interesting biofluid than plasma for studies of the effects of low-dose uranium exposures. Both urine and the kidneys share affected pathways, with still other pathways differentially affected depending on the individual's sex. The involvement of different sex-dependent pathways might explain the differences in sensitivity in terms of health risk assessment.
These discriminative metabolic fluctuations raise the question of upstream genetic regulation involved in the biological response to NU. Analyses of transcript fluctuations (mRNAs and miRNAs) in kidney cells might provide information about the parent molecular events driving the metabolic outcomes. For contaminated kidneys of males, analysis of RNA expression identified a set of differentially expressed transcripts linked to cell signaling, cell structure, developmental processes, cell proliferation, transport, apoptosis, inflammation, and the metabolism of fatty acids, which NU can target, as previously observed in other studies of uranium as a cell stressor (Sano et al. Citation2000; Dublineau et al. Citation2007; Webb-Robertson et al. Citation2011).
Nonetheless, except for the fatty acid metabolisms, our results do not show any direct correlations of the results from transcriptomic to metabolomic results, e.g. for the nicotinate-nicotinamide metabolism, which was the pathway most strongly dysregulated in the kidney metabolome. Moreover, N-methylnicotinamide has previously been reported to be dysregulated in cases of experimentally-induced renal failure by a nephrotoxic agent such as uranium (Hirsch Citation1972; Shim et al. Citation1984). It has even been suggested for use as an endogenous probe to evaluate drug-drug interactions in the kidney (Ito et al. Citation2012). However, deeper research into the metabolic pathway for genes such as ALDH2 provided links to metabolic pathways such as those for glycerophospholipids, pyruvate, tyrosine, glycolysis, urea, histidine, leukotriene, and lysine. DGKQ is involved in glycerophospholipid metabolism, which our metabolomic analyses showed were affected. Atp6v1h is involved in purine metabolism, which is linked in turn to those of histidine and riboflavin (both detected in the metabolomic analysis).
The low range of transcript fluctuations measured after low-dose exposures is likely to explain the small number of discriminative transcripts, which in turn may explain the difficulty of establishing a direct correlation between gene expression and metabolite fluctuations. It is noteworthy that the number of features differentially expressed between contaminated and control groups decreased substantially after we corrected p values by the Benjamini-Hochberg False Discovery Rate method for p value correction. It might be useful to consider alternative methods for handling multiple testing corrections in the context of specific effects of low-dose exposure from small biological fluctuations, to be able to formulate new hypotheses about effects on downstream metabolites. Wang et al. (Wang et al. Citation2013) have described such a method. When we applied this method to our results, four genes involved in the nicotinate-nicotinamide pathway were found to be differentially expressed by the uranium exposure. This establishes a gene profile associated with uranium exposure in the kidneys and can be used to find new mechanistic pathways. Depending on the gene regulation process, mRNAs may be silenced by miRNAs through an epigenetic post-transcriptional mechanism (Filipowicz et al. Citation2008); these miRNAs might be used as biomarkers of exposure and even of toxicant injuries (Kanki et al. Citation2014).
In our study, Elastic Net selected 70 miRNAs differentially expressed in contaminated kidneys after NU exposure (). These miRNAs can be putatively linked to major metabolic pathways, including those for sphingolipids, nicotinate-nicotinamide, fatty acids biosynthesis, and cell processes, which were identified by our metabolomic and transcriptomic analyses. These multiscale results confirm the relevance of this method for understanding the biological response to low-dose uranium exposure and the dysregulation that occurred at several scales. The difficulty in establishing links between fluctuations of miRNAs, mRNAs, and metabolites is not surprising in view of the time-lag between gene expression and the fluctuations it can cause in metabolite concentrations. This lag can range from minutes to days, so that simultaneous measurements allow only partial observation of the cell molecular response at a given time (Takahashi et al. Citation2011). To improve the analysis, this approach needs to be completed by a time-related study. In addition, in this range of low-dose effects, non-pathological dysregulations are difficult to determine as they fall within or just above the homeostatic background level. The dose-time/effect relations are known to be non-linear and consequently unpredictable by extrapolation (Calabrese Citation2004; Tubiana et al. Citation2009; Lagarde et al. Citation2015). Depending on the confounding environmental factors, observable effects are often stochastic (Mothersill and Seymour Citation2009, Citation2014). Nonetheless, our results confirm a multiscale biological effect by chronic low-dose uranium exposure at the epigenetic and genetic levels, as well as at the metabolomic level, which represents the final read-out of cellular regulation processes.
In conclusion, these new generations of large-scale and untargeted methodological approaches appear suited to use in the field of low-dose exposures, for the formulation of mechanistic hypotheses and the identification of biological targets of exposure to be used as a new generation of biological markers. In this study, although no specific adverse effects of uranium were observed at this level of dose exposure, the results confirm that nicotinate-nicotinamide and fatty acids are the principal metabolisms affected in the kidneys and urine after chronic low-dose uranium exposure. Other results revealed cellular processes through the activation of genes that can be associated with oxidative stress and inflammatory immune response as well as with uranium-contaminated kidneys. Moreover, the multi-omics approach allowed us to observe sex differences in analytical profiles, which can be correlated with differences in biological sensitivity to uranium exposure. This parameter must be taken into account in risk assessments. Our results confirm that omic analysis is relevant for multiscale fingerprinting in the field of low-dose exposure, which can be used to assess the impact of the exposome. These analytical methods are an important asset for health monitoring policy for public health risk assessment. Finally, in the field of radiation protection, the complexity of assessing low-dose ionizing radiation exposures is a major issue that needs to be considered, in view of the need to consider time and dose, external versus internal exposure, acute versus chronic exposures, risk of delayed adverse effects, and even impact on future generations, sex, age, ethnic origin, and finally the synergic effects of combined radiological and chemical multiple exposures (Boobis et al. Citation2011). Therefore, further studies should work at overcoming these scientific challenges to improve health policy.
Notes on contibutors
Stéphane Grison, PhD, conducts research in the field of low dose ionizing radiation at the Experimental Radiotoxicology and Radiobiology Laboratory of IRSN.
Dimitri Kereselidze, research technician at the Experimental Radiotoxicology and Radiobiology Laboratory of IRSN.
David Cohen, PhD, Bioinformatician conducts research in the field of system biology at the Experimental Radiotoxicology and Radiobiology Laboratory of IRSN.
Céline Gloaguen, research technician at the Experimental Radiotoxicology and Radiobiology Laboratory of IRSN.
Christelle Elie, research technician at the Experimental Radiotoxicology and Radiobiology Laboratory of IRSN.
Philippe Lestaevel, PhD, conducts research in the field of low-dose exposure at the Experimental Radiotoxicology and Radiobiology Laboratory of IRSN.
Audrey Legendre, PhD, conducts research in the field of low-dose exposure at the Experimental Radiotoxicology and Radiobiology Laboratory of IRSN.
Line Manens, research technician at the Experimental Radiotoxicology and Radiobiology Laboratory of IRSN.
Baninia Habchi, PhD, conducts research in the field of metabolomics at Aix Marseille University.
Mohamed Amine Benadjaoud, PhD, Biomathematician / Biostatistician at IRSN.
Georges Tarlet research technician at the Radiobiology of Medical Exposure Laboratory of IRSN.
Fabien Milliat, PhD, conducts research in the field of ionizing radiation exposure at the Radiobiology of Medical Exposure Laboratory of IRSN.
Jean-Charles Martin, PhD, conducts research in the field of metabolomics, lipidomics and systems biology at Aix Marseille University.
Jean-Marc Lobaccaro, PhD, Professor of molecular physiology at Clermont Auvergne University.
Maâmar Souidi, PhD, conducts research in the field of low dose ionizing radiation at the Experimental Radiotoxicology and Radiobiology Laboratory of IRSN.
Acknowledgements
The authors thank Frédéric Voyer and Thierry Loiseau for animal care.
Disclosure statement
No potential conflict of interest was reported by the authors.
Additional information
Funding
References
- Besic L, Muhovic I, Asic A, Kurtovic-Kozaric A. 2017. Meta-analysis of depleted uranium levels in the Balkan region. J Environ Radioact. 172:207–217.
- Bigalke M, Schwab L, Rehmus A, Tondo P, Flisch M. 2018. Uranium in agricultural soils and drinking water wells on the Swiss Plateau. Environ Pollut. 233:943–951.
- Boobis A, Budinsky R, Collie S, Crofton K, Embry M, Felter S, Hertzberg R, Kopp D, Mihlan G, Mumtaz M. 2011. Critical analysis of literature on low-dose synergy for use in screening chemical mixtures for risk assessment. Crit Rev Toxicol. 41(5):369–383.
- Calabrese EJ. 2004. Hormesis: a revolution in toxicology, risk assessment and medicine. EMBO Rep. 5(Supp 1):S37–S40.
- Campion S, Catlin N, Heger N, McDonnell EV, Pacheco SE, Saffarini C, Sandrof MA, Boekelheide K. 2012. Male reprotoxicity and endocrine disruption. Exp Suppl. 101:315–360.
- Chou CH, Shrestha S, Yang CD, Chang NW, Lin YL, Liao KW, Huang WC, Sun TH, Tu SJ, Lee WH, et al. 2018. miRTarBase update 2018: a resource for experimentally validated microRNA-target interactions. Nucleic Acids Res. 46:D296–D302.
- Cornet V, Ouaach A, Mandiki SNM, Flamion E, Ferain A, Van Larebeke M, Lemaire B, Reyes Lopez FE, Tort L, Larondelle Y, et al. 2018. Environmentally-realistic concentration of cadmium combined with polyunsaturated fatty acids enriched diets modulated non-specific immunity in rainbow trout. Aquat Toxicol. 196:104–116.
- Draper J, Enot DP, Parker D, Beckmann M, Snowdon S, Lin W, Zubair H. 2009. Metabolite signal identification in accurate mass metabolomics data with MZedDB, an interactive m/z annotation tool utilising predicted ionisation behaviour 'rules'. BMC Bioinformatics. 10:227.
- Dublineau I, Grandcolas L, Grison S, Baudelin C, Paquet F, Voisin P, Aigueperse J, Gourmelon P. 2007. Modifications of inflammatory pathways in rat intestine following chronic ingestion of depleted uranium. Toxicol Sci. 98:458–468.
- Dublineau I, Souidi M, Gueguen Y, Lestaevel P, Bertho JM, Manens L, Delissen O, Grison S, Paulard A, Monin A, et al. 2014. Unexpected lack of deleterious effects of uranium on physiological systems following a chronic oral intake in adult rat. BioMed Res Int. 2014:1.
- Dunn WB, Broadhurst D, Begley P, Zelena E, Francis-McIntyre S, Anderson N, Brown M, Knowles JD, Halsall A, Haselden JN, et al. 2011. Procedures for large-scale metabolic profiling of serum and plasma using gas chromatography and liquid chromatography coupled to mass spectrometry. Nat Protoc. 6:1060–1083.
- European-Commission. 2009. Report of high level and expert group on European low dose risk research. Luxembourg: European-Commission.
- Faa A, Gerosa C, Fanni D, Floris G, Eyken PV, Lachowicz JI, Nurchi VM. 2018. Depleted Uranium and Human Health. Cmc. 25:49–64.
- Fiehn O. 2002. Metabolomics–the link between genotypes and phenotypes. Plant Mol Biol. 48:155–171.
- Filimonova V, Gonçalves F, Marques JC, De Troch M, Gonçalves AMM. 2016. Fatty acid profiling as bioindicator of chemical stress in marine organisms: a review. Ecol Indic. 67:657–672.
- Filipowicz W, Bhattacharyya SN, Sonenberg N. 2008. Mechanisms of post-transcriptional regulation by microRNAs: are the answers in sight? Nat Rev Genet. 9:102–114.
- Friedman J, Hastie T, Tibshirani R. 2010. Regularization paths for generalized linear models via coordinate descent. J Stat Softw. 33:1–22.
- Gao J, Tarcea VG, Karnovsky A, Mirel BR, Weymouth TE, Beecher CW, Cavalcoli JD, Athey BD, Omenn GS, Burant CF, et al. 2010. Metscape: a Cytoscape plug-in for visualizing and interpreting metabolomic data in the context of human metabolic networks. Bioinformatics. 26:971–973.
- Gochfeld M. 2017. Sex differences in human and animal toxicology research support. Toxicol Pathol. 45:172–189.
- Griffin JL, Walker LA, Shore RF, Nicholson JK. 2001. Metabolic profiling of chronic cadmium exposure in the rat. Chem Res Toxicol. 14:1428–1434.
- Grison S, Fave G, Maillot M, Manens L, Delissen O, Blanchardon E, Banzet N, Defoort C, Bott R, Dublineau I, et al. 2013. Metabolomics identifies a biological response to chronic low-dose natural uranium contamination in urine samples. Metabolomics. 9:1168–1180.
- Grison S, Fave G, Maillot M, Manens L, Delissen O, Blanchardon E, Dublineau I, Aigueperse J, Bohand S, Martin JC, et al. 2016. Metabolomics reveals dose effects of low-dose chronic exposure to uranium in rats: identification of candidate biomarkers in urine samples. Metabolomics. 12:154.
- Hirsch GH. 1972. Stimulation of renal organic base transport by uranyl nitrate. Can J Physiol Pharmacol. 50:533–538.
- Hsu SD, Lin FM, Wu WY, Liang C, Huang WC, Chan WL, Tsai WT, Chen GZ, Lee CJ, Chiu CM, et al. 2011. miRTarBase: a database curates experimentally validated microRNA-target interactions. Nucleic Acids Res. 39:D163–D169.
- Hu QH, Weng JQ, Wang JS. 2010. Sources of anthropogenic radionuclides in the environment: a review. J Environ Radioact. 101:426–437.
- Hubert P. 2010. Effects of low doses: Proof and inferences. Environ Risque Santé. 9:295–302.
- Ito S, Kusuhara H, Kumagai Y, Moriyama Y, Inoue K, Kondo T, Nakayama H, Horita S, Tanabe K, Yuasa H, et al. 2012. N-methylnicotinamide is an endogenous probe for evaluation of drug-drug interactions involving multidrug and toxin extrusions (MATE1 and MATE2-K). Clin Pharmacol Ther. 92:635–641.
- Jakhu R, Mehra R, Mittal HM. 2016. Exposure assessment of natural uranium from drinking water. Environ Sci-Proc Imp. 18:1540–1549.
- Kanki M, Moriguchi A, Sasaki D, Mitori H, Yamada A, Unami A, Miyamae Y. 2014. Identification of urinary miRNA biomarkers for detecting cisplatin-induced proximal tubular injury in rats. Toxicology. 324:158–168.
- Lagarde F, Beausoleil C, Belcher SM, Belzunces LP, Emond C, Guerbet M, Rousselle C. 2015. Non-monotonic dose-response relationships and endocrine disruptors: a qualitative method of assessment. Environ health. 14:13.
- Leggett RW. 1989. The behavior and chemical toxicity of U in the kidney: a reassessment. Health Phys. 57:365–383.
- MacKenzie AB. 2000. Environmental radioactivity: experience from the 20th century–trends and issues for the 21st century. Sci Total Environ. 249:313–329.
- Mnif W, Hassine AI, Bouaziz A, Bartegi A, Thomas O, Roig B. 2011. Effect of endocrine disruptor pesticides: a review. Ijerph. 8:2265–2303.
- Morgan WF, Bair WJ. 2013. Issues in low dose radiation biology: the controversy continues. A perspective. Radiat Res. 179:501–510.
- Mothersill C, Seymour C. 2009. Implications for environmental health of multiple stressors [Research Support, Non-U.S. Gov't Review]. J Radiol Prot. 29:A21–A28.
- Mothersill C, Seymour C. 2014. Implications for human and environmental health of low doses of ionising radiation. J Environ Radioact. 133:5–9.
- Oliver SG, Winson MK, Kell DB, Baganz F. 1998. Systematic functional analysis of the yeast genome [Research Support, Non-U.S. Gov't Review]. Trends Biotechnol. 16:373–378.
- Paquet F, Houpert P, Blanchardon E, Delissen O, Maubert C, Dhieux B, Moreels AM, Frelon S, Gourmelon P. 2006. Accumulation and distribution of uranium in rats after chronic exposure by ingestion. Health Phys. 90:139–147.
- Pereira H, Martin J-F, Joly C, Sébédio J-L, Pujos-Guillot E. 2010. Development and validation of a UPLC/MS method for a nutritional metabolomic study of human plasma. Metabolomics. 6:207–218.
- Pereira R, Barbosa S, Carvalho FP. 2014. Uranium mining in Portugal: a review of the environmental legacies of the largest mines and environmental and human health impacts. Environ Geochem Health. 36:285–301.
- Poisson C, Stefani J, Manens L, Delissen O, Suhard D, Tessier C, Dublineau I, Gueguen Y. 2014. Chronic uranium exposure dose-dependently induces glutathione in rats without any nephrotoxicity. Free Radical Res. 48:1218–1231.
- Poore KR, Hanson MA, Faustman EM, Neira M. 2017. Avoidable early life environmental exposures. Lancet Planet Health. 1:e172–e173.
- Preston RJ. 2004. Children as a sensitive subpopulation for the risk assessment process. Toxicol Appl Pharmacol. 199:132–141.
- Reglero MM, Taggart MA, Monsalve-Gonzalez L, Mateo R. 2009. Heavy metal exposure in large game from a lead mining area: effects on oxidative stress and fatty acid composition in liver. Environ Pollut. 157:1388–1395.
- Ritchie ME, Phipson B, Wu D, Hu Y, Law CW, Shi W, Smyth GK. 2015. Limma powers differential expression analyses for RNA-sequencing and microarray studies. Nucleic Acids Res. 43:e47.
- Sano K, Fujigaki Y, Miyaji T, Ikegaya N, Ohishi K, Yonemura K, Hishida A. 2000. Role of apoptosis in uranyl acetate-induced acute renal failure and acquired resistance to uranyl acetate. Kidney Int. 57:1560–1570.
- Sarma SN, Saleem A, Lee JY, Tokumoto M, Hwang GW, Man Chan H, Satoh M. 2018. Effects of long-term cadmium exposure on urinary metabolite profiles in mice. J Toxicol Sci. 43:89–100. eng.
- Schmitt P, Mandel J, Guedj M. 2015. A comparison of six methods for missing data imputation. J Biom Biostat. (6):224
- Schug TT, Janesick A, Blumberg B, Heindel JJ. 2011. Endocrine disrupting chemicals and disease susceptibility. J Steroid Biochem Mol Biol. 127:204–215.
- Shannon P, Markiel A, Ozier O, Baliga NS, Wang JT, Ramage D, Amin N, Schwikowski B, Ideker T. 2003. Cytoscape: a software environment for integrated models of biomolecular interaction networks. Gen Res. 13:2498–2504.
- Shim CK, Sawada Y, Iga T, Hanano M. 1984. Estimation of renal secretory function for organic cations by endogenous N1-methylnicotinamide in rats with experimental renal failure. J Pharmacokinet Biopharm. 12:23–42.
- Skinner MK, Manikkam M, Tracey R, Guerrero-Bosagna C, Haque M, Nilsson EE. 2013. Ancestral dichlorodiphenyltrichloroethane (DDT) exposure promotes epigenetic transgenerational inheritance of obesity. BMC Med. 11:228.
- Takahashi H, Morioka R, Ito R, Oshima T, Altaf-Ul-Amin M, Ogasawara N, Kanaya S. 2011. Dynamics of time-lagged gene-to-metabolite networks of Escherichia coli elucidated by integrative omics approach. Omics. 15:15–23.
- Taylor NS, Weber RJM, Southam AD, Payne TG, Hrydziuszko O, Arvanitis TN, Viant MR. 2009. A new approach to toxicity testing in Daphnia magna: application of high throughput FT-ICR mass spectrometry metabolomics. Metabolomics. 5:44–58.
- Tubiana M, Feinendegen LE, Yang C, Kaminski JM. 2009. The linear no-threshold relationship is inconsistent with radiation biologic and experimental data. Radiology. 251:13–22.
- Vandenberg L. 2012. Low-dose effects of endocrine disruptors, with Laura Vandenberg. Interview by Ashley Ahearn. Environ Health Perspect. 120:1 p preceding A228.
- Vlachou S, Panagis G. 2014. Regulation of brain reward by the endocannabinoid system: a critical review of behavioral studies in animals. Cpd. 20:2072–2088.
- Wang B, Shi Z, Weber GF, Kennedy MA. 2013. Introduction of a new critical p value correction method for statistical significance analysis of metabonomics data. Anal Bioanal Chem. 405:8419–8429.
- Wappelhorst O, Kuhn I, Heidenreich H, Markert B. 2002. Transfer of selected elements from food into human milk. Nutrition. 18:316–322.
- Webb-Robertson BJ, Bunn AL, Bailey VL. 2011. Phospholipid fatty acid biomarkers in a freshwater periphyton community exposed to uranium: discovery by non-linear statistical learning. J Environ Radioact. 102:64–71.
- WHO. 2016. An estimated 12.6 million deaths each year are attributable to unhealthy environments. Health and environment News: 82:2–6. http://www.who.int/phe/news/e-News-82.pdf.
- Xia J, Wishart DS. 2016. Using metaboanalyst 3.0 for comprehensive metabolomics data analysis. Curr protoc bioinformatics. 55:14.10.11–14.10.91.
- Zhivin S, Laurier D, Guseva Can, u I. 2014. Health effects of occupational exposure to uranium: do physicochemical properties matter? Int J Radiat Biol. 90:1104–1113.