
Abstract
Purpose
In case of population exposure by ionizing radiation, a fast and reliable dose assessment of exposed and non-exposed individuals is crucial important. In initial triage, physicians have to take fast decisions whom to treat with adequate medical care. In addition, worries about significant exposure can be taken away from hundreds to thousands non- or low exposed individuals. Studies have shown that the γH2A.X radiation-induced foci assay is a promising test for fast triage decisions. However, in a large-scale scenario most biodosimetry laboratories will quickly reach their capacity limit. The aim of this study was to evaluate the benefit of inexperienced experimenters to speed up the foci assay and manual foci scoring.
Materials and methods
The participants of two training courses performed the radiation-induced foci assay (γH2A.X) under the guidance of experts and scored foci (γH2A.X and 53BP1) on sham-irradiated and irradiated blood samples (0.05–1.5 Gy). The outcome of laboratory experiments and manual foci scoring by 26 operators with basic experience in laboratory work was statistically analyzed in comparison to the results from experts.
Results
Inexperienced operators prepared slides with significant dose-effects (0, 0.1 and 1.0 Gy) for semi-automatic microscopic analyses. Manual foci scoring by inexperienced scorer resulted in a dose–effect curve for γH2A.X, 53BP1 and co-localized foci. In addition, inexperienced scorers were able to distinguish low irradiation doses from unirradiated cells. While 53BP1 foci scoring was in accordance to the expert counting, differences between beginners and expert increased for γH2A.X or co-localized foci.
Conclusions
In case of a large-scale radiation event, inexperienced staff is useful to support laboratories in slide preparation for semi-automatic foci counting as well as γH2A.X and 53BP1 manual foci scoring for triage-mode biodosimetry. Slides can be clearly classified in the non-, low- or high-exposed category.
Introduction
In case of a mass casualty incident such as accidental exposure by major malfunction of a nuclear power plant or a terroristic attack a large number of individuals will be exposed toward ionizing radiation. In addition, there will be a significant number of ‘worried well’ people who show similar symptoms as exposed people, without actually being exposed (Moquet et al. Citation2017). The absence of physical measurements of received doses is one common property of accidental exposure to ionizing radiation. Precise retrospective dose estimation is necessary to predict the biological consequences or long-term effects based on the analysis of chromosomal damage by the dicentric test or the micronucleus test for recent exposure and three-color FISH analyses for exposure from years ago (Swartz et al. Citation2014; Wojcik et al. Citation2017). In addition, early triage is essential to categorize affected people for immediate clinical treatment (Swartz et al. Citation2014) and the usage of gene expression (Paul and Amundson Citation2008; Lacombe et al. Citation2018), proteomics (Marchetti et al. Citation2006) or γH2A.X as fast, initial and high-throughput biodosimetric assays has been discussed since several years (Horn and Rothkamm Citation2011; Rothkamm, Barnard, et al. Citation2013).
Immunostaining of γH2A.X is one of the most commonly used assays in radiation biology studies and is applicable in a broad range of research fields (reviewed in Redon et al. Citation2011). Directly after exposure to ionizing radiation, H2A.X is phosphorylated on Serine 139 (γH2A.X) in an ATM- or DNA-PK-dependent way (Rogakou et al. Citation1998; Stiff et al. Citation2004; Savic et al. Citation2009). It accumulates near DNA double strand breaks (DSB) and forms so called radiation-induced foci (RIF) (Rogakou et al. Citation1999). Typically, γH2A.X foci number reaches a maximum between 30 and 60 min after exposure and starts to decrease afterwards (Rogakou et al. Citation1999). 53BP1 shows a similar strong response to ionizing radiation with formation of foci and a peak between 30 and 60 min after irradiation before the number of foci decreases (Schultz et al. Citation2000). 53BP1 is a mediator for DSB repair through recruitment of effector- and repair proteins to DNA damage sites (reviewed in Panier and Boulton Citation2014). The dose dependent formation of RIF of γH2A.X and 53BP1 in respect to foci numbers and intensity enables the quantification of signals. Therefore, both are commonly used biomarkers for evaluation of DSBs in radiation biology and are potentially suitable as a biodosimetric assay in accidental exposure (Jakl et al. Citation2020).
To obtain retrospective biological dose estimates in case of a large-scale scenario, a large number of samples have to be processed and evaluated. Most laboratories will quickly reach their capacity limit in these cases. Therefore, effective, initial triage (Swartz et al. Citation2014), automation of laboratory processes (Garty et al. Citation2010, Citation2011), semi- or fully automatic scoring (Romm et al. Citation2013; Garty et al. Citation2015) and cooperation of laboratories in international networks (Kulka et al. Citation2012, Citation2017) can reduce time investment and enable the handling of a huge number of cases (Swartz et al. Citation2014). However, if the worst comes to the worst, situations may arise when neither automation nor networking is available (Gałecki et al. Citation2019). The usage of inexperienced staff, which is not familiar with the assays or scoring conditions, could be necessary. Gałecki et al. (Citation2019) showed, that chromosomal aberrations and micronuclei test were identified as possible methods to assess a dose–response by inexperienced scorers (Gałecki et al. Citation2019). However, evaluation of chromosomal aberrations is more complicated than scoring of radiation-induced foci (Roch-Lefevre et al. Citation2010).
Therefore, the aim of this study was to evaluate the usefulness of the estimation of foci numbers from inexperienced experimenters based on I) preparation of γH2A.X immune-stained slides for semi-automatic foci scoring under guidance and II) manual scoring of RIF (γH2A.X and 53BP1) in pictures of scanned slides after a basic introduction. The prepared slides and scoring results were compared to data from well-experienced operators and fitted in dose–effect curves. The two-week European training course in radiation research ‘InterRad’ (Interdisciplinary Radiation Research) offered the chance to address this question (Ottolenghi et al. Citation2019) https://www.concert-h2020.eu/en/Events/CSC_2020_Interrad. During the first course 10 participants were given the basics of the assay in introductory lectures and asked to perform slide preparation and immunostaining under guidance of an expert. Additionally, in the second course coded pictures of scanned microscopic slides were scored for γH2A.X, 53BP1 and co-localization of both proteins by 16 participants after a short introduction.
Materials and methods
Course participants
In total, 26 international and national attendees participated in the two ‘InterRad’ courses (April 2018 and January 2020) at the Federal Office for Radiation Protection Germany (BfS). The participants were guided and supported by three experts from BfS, which had extensive experience in the γH2A.X assay and regularly performed this assay one to two times a week.
Blood sampling
Peripheral blood samples from healthy adult donors were obtained by venipuncture from physicians at BfS according to the principles of the Declaration of Helsinki and section 15 of the code of medical ethics for physicians in Bavaria, Germany. A signed informed consent was obtained from the donors and all donors were informed about the risks of venipuncture. The blood was collected into heparinized tubes. The blood samples and questionnaires were fully anonymized and as such not traceable to the individual participants.
Irradiation of whole blood
For slide preparation by inexperienced operators, whole blood was homogenously irradiated in vitro at two different doses (0.1 and 1 Gy) and sham-irradiation in 15 mL conical tubes (Eppendorf AG, Hamburg, Germany). Irradiation was performed using a 137 Cs-source HWM-D-2000 (Wälischmiller Engineering GmbH, Markdorf, Germany) at a dose rate of 0.44 Gy per minute at room temperature (RT). The calibration of the HWM-D-2000 was done by alanine dosimetry, traceable to the National Physical Laboratory UK (NPL). For manual scoring by inexperienced scorers, 3 mL of whole blood were homogenously irradiated in vitro at 8 different doses (0, 0.05, 0.1, 0.25, 0.5, 0.75, 1, 1.5 Gy) in 15 mL conical tubes. Sham-irradiated controls were also included. Samples were irradiated with a X-ray high-protection device RS225 (X-Strahl Limited, Camberley, UK) under the following conditions: 195 kV, 10 mA, 0.5 mm Cu filter, sample distance from X-ray tube 500 FSD, dose rate of 0.59 Gy per minute at RT. The calibration of the X-ray cabinet was established by a PTW unidos E System electrometer associated to a PTW 30010 ionization chamber, traceable to NPL. For irradiation, all tubes were placed in the center in a horizontal position.
Isolation of PBMC
To evaluate radiation-induced damage following IR, whole blood was incubated at 37 °C after irradiation for 1 h to allow maximum signaling of DNA double-strand breaks. Blood tubes were transferred to 4 °C for 10 min to stop repair processes. Peripheral blood mononuclear cells (PBMC) were isolated using density gradient centrifugation (1000 g for 10 min) of whole blood layered on Biocoll separation solution (1077 g/mL) (Biochrom GmbH, Berlin, Germany) in a leucosep tube with a separation filter (Greiner Bio-One, Kremsmünster, Germany) at room temperature. After centrifugation, the supernatant was transferred into conical tubes, washed with phosphate buffered saline (PBS) (137 mM NaCl, 2.7 mM KCl, 8 mM Na2HPO4, 2 mM KH2PO4, pH 7,4) and centrifuged for 10 min at 250 g. The pellet was resolved in PBS, leukocytes were counted with Türk’s solution (Merck KgaA, Darmstadt, Germany) in a counting chamber each. Cells were adjusted to a concentration of 1 × 10⁶ cells per mL. Following isolation cells were stored at 4 °C for 10 min prior to fixation.
Immunostaining of γH2A.X and 53BP1
For slide preparation by inexperienced ‘students’, cells were fixed with 2% paraformaldehyde (PFA) (Sigma Aldrich Chemie GmbH, Taufkirchen, Germany)/PBS solution for 15 min at RT and spotted onto glass slides by cytospin centrifugation (5 min, 54×g, RT) (Rotofix 32 A, Andreas Hettich GmbH & Co.KG, Tuttlingen, Germany). For manual scoring by inexperienced scorers, cells were first spotted onto glass slides and then fixed. After fixation, slides were rinsed shortly in PBS.
For staining, cells were permeabilized with 0.015% Triton X-100 (Sigma Aldrich Chemie GmbH, Taufkirchen, Germany)/PBS 3 times for 5 min. Afterwards unspecific binding sites were blocked 3 times for 10 min with blocking solution (1%BSA (Sigma Aldrich Chemie GmbH, Taufkirchen, Germany)/0.15% glycine (Sigma Aldrich Chemie GmbH, Taufkirchen, Germany)/PBS). Primary antibodies were diluted in blocking solution: anti-phospho-histone H2A.X (Ser139) rabbit mAb (Cell Signaling Technology Europe B.V., Frankfurt on the Main, Germany, #9718) 1:200 or with anti-phospho-histone H2A.X (Ser139) mouse mAb (Merck KgaA, Darmstadt, Germany, #05-636) 1:100 and anti 53BP1 rabbit pAB (Novus Biologicals, Littleton, CO, USA, #NB100-305) 1:500. Slides were covered with 75 µL primary antibody solution, and a coverslip and incubated overnight at 4 °C. After antibody incubation, slides were washed 5 min with PBS, 10 min with 0.015% Triton X-100/PBS, 5 min with PBS and 7 min with blocking solution. The slides were incubated as described before with 75 µL diluted secondary antibody in blocking solution for 45 min at RT: anti-mouse IgG (H + L), F(ab’)2 fragment conjugated to Alexa Fluor 488 fluorescent dye and anti-rabbit IgG (H + L), F(ab’)2 fragment conjugated to Alexa Fluor 555 fluorescent dye (Cell Signaling Technology Europe B.V., Frankfurt on the Main, Germany, #4408 and #4413) each 1:1000. After antibody binding, slides were washed 2 × 5 min with 0.015% Triton X-100/PBS and 2 × 10 min in PBS. The cell nuclei were counterstained and slides were mounted with 16 µl Vectashield mounting medium including 4′-6-diamidino-2-phenylindole (DAPI) (Vector Laboratories Inc., Burlingame, CA, USA).
Semi-automatic and manual quantification of foci
Immunofluorescence analysis and image acquisition was performed by automatic microscopy using a Metafer Scanning System (MetaSystems Hard & Software GmbH, Altlussheim, Germany) equipped with epifluorescence microscope Zeiss AxioImager.Z2 (objectives: ECPlnN 40x/0.75 M27 and filters: DAPI, FITC/Spectrum Green and TRITC/Spectrum Orange)(Carl Zeiss AG, Oberkochen, Germany), with CCD CoolCube Camera 1 m (MetaSystems Hard & Software GmbH, Altlussheim, Germany) and light source XCite Exacte (Excelitas Technologies Corp., Waltham, MA, USA) and Metafer4 software (MetaSystems Hard & Software GmbH, Altlussheim, Germany). The number of radiation-induced single γH2A.X foci or γH2A.X in combination with 53BP1 foci in double staining was semi-automatically quantified in a maximum of 2000 cells, using Metafer4 software and a custom-made evaluation algorithm (classifier). For single γH2A.X foci analyses, z-stack images with ten focus planes and a plane distance of 0.35 µm were taken. The integration time was fixed and set to 0.12 s and the threshold for foci intensity was set to 40% with a maximum gain of 500%. For analyses of γH2A.X and 53BP1 foci in double staining, z-stack images with ten focus planes and a plane distance of 0.35 µm were taken. The integration time was fixed and set to 0.12 s for γH2A.X and 0.16 s for 53BP1 and the threshold for foci intensity was set to 30% with a maximum gain of 500% for γH2A.X and 40% with a maximum gain of 500% for 53BP1. Only round cell nuclei with an area of 20–200 µm2 were semi-automatically analyzed.
For manual scoring, prepared slides were semi-automatically scanned and the number of γH2A.X, 53BP1 and co-localized foci were quantified in 100 cells per slide on recorded pictures, using Metafer4 software.
Data processing and statistical analysis
Prior to statistical analysis, slides were evaluated by cell number, autofocus and staining. Slides with fewer than 500 cells, blurred structures, out of focus areas or abnormalities in staining procedure were excluded from analysis. For analysis of prepared and stained γH2A.X slides by inexperienced operators, the mean number of foci for each slide (69 slides) with a range of 500–2000 cells per slide was calculated. For comparisons where at least three replicate slides per group were available, two-sample Welch t-tests were applied to compare the mean number of foci between groups, assuming that the means are approximatively normally distributed and groups have unequal variances. Furthermore, the mean of all slides prepared by experts and beginners was determined with the 95% confidence interval. For evaluation of manual foci counting by inexperienced scorers, cells were semi-automatically evaluated in a first step. The mean number of γH2A.X and 53BP1 foci was calculated for each slide. Afterwards, the mean of at least three replicated slides of each dose point was determined and a spline regression was fitted with 3 degrees of freedom and 95% confidence interval. In a second step, the mean number of foci in at least 100 manually counted cells was calculated for each participant. A spline regression was fitted with 3 degrees of freedom for beginners and experts. To avoid assumptions on the distribution of the foci counts, the distinction between expert and beginners based on counts from the same slide was tested with Wilcoxon rank sum test using each cell as one single observation. The difference in mean number of foci between beginner and expert counting was calculated.
Results
Course participants
First, professional and personal information of course participants were recorded to assess practical experience. The 26 attendees (15 female, 11 male) of both ‘InterRad’ training courses came from 14 countries. Most of the participants were professionally educated in biology or life sciences (16), but also other disciplines such as physics or engineering (4), statistics (3), chemistry (1), environmental science (1) or medicine (1) were represented. More than half of them were PhD students (15), 2 were Master students and 9 were scientists from governmental agencies or universities (3 PhD, 6 M.Sc. or B.Sc.).
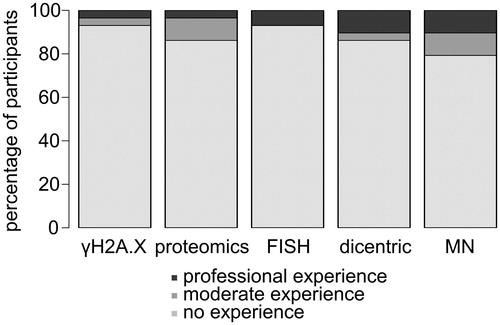
In a short questionnaire the participants were asked for practical knowledge in different methods in the field of radiation biology: γH2A.X assay, proteomics, FISH/mFISH, dicentric test and micronucleus test (MN). The absolute majority of participants (21 of 26 attendees) had no practical experience in any of these methods or performed these assays just 1 or 2 times before. While at least 5 or 4 participants had moderate or professional experience in the micronucleus or dicentric test, respectively, just 1 attendee had moderate and 1 professional skills in the γH2A.X assay (). However, the majority of the participants had basic experience in laboratory work. On the whole, mainly junior scientists who were quite new to the field of radiation research and had no or moderate experience in radiation biology assays participated in the two-week training courses. This offered the opportunity to evaluate the usefulness of the estimation of foci numbers from inexperienced experimenters.
Figure 1. Majority of 26 ‘InterRad’ course participants had no practical experience in radiation biology assays: γH2A.X assay, proteomics, FISH/mFISH, dicentric test and micronucleus test (MN).
Slide preparation and γH2A.X staining by inexperienced operators
In a first experimental setting the ability of 10 inexperienced operators for slide preparation and γH2A.X staining was evaluated. The participants were asked to spot the irradiated (0, 0.1 and 1 Gy) and fixed cells on slides and to stain phosphorylated H2A.X as a marker for DSB by immunostaining (see examples in ). None of the participants had any experience and they were guided through the assay by 2 skilled experts.
Figure 2. Beginners and experts produced comparable γH2A.X slides for semi-automatic foci scoring. Sham- and with 0.1 and 1 Gy irradiated cells were fixed 1 h after irradiation and stained for γH2A.X by 2 experts and 10 beginners. (A) Microscopy pictures as an example of immunofluorescence staining of γH2A.X in PBMCs (foci in red and cell nuclei in blue) at different doses. Scale bar 5 µm. (B) Mean numbers of γH2A.X foci for replicated slides and each participant were evaluated by semi-automatic microscopy for 0 (grey rhombus), 0.1 (white circle) and 1 Gy (black triangle). The mean of slides from experts (µe) and beginners (µb) was calculated with 95% confidence interval. The mean number and variation of foci/cell within one slide was calculated and listed in Supplementary Table S1.
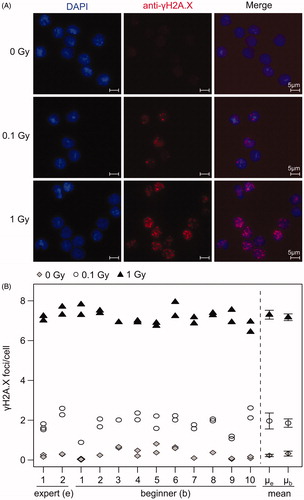
A mean number of 1952 cells were scored for γH2A.X foci per slide by semi-automatic microscopy. Slides prepared by experts showed slightly higher mean foci numbers than slides prepared by beginners ( and Supplementary Table S1), for 0.1 Gy (1.96 vs 1.86 foci/cell) and 1 Gy (7.3 vs 7.17 foci/cell), respectively. However, the mean number of foci stained by beginners was within the 95% confidence interval of the experts, and vice versa, indicating that the difference was not significant at the 5% level. Slides from unirradiated blood prepared by beginners showed a higher background and had the tendency for a higher number of foci per cell (0.33 foci/cell) in comparison to slides from experts (0.23 foci/cell). The 95% confidence intervals of the mean number of foci/cell did not overlap for any of the doses for experts as well as for beginners, indicating that all doses could be significantly distinguished at the 5% significance level. Foci counts of different dose points (0, 0.1, 1 Gy) could be distinguished from one another with a fold change > 3 for all the participants (). All participants prepared two replicate slides of the same sample, and the resulting counts indicated a high intra-participant reproducibility ().
Nevertheless, there were differences in quality. Prepared slides by inexperienced operators showed decreased numbers of spotted cells and cell clotting probably caused by reduced mixing of cell suspension prior cytospin centrifugation (data not shown). In addition, mechanical damage which can occur during preparation processes, like scratches or holes in the cell layer and air bubbles, were found. Overall, inexperienced operators produced evaluable and comparable slides with significant dose-effects for semi-automatic foci scoring and under guidance of experts.
Manual scoring of yH2A.X and 53BP1 foci by inexperienced scorers
The second main objective of this study was the evaluation of the usefulness of data from manual scoring of γH2A.X foci, 53BP1 foci and co-localized foci produced by inexperienced scorers. Each of 16 course attendees was asked to score γH2A.X foci and 53BP1 foci from two slides of a dose–effect curve (0, 0.05, 0.1, 0.25, 0.5, 0.75, 1 and 1.5 Gy) and 100 cells per slide on scanned pictures. Overall, one slide per dose point was scored in a masked and randomized way by 4 inexperienced scorers and once by an expert.
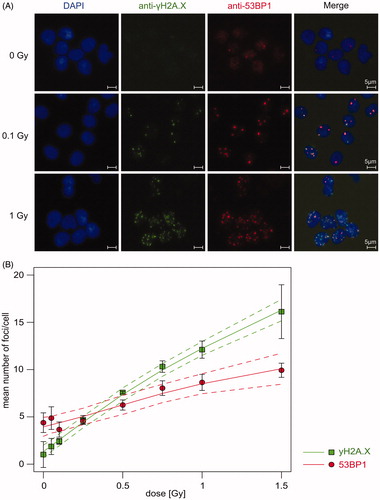
To check quality and dose–effect relationships of prepared slides prior to manual scoring, numbers of γH2A.X and 53BP1 foci were first analyzed by semi-automatic evaluation in at least three technical replicates per dose point in a mean number of 1506 cells per slide (see examples in ). A clear dose response with a slight saturation at higher doses was observed for γH2A.X (). Significant differences between 0 Gy and all dose points ≥0.1 Gy was observed for γH2A.X (p < .05). For 53BP1, diffuse background signal and sporadic foci were detected even in unirradiated cells (4.39 foci/cell) (). After irradiation, intensity of the background signal decreased rapidly and intense radiation-induced foci were formed. The number of 53BP1 foci was significantly lower for 0.1 Gy (3.66 foci/cell) in comparison to 0.05 Gy (4.87 foci/cell, p = .027). By contrast, the number of foci from irradiation doses ≥0.5 Gy (6.26 foci/cell) was higher and significantly distinguishable from unirradiated cells (p < .01). The mean number of foci increased with rising dose >0.1 Gy. Basal foci level of 53BP1 were significantly higher in comparison to γH2A.X (p = .001).
Figure 3. Semi-automatic foci quantification of γH2A.X and 53BP1 showed a clear dose–effect relationship. Sham- and irradiated PBMCs were fixed 1 h after irradiation and stained for γH2A.X and 53BP1 by experts. (A) Microscopy pictures as an example of immunofluorescence staining of γH2A.X (foci in green) and 53BP1 (foci in red) in PBMCs (cell nuclei in blue) at different doses. Scale bar 5 µm. (B) Mean number of γH2A.X (green) and 53BP1 (red) foci of three technical replicates were analyzed by semi-automatic microscopy. Mean (squares) with 95% confidence interval of all replicates were calculated with spline regression (solid line) and 95% confidence band (dashed line).
In comparison to semi-automatic γH2A.X foci evaluation, a similar dose–effect curve was seen for manual scoring, but basal foci levels were decreased (1.02 vs 0.19 foci/cell, and Supplementary Table S2). Both expert and beginners scored increasing foci numbers with increasing dose. Compared to 0 Gy, irradiated cells showed at least a threefold increase at all irradiation doses ≥0.05 Gy for expert scoring and at all doses ≥0.1 Gy for beginners scoring (all pairwise comparisons of slides). Unirradiated cells were evaluated similar by expert (0.19 foci/cell) and beginners (in mean 0.26 foci/cell) and only one inexperienced scorer counted significantly more foci in comparison to the expert (p < .01). After irradiation with 0.05 Gy, only one beginner scored a significant higher number of foci (p < .001) in comparison to expert counting. In both cases, these scorers had moderate or professional experience according to their statement on the questionnaires. For doses ≥0.1 Gy the number of foci per cell scored by the expert was significantly higher (p < .001) than the numbers scored by any of the beginners for 22 of 24 comparisons. Moreover, the confidence band of the fitted line based on foci counts from beginners did not include the fitted line of the mean obtained by the expert scorer for all doses ≥0.1 Gy (6 dose points).
Figure 4. Inexperienced scorers detected dose–effect relationship of γH2A.X, 53BP1 and co-localized foci by manual scoring. (A–C) Foci were counted in 100 sham- and irradiated PBMCs per dose point by an expert (black square) and beginners (white circle). Fitted curves (solid line) and corresponding 95% confidence intervals (dashed line) for the mean number of γH2A.X (A), 53BP1 (B) and co-localized γH2A.X and 53BP1 (C) foci were obtained based on spline regression. (D) Difference in mean number of foci between beginners and expert were determined for γH2A.X (white square), 53BP1 (black circle) and co-localized foci (grey triangle) for each irradiation dose. The mean number and variation of foci/cell within one slide was calculated and listed in Supplementary Table S2.
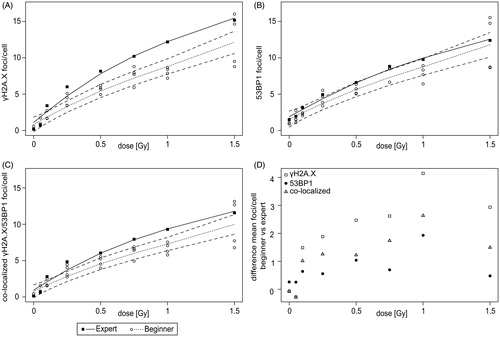
For 53BP1, a dose–effect curve with increasing number of foci was seen for the expert and the beginners ( and Supplementary Table S2). Compared to 0 Gy, irradiated cells showed at least a threefold increase at all irradiation doses ≥0.25 Gy for expert scoring and at all doses ≥0.5 Gy for beginners scoring (all pairwise comparisons of slides). In comparison to semi-automatic foci scoring, the mean number of foci manually scored by the expert was reduced for unirradiated cells (4.39 vs 1.48 foci/cell). Similarly, decreased foci numbers by manual expert counting were observed for irradiation with low doses of 0.05 Gy (4.87 vs 1.96 foci/cell) and 0.1 Gy (3.66 vs 3.12 foci/cell). For unirradiated cells, counts of expert (1.48 foci/cell) and beginners (mean 1.22 foci/cell) were relatively similar. Nevertheless, 2 of 4 inexperienced scorers showed significantly lower foci numbers than the expert (p < .05). After irradiation with 0.05 Gy, three beginners showed a significant lower number of foci (p < .001) in comparison to expert counting. By contrast to γH2A.X, for doses ≥0.1 Gy for 18 of 24 comparisons the beginners scored a significant different (p < .05) number of foci per cell than the expert (15 times lower and 3 times higher). The fitted line of the mean number of foci scored by the expert was outside the confidence band of the fitted line based on counts from beginners for only 2 dose points (0.25 and 0.75 Gy).
The comparison of the mean number of co-localized γH2A.X and 53BP1 foci showed a dose–effect relationship with increasing dose, but frequency of co-localized foci were naturally lower than yH2A.X or 53BP1 foci alone ( and Supplementary Table S2). Compared to 0 Gy, irradiated cells showed at least a threefold increase at all irradiation doses ≥0.05 Gy for expert scoring and at all doses ≥0.1 Gy for beginners scoring (all pairwise comparisons of slides). For unirradiated cells, number of foci were significantly higher for 1 of 4 inexperienced scorers (in mean 0.20 foci/cell) in comparison to expert scoring (0.14 foci/cell, p < .01). After irradiation with 0.05 Gy, only one beginner showed significant higher number of foci (p < .001). According to their statement on the questionnaires, these scorers with significant different counting had moderate or professional experience. Comparisons of the number of foci per cell scored by the expert and by any of the beginners revealed a significant difference for 24 of 24 comparisons (p < .05) for irradiation doses ≥0.1 Gy (22 times lower and 2 times higher). In addition, the confidence band of the fitted line based on foci counts from beginners did not include the fitted line of the mean obtained by the expert scorer for all doses ≥0.25 Gy (5 dose points).
In addition, differences in mean number of γH2A.X, 53BP1 and co-localized foci between beginners and expert counting were evaluated (). For unirradiated cells and after irradiation with 0.05 Gy, higher differences were obtained for 53BP1 (0 Gy: 0.26 foci/cell and 0.05 Gy: 0.26 foci/cell) compared to γH2A.X (0 Gy: −0.08 foci/cell and 0.05 Gy: −0.27 foci/cell) and co-localized foci (0 Gy: −0.06 foci/cell and 0.05 Gy: −0.29 foci/cell). By contrast, 53BP1 foci showed the lowest and γH2A.X foci the highest differences between beginners and expert scoring for irradiation doses ≥0.1 Gy. Differences in mean number of co-localized foci were always between both proteins. In summary, inexperienced scorers were able to detect a dose–effect relationship for γH2A.X, 53BP1 and co-localized foci and moreover to distinguish low irradiation doses from unirradiated cells.
Discussion
In a large-scale radiological accident, most biodosimetry laboratories will quickly reach their capacity limit even with high-throughput methods like γH2A.X foci assay. The data from this study suggested that slides prepared by staff with basic experience in laboratory work could be evaluated for semi-automatic dose estimation and inexperienced scorers should be able to distinguish between irradiated and unexposed samples. Thus, the RIF assay could be supported by inexperienced staff in biodosimetry issues to speed up triage and increase laboratory capacity.
The RIF assay measures initial signals of DNA damage (Rothkamm, Beinke, et al. Citation2013) and enables dose estimation within a few hours after receiving a blood sample (Ainsbury et al. Citation2014). The usefulness of the γH2A.X assay in biodosimetry has been controversially discussed, because of H2A.X phosphorylation directly after exposure to ionizing radiation, the rapid decrease of signals within hours and uncertainty for dose estimation days after exposure (Horn et al. Citation2011; Horn and Rothkamm Citation2011; Rothkamm, Barnard, et al. Citation2013; Moquet et al. Citation2017). However, the assay is highly specific for DSBs, is sensitive to detect low frequencies of induced DSBs, can be performed in a short time frame and provides the opportunity of automated scoring (Sanchez-Flores et al. Citation2015). Nevertheless, in case of a large-scale accident, a huge number of samples have to be processed and evaluated. Immense man power is needed even for a high-throughput method like γH2A.X (Venkateswarlu et al. Citation2015).
The number of γH2A.X foci was analyzed by semi-automatic quantification to evaluate deployment of inexperienced staff in sample preparation and γH2A.X staining that might increase laboratory capacity. No significant differences were noticed in mean number of γH2A.X foci after irradiation between experts and beginners and parallel slides showed high intra-participant reproducibility. All prepared slides of experts and beginners revealed differences between irradiated and unirradiated cells and between the two different irradiation doses. Collaboration in established networks can provide assistance in sample preparation or scoring (Moquet et al. Citation2017). Laboratory inter-comparisons for γH2A.X showed variation in mean number of γH2A.X foci and differences in staining quality between laboratories (Rothkamm, Barnard, et al. Citation2013; Rothkamm, Horn, et al. Citation2013). Experience, research-focus of laboratories and varieties in slide preparation, staining procedure or reagent preparation could affect the quality and therefore sensitivity of the assay (Rothkamm, Barnard, et al. Citation2013; Rothkamm, Beinke, et al. Citation2013; Vandevoorde et al. Citation2015). Therefore, the need of harmonization and standardization of the γH2A.X staining protocol or technical equipment is essential for reliable and comparable results (Barnard et al. Citation2015; Sanchez-Flores et al. Citation2015). With regard to biological dosimetry, each laboratory has to demonstrate the sensitivity of the used protocol and foci scoring method with respect to the analyzed dose range and to establish a specific calibration curve for dose estimation (Rothkamm, Barnard, et al. Citation2013). The results presented here may increase the laboratory capacity and support the collaboration in networks. Inter-laboratory differences can be minimized by integration of inexperienced operators. Instructed by experts, inexperienced operators can produce comparable slides of good quality for significant distinction between 0.1 Gy and 0 Gy samples and between 1 Gy and 0.1 Gy within one laboratory. In a first step, this would be sufficient to distinguish ‘worried well’ from exposed people. Exact irradiation doses should be further estimated by accurate cytogenetic assays in a longer time frame (Romm et al. Citation2009; Rothkamm, Barnard, et al. Citation2013; Rothkamm, Beinke, et al. Citation2013).
Once slides were stained, counting of RIF is frequently carried out by eye and is a bottleneck of this assay. In this study, inexperienced scorers quantified the number of γH2A.X and 53BP1 foci to evaluate irradiation-induced damage. The scoring by inexperienced persons might enable a significant increase of the number of analyzed slides without increasing the analysis time. Manual γH2A.X foci counting of prepared slides by inexperienced scorers showed a dose–effect relationship. Except for 0 and 0.05 Gy, the expert scored higher foci numbers than the beginners and counts of the expert were not in the confidence band from the scoring of beginners for 6 of 8 dose points. This result is in line with a previous telescoring inter-comparison of the European Network of Biological and retrospective Physical dosimetry (RENEB) in which considerable variation between laboratories was observed but samples could still be ranked by increasing dose (Barnard et al. Citation2015). Differences in foci size and intensity distort an objective manual evaluation of foci numbers (Roch-Lefevre et al. Citation2010) and may explain differences between expert and beginners. Furthermore, foci counting becomes more and more difficult at higher doses because of close proximity or overlapping of foci (Rothkamm, Barnard, et al. Citation2013). Manual 53BP1 foci counting of prepared slides by inexperienced scorers showed a clear dose–response curve, but contrary to γH2A.X, only 2 of 8 dose points of expert counting were outside the confidence band of beginners scoring. In addition, the difference in mean number of 53BP1 foci counts between beginners and the expert were lower for irradiation doses ≥0.1 Gy in comparison to γH2A.X and co-localized foci. However, constitutive expression of 53BP1 results in diffuse background signals of 53BP1 in unirradiated cells and can cause difficulties in foci counting (Turner et al. Citation2014; Durdik et al. Citation2015). Both, γH2A.X and 53BP1, co-localize in human G0-lymphocytes and simultaneous scoring of both may reduce the possibility of false positive foci counts and may increase robustness (Schultz et al. Citation2000; Horn et al. Citation2011; Horn and Rothkamm Citation2011). The obtained results indicated a dose–effect relationship for co-localized foci. However, for 5 of 8 dose points, expert counts were outside the confidence band of the scoring from beginners but differences were lower than the differences observed for γH2A.X. The differences in foci scoring between beginners and expert were lower for unirradiated cells in comparison to 53BP1 and after irradiation right in the middle of γH2A.X and 53BP1 foci counting alone. In summary, manual foci counting by inexperienced scorers showed a clear dose–effect relationship for γH2A.X, 53BP1 and co-localized foci and may indicate the possibility for the deployment of inexperienced staff for RIF quantification.
Prepared slides of manual counting were analyzed by semi-automatic evaluation to verify dose–effect relationship after irradiation and to check slide quality. The semi-automatic evaluation of γH2A.X and 53BP1 foci showed a dose–response relationship. In comparison to manual 53BP1 foci scoring, the mean number of 53BP1 foci by semi-automatic evaluation is higher for unirradiated cells because background signals can be better distinguished from true foci signals by eye in comparison to semi-automatic counting (Hernández et al. Citation2013; Durdik et al. Citation2015; Lengert et al. Citation2018). Diffuse 53BP1 signals in unirradiated cells reduce sensitivity of semi-automatic foci counting considerably. In future perspectives, machine learning and classifier adaptions will help to improve semi-automatic foci counting. Nevertheless, using semi-automatic evaluation of foci can be a possibility to overcome the limitations in sample size and individual bias of manual counting (Roch-Lefevre et al. Citation2010; Hernández et al. Citation2013). Although immunofluorescence analysis of RIF is applicable to a wide range of doses and is highly sensitive to low doses, flow cytometry is in the ascendancy in respect to sample size and time investment for initial triage (Horn and Rothkamm Citation2011; Venkateswarlu et al. Citation2015). However, imaging flow cytometry may combine the advantages of both methods and may be useful in the detection of exposure to ionizing radiation (Durdik et al. Citation2015).
In case of large-scale accident, accuracy, sensitivity and specificity are less important for biodosimetric methods than large capacity and speed for triage (Rothkamm, Beinke, et al. Citation2013). Collaboration within networks, simplification and automation of methods and reduction of requirements for triage can speed up methods and can provide relatively quick results for thousands of people (Swartz et al. Citation2014). In line with the claim of unnecessity of expert personnel to collect samples or to analyze the samples in initial triage (Swartz et al. Citation2014), the obtained results indicated that slides prepared by inexperienced staff could be evaluated for dose estimation by semi-automatic evaluation. Thereby the variability by differences in staining protocol, antibody usage and technical equipment is minimized and the number of processed samples could be increased by enhancement of man power. In addition, inexperienced scorers should be able to distinguish between irradiation doses and unexposed samples by manual foci counting. Due to intense, and clearly distinguishable signals, manual counting of 53BP1 foci require less experience than scoring of γH2A.X foci since scoring of expert and beginners showed the highest consistency. However, diffuse 53BP1 signals might affect categorization of unirradiated samples. Scoring of co-localized foci could be the method of choice to increase the robustness of unirradiated controls, minimize false-positive results and reduce the differences between beginners and experts in irradiated samples.
Author contributions
MB, DE, MG, UR designed research; MB, UR performed research with course participants; MB, LD, DE analyzed data and produced figures; MB, DE, MG wrote the manuscript; all authors reviewed and revised the manuscript.
Supplementary_Table_S2_Dose-Effect_yH2AX_53BP1_manual_scoring.docx
Download MS Word (15.5 KB)Supplementary_Table_S1_Dose-Effect_yH2AX_beginners_and_experts_semi-automatic.docx
Download MS Word (14.6 KB)Acknowledgments
The authors thank Ingrid Baumgartner, Frank Bunk, Elisa Metzgen and Juliane Pätzold, Radiation Biology Section, Federal Office for Radiation Protection, Neuherberg, Germany, for excellent technical assistance and Simone Mörtl, Federal Office for Radiation Protection, Neuherberg, Germany, for fruitful discussions. The authors also thank all course participants of the ‘InterRad’ courses 2018 and 2020 for contribution to this study.
Disclosure statement
The authors declare that they have no conflict of interest.
Additional information
Funding
Notes on contributors
Martin Bucher
Martin Bucher, M.Sc., is a biologist and PhD student at the Department of Effects and Risks of Ionizing and Non-Ionizing Radiation, Federal Office for Radiation Protection, Neuherberg, Germany. He focuses on radiation sensitivity, radiation effects, biomarker development for radiation protection and high-throughput methods.
Lukas Duchrow
Lukas Duchrow, B.Sc., is a biomathematician at the Department of Effects and Risks of Ionizing and Non-Ionizing Radiation, Federal Office for Radiation Protection, Neuherberg, Germany. He focuses on statistical analysis of radiation biology experiments.
David Endesfelder
David Endesfelder, PhD, is a biomathematician and a Senior Researcher at the Department of Effects and Risks of Ionizing and Non-Ionizing Radiation, Federal Office for Radiation Protection, Neuherberg, Germany. He focuses on statistical methods in radiation biology and biological dosimetry.
Ute Roessler
Ute Roessler, PhD, is a biologist and a Senior Researcher at the Department of Effects and Risks of Ionizing and Non-Ionizing Radiation, Federal Office for Radiation Protection, Neuherberg, Germany. She focuses on radiation sensitivity, radiation effects and high-throughput methods.
Maria Gomolka
Maria Gomolka, PhD, is a biologist and a Senior Researcher at the Department of Effects and Risks of Ionizing and Non-Ionizing Radiation, Federal Office for Radiation Protection, Neuherberg, Germany. She focuses on radiation sensitivity, biobanking of radiation exposed individuals and biomarker development for radiation protection.
References
- Ainsbury EA, Al-Hafidh J, Bajinskis A, Barnard S, Barquinero JF, Beinke C, de Gelder V, Gregoire E, Jaworska A, Lindholm C, et al. 2014. Inter- and intra-laboratory comparison of a multibiodosimetric approach to triage in a simulated, large scale radiation emergency. Int J Radiat Biol. 90:193–202.
- Barnard S, Ainsbury EA, Al-Hafidh J, Hadjidekova V, Hristova R, Lindholm C, Monteiro Gil O, Moquet J, Moreno M, Rossler U, et al. 2015. The first gamma-H2AX biodosimetry intercomparison exercise of the developing European biodosimetry network RENEB. Radiat Prot Dosimetry. 164:265–270.
- Durdik M, Kosik P, Gursky J, Vokalova L, Markova E, Belyaev I. 2015. Imaging flow cytometry as a sensitive tool to detect low-dose-induced DNA damage by analyzing 53BP1 and γH2AX foci in human lymphocytes. Cytometry A. 87:1070–1078. eng.
- Gałecki M, Tartas A, Szymanek A, Sims E, Lundholm L, Sollazzo A, Cheng L, Fujishima Y, Yoshida MA, Żygierewicz J, et al. 2019. Precision of scoring radiation-induced chromosomal aberrations and micronuclei by unexperienced scorers. Int J Radiat Biol. 95:1251–1258.
- Garty G, Bigelow AW, Repin M, Turner HC, Bian D, Balajee AS, Lyulko OV, Taveras M, Yao YL, Brenner DJ. 2015. An automated imaging system for radiation biodosimetry. Microsc Res Tech. 78:587–598.
- Garty G, Chen Y, Salerno A, Turner H, Zhang J, Lyulko O, Bertucci A, Xu Y, Wang H, Simaan N, et al. 2010. The RABIT: a rapid automated biodosimetry tool for radiological triage. Health Phys. 98:209–217.
- Garty G, Chen Y, Turner HC, Zhang J, Lyulko OV, Bertucci A, Xu Y, Wang H, Simaan N, Randers-Pehrson G, et al. 2011. The RABiT: a rapid automated biodosimetry tool for radiological triage. II. Technological developments. Int J Radiat Biol. 87:776–790.
- Hernández L, Terradas M, Martín M, Tusell L, Genescà A. 2013. Highly sensitive automated method for DNA damage assessment: gamma-H2AX foci counting and cell cycle sorting. Int J Mol Sci. 14:15810–15826.
- Horn S, Barnard S, Rothkamm K. 2011. Gamma-H2AX-based dose estimation for whole and partial body radiation exposure. PLoS One. 6:e25113.
- Horn S, Rothkamm K. 2011. Candidate protein biomarkers as rapid indicators of radiation exposure. Radiat Measur. 46:903–906.
- Jakl L, Markova E, Kolarikova L, Belyaev I. 2020. Biodosimetry of low dose ionizing radiation using DNA repair foci in human lymphocytes. Genes. 11:58.
- Kulka U, Abend M, Ainsbury E, Badie C, Barquinero JF, Barrios L, Beinke C, Bortolin E, Cucu A, De Amicis A, et al. 2017. RENEB – Running the European Network of biological dosimetry and physical retrospective dosimetry. Int J Radiat Biol. 93:2–14.
- Kulka U, Ainsbury L, Atkinson M, Barquinero JF, Barrios L, Beinke C, Bognar G, Cucu A, Darroudi F, Fattibene P, et al. 2012. Realising the European Network of Biodosimetry (RENEB). Radiat Prot Dosimet. 151:621–625.
- Lacombe J, Sima C, Amundson SA, Zenhausern F. 2018. Candidate gene biodosimetry markers of exposure to external ionizing radiation in human blood: a systematic review. PLoS One. 13:e0198851-e0198851.
- Lengert N, Mirsch J, Weimer RN, Schumann E, Haub P, Drossel B, Löbrich M. 2018. AutoFoci, an automated high-throughput foci detection approach for analyzing low-dose DNA double-strand break repair. Sci Rep. 8:17282.
- Marchetti F, Coleman MA, Jones IM, Wyrobek AJ. 2006. Candidate protein biodosimeters of human exposure to ionizing radiation. Int J Radiat Biol. 82:605–639.
- Moquet J, Barnard S, Staynova A, Lindholm C, Monteiro Gil O, Martins V, Rößler U, Vral A, Vandevoorde C, Wojewódzka M, et al. 2017. The second gamma-H2AX assay inter-comparison exercise carried out in the framework of the European biodosimetry network (RENEB). Int J Radiat Biol. 93:58–64.
- Ottolenghi A, Trott K-R, Smyth V. 2019. Education and training to support radiation protection research in Europe: the DoReMi experience. Int J Radiat Biol. 95:90–96.
- Panier S, Boulton SJ. 2014. Double-strand break repair: 53BP1 comes into focus. Nat Rev Mol Cell Biol. 15:7–18.
- Paul S, Amundson SA. 2008. Development of gene expression signatures for practical radiation biodosimetry. Int J Radiat Oncol Biol Phys. 71:1236–1244.
- Redon CE, Nakamura AJ, Martin OA, Parekh PR, Weyemi US, Bonner WM. 2011. Recent developments in the use of γ-H2AX as a quantitative DNA double-strand break biomarker. Aging (Albany NY). 3:168–174.
- Roch-Lefevre S, Mandina T, Voisin P, Gaetan G, Mesa JE, Valente M, Bonnesoeur P, Garcia O, Voisin P, Roy L. 2010. Quantification of gamma-H2AX foci in human lymphocytes: a method for biological dosimetry after ionizing radiation exposure. Radiat Res. 174:185–194.
- Rogakou EP, Boon C, Redon C, Bonner WM. 1999. Megabase chromatin domains involved in DNA double-strand breaks in vivo. J Cell Biol. 146:905–916.
- Rogakou EP, Pilch DR, Orr AH, Ivanova VS, Bonner WM. 1998. DNA double-stranded breaks induce histone H2AX phosphorylation on serine 139. J Biol Chem. 273:5858–5868.
- Romm H, Oestreicher U, Kulka U. 2009. Cytogenetic damage analysed by the dicentric assay. Ann Ist Super Sanita. 45:251–259.
- Romm H, Ainsbury E, Barnard S, Barrios L, Barquinero JF, Beinke C, Deperas M, Gregoire E, Koivistoinen A, Lindholm C, et al. 2013. Automatic scoring of dicentric chromosomes as a tool in large scale radiation accidents. Mutat Res. 756:174–183.
- Rothkamm K, Barnard S, Ainsbury EA, Al-Hafidh J, Barquinero JF, Lindholm C, Moquet J, Perala M, Roch-Lefevre S, Scherthan H, et al. 2013. Manual versus automated γ-H2AX foci analysis across five European laboratories: can this assay be used for rapid biodosimetry in a large scale radiation accident? Mutat Res. 756:170–173.
- Rothkamm K, Beinke C, Romm H, Badie C, Balagurunathan Y, Barnard S, Bernard N, Boulay-Greene H, Brengues M, De Amicis A, et al. 2013. Comparison of established and emerging biodosimetry assays. Radiat Res. 180:111–119.
- Rothkamm K, Horn S, Scherthan H, Rossler U, De Amicis A, Barnard S, Kulka U, Lista F, Meineke V, Braselmann H, et al. 2013. Laboratory intercomparison on the γ-H2AX foci assay . Radiat Res. 180:149–155.
- Sanchez-Flores M, Pasaro E, Bonassi S, Laffon B, Valdiglesias V. 2015. γH2AX assay as DNA damage biomarker for human population studies: defining experimental conditions. Toxicol Sci. 144:406–413.
- Savic V, Yin B, Maas NL, Bredemeyer AL, Carpenter AC, Helmink BA, Yang-Iott KS, Sleckman BP, Bassing CH. 2009. Formation of dynamic gamma-H2AX domains along broken DNA strands is distinctly regulated by ATM and MDC1 and dependent upon H2AX densities in chromatin. Mol Cell. 34:298–310.
- Schultz LB, Chehab NH, Malikzay A, Halazonetis TD. 2000. p53 binding protein 1 (53BP1) is an early participant in the cellular response to DNA double-strand breaks. J Cell Biol. 151:1381–1390.
- Stiff T, O'Driscoll M, Rief N, Iwabuchi K, Lobrich M, Jeggo PA. 2004. ATM and DNA-PK function redundantly to phosphorylate H2AX after exposure to ionizing radiation. Cancer Res. 64:2390–2396.
- Swartz HM, Williams BB, Flood AB. 2014. Overview of the principles and practice of biodosimetry. Radiat Environ Biophys. 53:221–232.
- Turner HC, Sharma P, Perrier JR, Bertucci A, Smilenov L, Johnson G, Taveras M, Brenner DJ, Garty G. 2014. The RABiT: high-throughput technology for assessing global DSB repair. Radiat Environ Biophys. 53:265–272.
- Vandevoorde C, Gomolka M, Roessler U, Samaga D, Lindholm C, Fernet M, Hall J, Pernot E, El-Saghire H, Baatout S, et al. 2015. EPI-CT: in vitro assessment of the applicability of the gamma-H2AX-foci assay as cellular biomarker for exposure in a multicentre study of children in diagnostic radiology. Int J Radiat Biol. 91:653–663.
- Venkateswarlu R, Tamizh SG, Bhavani M, Kumar A, Alok A, Karthik K, Kalra N, Vijayalakshmi J, Paul SFD, Chaudhury NK, et al. 2015. Mean frequency and relative fluorescence intensity measurement of γ-H2AX foci dose response in PBL exposed to γ-irradiation: an inter- and intra-laboratory comparison and its relevance for radiation triage. Cytometry A. 87:1138–1146.
- Wojcik A, Oestreicher U, Barrios L, Vral A, Terzoudi G, Ainsbury E, Rothkamm K, Trompier F, Kulka U. 2017. The RENEB operational basis: complement of established biodosimetric assays. Int J Radiat Biol. 93:15–19.