
Abstract
Purpose
Ionizing radiation is found naturally in the environment. Low doses of IR may have beneficial applications, yet there is also potential for detrimental long-term health effects. Impacts following exposure to low levels of IR have been refractory to identification and quantification. Glycoprotein glycosylation is vital to cell–cell communication and organismal function, and sensitive to changes in an organism's macro- and cellular environment. We investigated whether accumulated low doses of IR (LoDIR) affect the N-linked glycoprotein glycans using Medaka fish (Oryzias latipes).
Materials and methods
State-of-the-art methods in radiation exposure and glycan analysis were applied to study N-glycan changes after 190 day exposure at three different rates of gamma irradiation (2.25, 21.01, and 204.3 mGy/day) in wild-type adult Medaka. Tissue N-glycans were analyzed following enzymatic release from extracted proteins.
Results
N-linked glycan profiles are dominated by complex type N-glycans modified with terminal sialic acid and core fucose. Fucosylation and sialylation of N-linked glycoprotein glycans are affected by LoDIR and a subset of N-glycans are involved in the organismal radio–response.
Conclusion
This is the first indication that the glycome can be interrogated for biomarkers that report the impact of chronic exposure to environmental stressors, such as low-level IR.
Introduction
Modern technologies employ ionizing radiation (IR) in medical tests, radiotherapy, agricultural, nuclear power, and weapons development (Morgan and Bair Citation2013; Desouky et al. Citation2015). The use of IR has become more common in a variety of fields and can be considered as a class of environmental pollutants with potentially adverse impacts on the health of humans and wildlife. Organisms in turn adapt to the addition of this environmental stress factor. IR can affect cells through direct action by breaking one or both DNA strands (most frequently at high/acute exposures), or indirect action via the creation of reactive oxygen species and other free radicals through the radiolysis of the water inside the cell (Saha Citation2012) (the probability of which increases during exposure to low levels of IR). Both mechanisms result in chemical changes (e.g. oxidative alterations to DNA, lipid peroxidation, and protein oxidation) which lead to biological damage (Mahaney et al. Citation2009; Azzam et al. Citation2012; Spitz and Hauer-Jensen Citation2014). Based on the higher relative abundance of water molecules compared to genomic DNA inside cells, chemical damage from low-dose, chronic exposure most probably derives primarily from reactive oxygen species.
Effects of high/moderate ionizing radiation such as cell death, chromosomal aberrations, DNA damage, mutagenesis, and carcinogenesis are well understood and extensively studied (Barber et al. Citation2002; Dubrova Citation2003; Joseph et al. Citation2004; Saha Citation2012; Perumal et al. Citation2015; Lusiyanti et al. Citation2019), and the linear relationship between high doses of radiation and biological effects are well accepted. Research on how to improve radiotherapy has played an important role in the understanding of these relationships when a chronic exposure occurs. Most of these studies have individual doses in the range of one therapy session (approximately 1.8–2 Gy/day for epithelial cancers), with an accumulative radiation dosage of 40–60 Gy by the end of treatment (Locke et al. Citation2001).
There is significantly less understanding of the impacts and risks of chronic exposure to low-dose IR (LoDIR), as few studies have actually been undertaken (Lee et al. Citation2010; Joo et al. Citation2012; Chaze et al. Citation2013; Joo et al. Citation2015; Tóth et al. Citation2016). The various and sometimes contradictory responses after exposure to low doses of IR (Wolff Citation1998; Waldren Citation2004; de Toledo and Azzam Citation2006; Morgan and Sowa Citation2007; Smith et al. Citation2011), serve to complicate interpretations of the biological response to LoDIR. This in turn has limited the available interventions for LoDIR exposure to the development of techniques for early biodosimetric assessment and diagnoses of exposure for occupational workers (Rana et al. Citation2010).
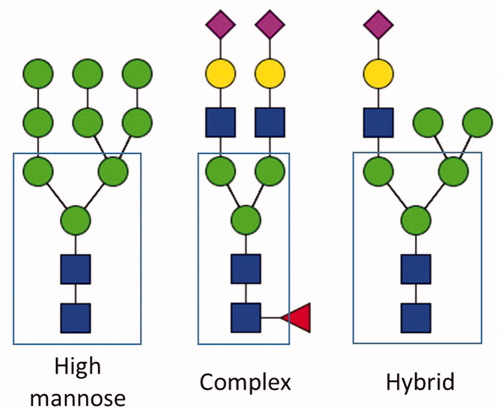
Radiation biology research is increasingly utilizing ‘omics’ approaches to understand how organisms respond to IR (Baiocco et al. Citation2019; Karapiperis et al. Citation2020). Among these approaches, glycomics is relatively unexplored in regard to IR. The glycome of a cell or tissue is defined as the comprehensive collection of all of the glycoconjugate glycans expressed by that cell or tissue and can be divided into subsets of glycans, such as the glycoprotein N-linked glycome, the glycoprotein O-linked glycome, and the glycolipid glycome. The glycoprotein N- and O-linked glycomes comprise one of the most common and abundant post-translational modifications of proteins (Spiro Citation2002). N-glycans are linked to an asparagine residue that is part of the sequon AsnX-Ser/Thr, where X represents any amino acid except proline. All N-glycans share a common core sugar and are classified into three types (): High mannose, complex, and hybrid (Stanley et al. Citation2009). Protein glycosylation regulates proper protein folding and plays essential roles in cell-to-cell communication. Currently, interest in the role of protein glycosylation has increased the effort to understand the biological responses and impacts following exposure to moderate and LoDIR. An early serum N-glycome study in mice showed that exposure to high doses of ionizing radiation (20, 40, and 80 Gy) produced alterations in structures and families of N-glycans (Chaze et al. Citation2013). Another study demonstrated a change in the glycosylation profile of plasma proteins in humans during the course of radiotherapy (∼60Gy) (Tóth et al. Citation2016). A common feature reported in these previous studies is the fact that N-glycan structures with decorations of fucose or sialic acid were affected by exposure to ionizing radiation. More generally, it has been recognized that these two monosaccharides are useful biomarkers for a number of cancers and cancer progressions (Turner et al. Citation1985; Chinnannavar et al. Citation2015; Zhang et al. Citation2018)
Figure 1. Types of N-glycans. Examples of the three major types of N-glycan are presented. Highlighted in a box is the common core for all the N-glycan structures. Red triangles: fucose; yellow circles: galactose; green circles: mannose; blue squares: N-acetylglucosamine; fuchsia diamonds: N-acetylneuraminic acid (sialic acid).
Biomarkers can be especially important in understanding the relationship between exposure and the prevalence of a resulting pathology. Currently established biomarkers for radiation exposure are used in a detection range between 0.1–20 Gy. (Marchetti et al. Citation2006; Badie et al. Citation2016). Biomarker proteins have been proposed to assist in the early diagnosis of radiation exposure or an injury after nuclear accidents or terrorist attacks (Guipaud and Benderitter Citation2009), but to date, no glycan changes have been described as biomarkers for exposure to IR. As a result, we decided to study not only the levels of fucose and sialic acid in samples chronically exposed to LoDIR, but also the impact of those changes in the N-glycan profile.
In this exploratory study, we ask (i) whether chronic exposure to LoDIR results in altered levels of fucose and sialic acid, (ii) whether such changes alter the N-glycome of fish tissues, and (iii) whether we can suggest specific structures that may differentiate between levels of IR used in this study as possible biomarkers for radiation exposure. Medaka has been a useful research model, in large part due to the high similarity of this species with humans in essential genes and regulation processes (Lin et al. Citation2016). It has also been suggested that fish and humans share important enzymes of the glycosylation process (Freeze et al. Citation2009). Medaka have a tolerance to a broad spectrum of environmental conditions that make the species ideal for an outdoor epidemiologic study (Shima and Mitani Citation2004). Also, Medaka have been used before to study space radiation and microgravity effects in vertebrates (Murata et al. Citation2015), which suggests a good tolerance to chronic exposure as well. In this study, we used lectin staining, chemical analysis, and mass spectrometric analysis to research the effects of chronic exposure to LoDIR on N-glycans from Medaka. The doses selected in our study reflect the logic described by Bertucci et al. (Bertucci et al. Citation2020) including the safety limit of the aquatic organism (<10mGy/day), dose rates that cause alteration in fish (>12mGy/day) (IAEA Citation2006) and doses close to could be experienced in the exclusion zones in the aftermath of nuclear disasters (IAEA Citation2006; Horemans et al. Citation2019) To our knowledge, this is the first study on low-dose IR that analyses the N-glycome of a whole organism. These results present the first step toward developing and validating N-glycans as possible biomarkers for exposure to low levels of IR.
Experimental procedures
Exposure to ionizing radiation
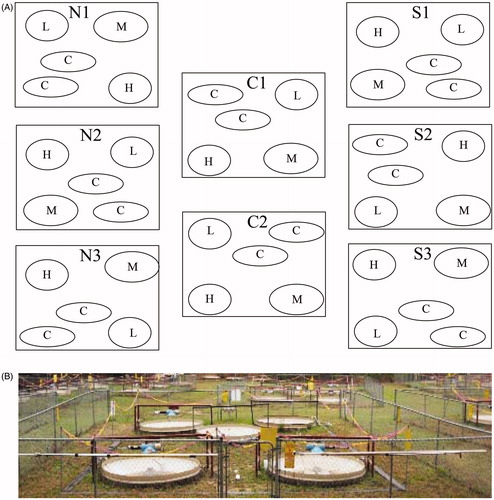
Exposure of Medaka occurred at the Savannah River Ecology’s LoDIF (Low Dose Irradiation Facility). This 0.4 ha area facility contains several sets of outdoor, flow-through, aquatic mesocosm arrays. Each array contains a pair of control and three irradiated mesocosms. The irradiated mesocosms were either a 0.74 (low), 7.4 (medium), or 74.0 (high) MBq sealed Cesium-137 source irradiator with collimated shielding stationed above the mesocosm tanks. The two control mesocosm have no sources (Hinton et al. Citation2004). Within each mesocosm, screened buckets allow for aquatic animals to be placed in the water flow directly below irradiators to allow for long-term, confined exposure in a natural outdoor environment. Fish were fed daily a combination of Tetramin Tropical Flake food and brine shrimp eggs, obtain from Brine Shrimp Direct, in both the rearing and irradiating facility. The water source for both the rearing and irradiating facilities (filtered lake water pumped to each facility) was the same and replenished weekly to keep experimental and rearing conditions consistent. Prior to performing the experiment, we established the exact doses of exposure for each irradiator (or control) and mesocosm pair using Panasonic Model UD-802 Thermoluminescent dosimeters encased in waterproof containers placed at the bottom and top (waterline) of each bucket (Supplementary Figure 1). We calculated the dose for each irradiator-mesocosm after approximately 11.8 days of exposure and then calculated the average dose in mrem.hr across irradiators for each of the four IR exposure levels and control; data in Supplementary File S1. Medaka were initially reared from stock maintained in lab-base, flow-through systems at the Savannah River Ecology Laboratory (SREL) with a 14 h:10 h light–dark cycle at 25 °C. We randomly assigned 10 wild-type adult fish (6 to 8-months-old, both equal, male and female) to one of each of 4 mesocosm treatment groups (Control, Low, Medium, and High across 4 arrays), resulting in 160 individuals (10 per mesocosm across 4 treatments in 4 arrays) utilized in the experiment. The mesocosm array provided exposure to different environmentally relevant doses of IR, low (L) 2.25mGy/day, medium (M) 21.01mGy/day, and high (H) 204.3 mGy/day. Over the course of 190 days, this resulted in a cumulative exposure of 0.43 Gy, 3.99 Gy, and 38.82 Gy in low, medium, and high levels, respectively (Supplementary File S1). The not irradiated group in the mesocosm arrays served as a control (C) at background IR levels of 0.1 mGy/day obtaining cumulative radiation of 0.019 Gy due to the proximity with the irradiated mesocosms. After 190 days of exposure fish from 3 arrays (120 fish) were euthanized according to the requirements of Animal Care and Use at the University of Georgia (AUP #A201305-018-Y1-A0) and dissected into 2 separate tissue groups: Carcasses (muscle, brain, eyes, gills, spinal cord, fins, and scales) and Organs (kidney, heart, liver, and gonad). Samples were preserved using liquid nitrogen and kept at −80 °C for further analyses. In we present a schematic distribution of the mesocosm arrays at the LoDIF and a picture of one of the mesocosm-arrays.
Figure 2. (A) Diagram of the distribution of mesocosm arrays at the Low Dose Irradiation Facility (LoDIF). Each square represents a mesocosm-array, consisting of five isolated mesocosms-irradiator pairs represented as circles (three with Cs137 irradiators and two non-irradiated controls). Under each mesocosm-irradiator was a bucket containing 10 fish. C: control; L: low dose (2.25 mGy/day); M: medium dose (21.01 mGy/day); H: high dose (204.3 mGy/day). (B) Picture of a mesocosm-array.
Immunohistochemistry
We performed lectin histochemistry to detect the presence of fucose and sialic acid-containing glycoconjugates. The fucosylated glycoconjugates were detected utilizing Fluorescein-labeled AAL, while we used biotinylated MAL II and biotinylated SNA to detect sialylated glycoconjugates. One of the mesocosm arrays was dedicated to histology. Following exposure, fish from this array were preserved in formalin and taken to the College of Veterinary Medicine at the University of Georgia, where the fish were embedded in paraffin and sectioned sagitally across the whole body. Tissues were deparaffinized by sequential immersions in xylene followed by graded ethanol solutions. The tissues were rehydrated with deionized water, and antigen retrieval was performed using 10 mM sodium citrate buffer, pH 6. Tissues Slides were permeabilized by immersion in 0.1% (w/v) Triton X-100 in PBS. For blocking, a 5% (v/v) goat serum, 0.1% (w/v) Triton X-100 PBS solution was used. After blocking, the primary lectin probe solution of 1% (v/v) DMSO in PBS containing Fluorescein labeled Aleuria aurantia lectin (AAL) (Vector Laboratories, FL-1391) (1:500), or Biotinylated Sambucus nigra Lectin (SNA, EBL) (Vector Laboratories, B-1305) (1:500) and Biotinylated Maackia amurensis Lectin II (MAL II) (Vector Laboratories, B-1265) (1:500) was applied and incubated in a humidified chamber overnight at 4 °C. Following incubation, the tissues were washed with PBS for 10 min by immersion, 3 times. A solution of 1% (v/v) DMSO in PBS containing IRDye 680RD/mole Streptavidin (LI-COR, 926-68079) (1:1000) and DAPI (Millipore Sigma, 28718-90-3) (1:2000) was then applied to the tissues and incubated for 1 h RT. After incubation, the tissues were washed 10 min by immersion in PBS buffer, 3 times, mounted in anti-fade reagent, and keep in the ark until further analysis.
Confocal imaging and immunofluorescence analysis
Tissue imaging was performed using an Olympus FluoView FV1200 microscope. Images were acquired in the z-dimension with a step-size of 0.5 mm using a 60× (N.A. 1.42) oil objective. Laser intensity, slice thickness, and all other acquisition parameters were identical for control and irradiated fish. Image analysis was accomplished using the Slide book 5.0 digital microscopy software package (Intelligent Imaging Innovations) on non-compressed z-stacks. Confocal stacks were adjusted for background and channel threshold using the software supplier’s recommended algorithms. For analysis, specific portions of the full acquired images were cropped to examine and quantify analogous features from gills and liver across all the images. Gills are one of the most studied organs in toxicology and radiobiology (M et al. Citation2017), and effects observed in fish gills can be correlated with those described in human gut and kidney (Evans Citation1987), while the liver has a number of essential functions including uptake, metabolism, storage and redistribution of nutrients, and detoxification (Wolf and Wolfe Citation2005). We decided to analyze the lamellae (gill filaments of bony fish) in gills due to the artifacts that can occur in the gill arch during sectioning of small fish like Medaka (Wolf et al. Citation2015). In the liver the position of the crops was based on the distance (30 microns) from liver blood vessels, allowing us to locate the crops in a consistent position across all the images (Supplementary File S2), resulting in a well-defined comparison between the control and the irradiated samples.
In total nine crops from each organ in each group were extracted and normalized based on the non-treated control, and the total fluorescence for each lectin was quantified. Supplementary File S2 presents the crops obtained for each fish.
Glycosyl residue composition analysis by gas chromatography with mass spectrometry and flame ionization detection for fucose quantification (alditol acetate derivatization)
Following the exposure, those fish not used for microscopy were dissected, and the tissues were divided into two groups (Carcasses or Organs) to analyze the whole body. The tissues were homogenized to obtain a protein-rich powder as described previously (Perez-Gelvez et al. Citation2019). Protein-rich powder is the starting material for this and the subsequent methods describe below. Quantification of protein was performed using a BCA protein assay kit (ThermoFisher Scientific # 23227) following the manufacturer’s instructions. Fucose quantification was done to follow a previously published protocol (Pena et al. Citation2012). Briefly, 200 µL of 2 M trifluoroacetic acid and 5 µL of 20 mM myo-inositol were added to 100–400 µg of lyophilized protein and incubated 2 h at 121 °C. After the tubes were cooled at room temperature, the samples were dried under nitrogen. To remove TFA traces, 200 µL of isopropanol was added to the samples, which were then vortexed and evaporated as before. This was repeated twice to ensure TFA removal. A solution of 10 mg/mL of sodium borohydride in 50 mM ammonium hydroxide was prepared and 200 µL was added to each of the samples. Overnight incubation at room temperature was followed by the addition of five drops of glacial acetic acid (HOAc) and five drops of anhydrous Methanol (MeOH). The sample was dried under N2, 500 µL of a 9:1 MeOH:HOAc to each sample, and the samples were dried under N2. Addition of MeOH:HOAc to the samples and subsequent dry down was repeated two more times. To dissolve the sample, 250 µL of anhydrous acetic anhydride was added to each of the samples and vortexed. Addition of 230 µL of concentrate TFA to each sample, vortex, and incubation at 50 °C for 20 min was necessary. The samples were cooled at room temperature, 1 mL of isopropanol was added and then dried under nitrogen. The samples were dissolved using 2 mL of nanopure H2O followed by the addition of 2 mL of dichloromethane. The samples were subsequently vortexed for 30 s and then centrifuged for 20 s. The aqueous layer was discarded, followed by the addition of 2 mL of nanopure H2O, vortexed, and centrifuged, discarding again the aqueous layer. This was repeated two more times. The bottom layer was then transferred to another tube and concentrated under N2 to approximately 100 µL. The alditol acetate derivatives were analyzed using a gas chromatograph following the conditions established for our laboratory (Pena et al. Citation2012).
DMB labeling for sialic acid quantification
One-hundred micrograms of lyophilized protein from the protein-rich powder was treated with 1 µg of sialidase A (New England Biolabs) and incubated overnight at 37 °C. Released sialic acid residues from glycans were purified using a C18 cartidge (Waters). DMB-labeling was performed as previously described (Nakata and Troy Citation2005), where an equal volume of purified glycan was added to DMB solution (7 mM DMB (Dojindo M021-12), 18 mM Na2S2O4, 1.0 M 2-mercaptoethanol, and 20 mM trifluoroacetic acid) and labeled at 55 °C for 2 h. The reaction was stopped by placing the samples on dry ice for 10 min. Labeled samples were then centrifuged at 14,000 rpm for 10 min and the supernatant was taken. Labeled sialic acid residues were separated on a TSK-gel ODS-120T column (4.6 × 250 mm, Sigma Aldrich) using an Agilent 1100 HPLC system. The column was eluted with a linear gradient of 5% methanol/25 mM of Sodium Acetate (pH3.8) to 80% methanol/25 mM of Sodium Acetate (pH3.8) in 25 min at a flow rate of 1 mL/min and monitored with a fluorescent detector (excitation, 373 nm; emission, 448 nm). Molar values were determined using standards of Neu5Ac and Neu5Gc monomers (Sigma Aldrich).
Enzymatic release of N-glycans
The protein-rich powder was obtained as previously described (Perez-Gelvez et al. Citation2019) and N-glycan analysis was performed with some modifications as described previously (Aoki et al. Citation2007). Briefly, 3–5 mg of protein-rich powder from each sample was resuspended in 200 µL of trypsin buffer (Tris 0.1 M, HCl, CaCl2*H2O 2 mM pH8.2) and sonicated for 5 min. The sample was boiled in a 100 °C heating block for 5 min and then cooled to room temperature. 25 µL of trypsin solution (2 mg of the bovine pancreas from Sigma life science/mL of trypsin buffer) and 25 µL of α-chymotrypsin solution (2 mg from bovine pancreas from Sigma life science/mL of trypsin buffer) were added to each sample. Following incubation for 16–18 h at 37 °C the mixture was boiled for 5 min and the insoluble material was removed by centrifugation. The supernatant was removed and dried in a vacuum centrifuge. Each sample was resuspended in 250 µL of 5% Acetic acid (AcOH) and passed through a C18 cartridge column (Sep-Pak Vac 1 cc, 100 mg Waters) to enrich the glycopeptides. The glycopeptides were eluted first with 3 column volumes of 20% Isopropanol in 5%AcOH, and then with 40% Isopropanol in 5%AcOH, 2 separate fractions were obtained and evaporated to dryness in the speed vac overnight. Dried glycopeptides of the 20% fraction were resuspended in 500 µL of 5% AcOH and mixed with the 40% fraction, this pooled sample was then dried on the speed vac. Dried glycopeptides were resuspended in 50 µL of 50 mM sodium phosphate buffer pH 7.5 and mixed with 0.5 µL of PNGaseF (Glyco Expression Technologies, Athens, GA). The digestion was allowed to incubate for 18 h at 37 °C. The sample was then dried in the speed vac for 1–2 h and resuspended in 300 µL of 5% AcOH. The released N-glycans were separated from peptides and enzymes using a Sep-Pak C-18 column. The N-glycans were eluted with 5% AcOH and lyophilized. Released oligosaccharides were permethylated to facilitate their analyses by mass spectrometry. The permethylation was performed according to the method published previously (Ciucanu and Kerek Citation1984).
Nanospray ionization-linear ion trap mass spectrometry (NSI-MS) analysis
Following the permethylation described above, samples were resuspended in 10 µL MeOH. 38 µL LTQ buffer (1 mM NaOH in 50% MeOH) and 2 µL Maltotetraose (Dp4) Standard mix (total 10 pmol) were added to each sample, mixed well, and spun down. 50 µL of the prepared sample was then directly infused into an Orbitrap discovery (LTQ-Orbitrap, ThermoFisher) with and nanospray interface (NSI-MSn). A flow rate of 0.60–0.80 µL/min and collision energy of 30–40% were used for fragmentation by collision-induced dissociation (CID). Full MS, MS/MS, and peak-picking spectra were obtained for quantification and structure assignation (Aoki et al. Citation2007). Peak-picking selects the most abundant parent ion from the full MS spectra for MS/MS fragmentation in the linear ion trap. This cycle is repeated for up to 200 rounds, in each new cycle, the previously selected parent ion is excluded to allow the next most intense parent ion from the full MS to be selected for MS/MS fragmentation.
Elucidation of N-glycan structures
Raw MS files obtained following NSI-MS analysis in peak-picker mode were supplied to Grits Toolbox 1.3.0 for semi-automated assignment of the glycan peaks (Ranzinger et al. Citation2015). GlycoWorkbench (Ceroni et al. Citation2008) was used as a support tool to identify fragmentation patterns diagnostic for specific structures. For quantification of glycan peaks, MS/MS spectra obtained after mass spectrometry were deconvoluted using Xtract (ThermoFisher) to combine charge states into a single peak and the resulting peak areas were referenced to an internal standard (Dp4 glucose at 2 pmol/µL) to calculate the absolute abundance (amount of glycan per mg of protein-rich powder) of each quantifiable glycan. Relative abundances were calculated by normalizing the signal intensity associated with each peak to the total signal intensity for all of the peaks in a given sample. Full MS, peak piker, and Xtract files are available in the GlycoPost repository (http://glycopost.glycosmos.org/), ID GPST000073 pin code: 8223.
Statistical analyses
One-way ANOVA and Tukey’s multiple comparisons test were performed in the data obtained following confocal microscopy using GraphPad Prism. Proportional quantification values of individual N-glycan structures were first log2 transformed. A Levene’s test was performed to assess the homogeneity of the quantification across treatments prior to the implementation of one-way ANOVA. Kruskal–Wallis test was used in cases where the Levene’s test suggested significant heterogeneity. p-Values below or equal to .05 were considered significant. Afterward, pairwise multiple comparisons (Tukey’s test) were used only for the significant structures to determine which IR levels are responsible for the ANOVA results. The tests described in this paragraph were based on the absolute quantification of N-glycan structures, by tissue group (Carcasses or Organs) separately using Rstudio version 1.3.1056 (RCoreTeam Citation2019). Finally, heat maps were generated using the logarithmic ratio values of the absolute quantification to calculate the Spherical distance matrix and complete linkage clustering.
Results
Fucosylation and sialylation is radioresponsive to environmentally significant levels of chronic IR exposure
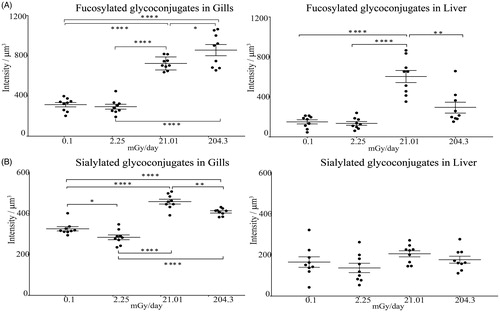
Lectin histochemical staining was used to detect changes in glycoconjugates bearing fucose and sialic acid in Medaka tissues after chronic exposure to LoDIR (). Gills and liver from 3 different fish, exposed to the 3 different levels of IR, and 3 un-exposed fish, were stained and imaged by confocal microscopy as described in the methods section. After plotting the average of the fluorescence intensity from the 3 fish, detection of fucosylated glycoconjugates by AAL was more intense at medium and high levels as compared to control (mean intensities of fluorescence were 723.9, 856.3, and 313.4/µm3 respectively) (). This increase in fucosylated glycoconjugates in gills was shown to happen in a dose-dependent manner, while in the liver no significant differences existed between control and a high dose of IR. The sialic acid-binding lectins revealed significant changes in medium and high doses of irradiation in gills, with the medium dose containing the highest amount of sialylated glycoconjugates compared with the control (mean intensities of fluorescence were 458.4, 408.1 325.4 intensity/um3 respectively), while no significant change was observed in the liver (). Supplementary File S2 presents the confocal images for each one of the analyzed Organs from the 3 fish.
Figure 3. Lectin-histochemical analysis by confocal microscopy in gills and liver from Medaka. Fluorescein coupled Aleuria aurantia lectin (AAL) was used for the detection of fucosylated glycoconjugates (A), while biotinylated Sambucus nigra lectin (SNA) and Maackia amurensis lectin II was used for the detection of sialylated glycoconjugates (B). Graphs represent the measure of fluorescence intensity/µm3 detected with the appropriate lectins in gills or livers of fish after chronic exposure at each one of the different levels of IR, mean ± SEM, n = 3 fish at each radiation dose. Asterisks indicate thresholds of the p-value after ANOVA and Tukey’s test: *p < .05; **p < .01; ***p < .001; ****p < .0001.
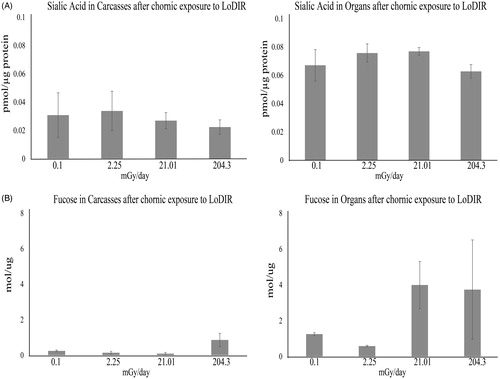
Using monosaccharide analysis we quantified sialic acid by HPLC after labeling with DMB () and fucose by GC as its alditol acetate (). In Carcasses, the quantity of fucose increased dramatically after high dose exposure (0.86 mol/µg compare to 0.25 mol/µg in control), similar to what was observed by lectin histochemistry in gills. Modest changes in the levels of sialic acid in Carcasses were detected and were inversely correlated with exposure. In Organs, the increase of fucose occurred at medium (3.99 mol/µg) and high (3.73 mol/µg) doses compared to control (1.2 mol/µg), in a manner similar to what was observed by lectin histochemistry in liver. In general, levels of sialic acid in the Organs (0.06–0.077 pmol/µg protein) were more abundant than in Carcasses (0.022–0.034 pmol/µg protein) and a slight increase was observed at low (0.075 pmol/µg protein) and medium (0.077 pmol/µg protein) doses compare to the control (0.067 pmol/µg protein), while at high doses the amount of sialic acid is similar to that detected in control samples. We then studied the N-glycome of Medaka after chronic exposure to analyze if these observed changes are linked to a particular type or set of N-glycans.
Figure 4. Quantification of sialic acid (A) and fucose (B) as monosaccharides after chronic exposure to low levels of IR in powder from Medaka carcasses and organs. Fucose was analyzed after alditol acetate derivatization by GC and Sialic acid after DMB labeling by HPLC. Total sialic acid is the sum of the quantity of Neu5Ac and Neu5Gc. The graphs show the results as the mean ± SD, n = 2 at each radiation dose.
Protein N-glycosylation features are radioresponsive to environmentally significant levels of chronic IR exposure
A total of 62 different N-glycan structures were identified across all the samples, with 16 common structures identified in both tissue groups. In Carcasses, a total of 37 N-glycan structures were identified and in Organs, a total of 41 structures were identified. presents the cartoon representation and arbitrary ID number corresponding to each structure, and Tables S1 and S2 of Supplementary File S3 present all the identified and quantified glycans. The individual N-glycans and the glycan types they represent are presented in . Changes in the abundance of individual glycans are plotted as log2 of the fold-difference at each of the exposure levels (low, medium, high) relative to control. For Carcasses, no major changes were observed for the complex structures that contain sialic acid or fucose and sialic acid (two last panels of the histograms). Although 8 individual glycans (labeled with ‘*’ in ) exhibited significant differences in abundance from the control after ANOVA and Tukey’s test, these differences do not trend with exposure level. For Organs, 26 structures (labeled with ‘*’ in ) exhibited significant differences in abundance from the control. Tables S5 and S6 in Supplementary File S3, provide the statistics for all the identified structures in carcasses and organs respectively. The changes in expression of individual glycans from organs were distributed across all the structural types with more structures affected by higher IR exposure ( panel C in light red). In both Carcasses and Organs, the most abundant types of glycans detected were complex structures with or without modification by fucose or sialic acid (Figure S2(C–F)). Supplementary Figure S2 presents representative mass spectra from Carcasses (A) and Organs (B), showing qualitatively similar profiles but different peak intensities between control and irradiated samples.
Figure 5. Abundance of N-glycan in Carcasses and Organs. Changes in the abundance of individual glycans are plotted on the Y-axis as log2 of the fold-difference at each of the exposure levels relative to control (irradiated samples/ control sample). (A) low dose: 2.25 mGy/day; (B) medium dose 21.01 mGy/day; (C) high dose 200 mGy/day). Numbers along the X-axis identify the indicated glycans, whose ID numbers and cartoon representations are in . Standard deviation of biological replicates (n = 3) is shown. Hybrid.Fuc: hybrid structure with fucose; Hybrid.Sia: hybrid structure with sialic acid; Hybrid.Fuc.Sia: hybrid structure with fucose and sialic acid; Complex: structure without the presence of fucose or sialic acid; Complex.Fuc: complex structure with fucose (core fucose and fucose on the antenna), Complex.Sia: complex structure with sialic acid; Complex.Fuc.Sia: complex structure with fucose and sialic acid. Light colors indicated N-glycans identified in Organs and dark colors in Carcasses. Asterisks indicate N-glycans with p-value <.05 after ANOVA and Tukey’s test.
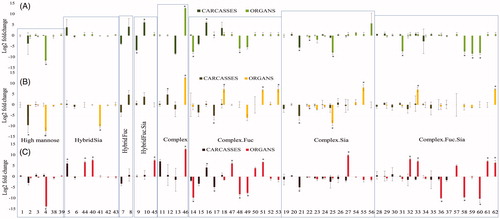
Table 1. Cartoon representation and ID number of the N-glycan structures identified in Carcasses and Organs after chronic exposure to low dose of IR.
In order to determine if a global response to radiation was present, we assessed the relative abundance of hybrid and complex N-glycan types, focusing on the presence of fucose, sialic acid, or both modifications (, Supplementary Tables S3 and S4 in Supplementary File S3). In Carcasses, hybrid structures from irradiated Carcasses showed the largest changes in the relative abundance of sialic acid or Fuc and Sia, although the changes were not correlated with IR dose (). The modification of complex glycans in Carcasses is characterized by a slight increase in the relative abundance of glycans carrying both Fuc and sialic acid (Fuc&Sia) () at all levels of IR exposure (+9.25, +7.52, and +4.29 pmol/mg in low, medium and high respectively compared to control), primarily at the expense of glycans modified only with sialic acid (−6.26, −10.39, and −12.26 pmol/mg in low, medium and high respectively compared to control). Also, non-modified structures (containing neither fucose nor sialic acid) were slightly increased at medium (+4.22 pmol/mg compared to control) and high (+8.29 pmol/mg compared to control) levels. We analyzed the position of the fucose modifying the N-glycan structures of both groups of tissues (Supplementary Figure S3). In Carcasses (Figure S3(A,B)), the addition of Fuc to the internal-most GlcNAc of the N-glycan structure (core fucosylation) increased in the irradiated samples with the highest levels of expression at low levels of IR.
Figure 6. Relative abundance of N-linked glycans in Medaka after chronic exposure to different levels of IR. The N-glycan decoration were classified based on the specific traits examined, such as fucosylation, sialylation or structures with both sugars (Fuc&Sia), in complex and hybrid structures. No decoration refers to structures without fucose or sialic acid, none. The relative abundance was calculated by adding all the proportional quantification of the structures corresponding to a particular type of N-glycan and then multiplying by 100.
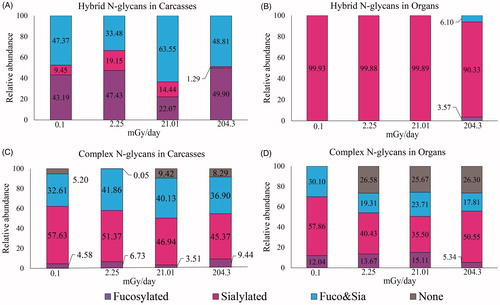
The hybrid glycan profile in Organs is almost exclusively sialylated without fucose at all IR doses, with a very slight increase in fucosylation at the highest IR dose (). The trend toward decreased modification with Fuc and Sia in complex glycans was even more pronounced, where all three doses of IR resulted in an increase in the relative abundance of glycans lacking Fuc or Sia (+26.58, +25.67, and +26.30 pmol/mg in low, medium and high respectively) (). In Organs, similar to our observations in Carcasses, most of the fucosylation is of the core type but decreased, rather than increased, in irradiated samples (Supplementary Figure S3(C,D)). The relative abundance of sialylated glycans in Organs was decreased at low (−17.43 pmol/mg), medium (−22.36 pmol/mg), and high (−7.31 pmol/mg) levels of IR, similar to Carcasses. At high doses, sialylated complex structures in Organs are higher than the other irradiated samples (+10.12 pmol/mg than low, and +15.05 pmol/mg than medium), but still lower than in control (bottom right panel in ). We observed small changes regarding antennal branching, with an increased number of antennas in irradiated samples, more evident in Organs than in Carcasses (Supplementary Figure S4).
Chronic IR exposure generates glycan structures of radio-responsiveness and dose-dependence
We employed hierarchical clustering, in an unbiased manner, to assess whether individual glycans or sets of glycans might serve as markers for radiation exposure, independent of whether they share structural or biosynthetic characteristics. The fold-difference in the abundance of each glycan in IR exposed individual samples was calculated relative to the average of the control samples (n = 3). For Carcasses and Organs, the IR exposed samples clustered together and apart from the controls ( and , respectively). This separation was more marked in Organs than Carcasses. For Organs, the three dose levels were also well-segregated, while in Carcasses the lowest dose was segregated from the two higher doses which were not completely resolved. Thus, the full portfolio of glycan abundance differences segregates irradiated samples from non-irradiated samples and separates dose levels.
Figure 7. Hierarchical clustering of N-glycans in Carcasses. The ratio of the relative glycan abundances detected in individual control (C) or irradiated (L, M, H) carcass samples to the average of the control sample set (n = 3) was calculated and used to cluster samples based on the similarity of the changes in the full population of glycans. L: 2.25 mGy/day, M: 21.01 mGy/day, and H: 204.3 mGy/day. The numbers in X-axis next to each letter indicate the biological replicate. Glycans whose changes in abundance were statistically significant (ANOVA and Tukey test) are shown in cartoon representations. Asterisks indicate thresholds of the p-value relative to the non-irradiated group: *p < .05; **p < .01; ***p < .001. Red triangles: fucose; yellow circles: galactose; green circles: mannose; blue squares: N-acetylglucosamine; pale blue diamonds: N-glycolylneuraminic acid (sialic acid); fuchsia diamonds: N-acetylneuraminic acid (sialic acid).
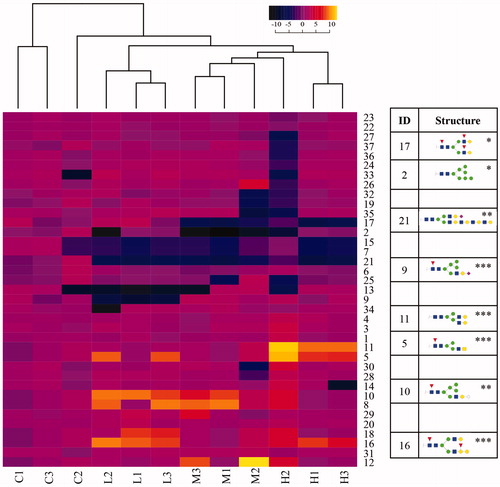
Figure 8. Hierarchical clustering of N-glycans in organs. The ratio of the relative glycan abundances detected in individual control (C) or irradiated (L, M, H) organ samples to the average of the control sample set (n = 3) was calculated and used to cluster samples based on the similarity of the changes in the full population of glycans. L: 2.25 mGy/day, M: 21.01 mGy/day, and H: 204.3 mGy/day. The numbers on X-axis next to each letter indicate the biological replicate. Glycans whose changes in abundance were statistically significant (ANOVA and Tukey test) are shown in cartoon representations. Asterisks indicate thresholds of the p-value relative to the non-irradiated group: *p < .05; **p < .01; ***p < .001. Red triangles: fucose; yellow circles: galactose; green circles: mannose; blue squares: N-acetylglucosamine; pale blue diamonds: N-glycolylneuraminic acid (sialic acid); fuchsia diamonds, N-acetylneuraminic acid (sialic acid).
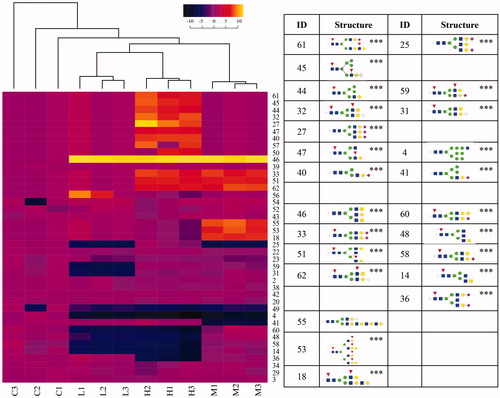
At the level of individual glycans, this analysis revealed striking markers of radiation exposure independent of dose, primarily in Organs. For instance, Glycan 46 was only detected in irradiated Organ samples, while Glycan 4 only was detected in control (non-irradiated) samples. In Carcasses, glycan 46 was not detected and glycan 4 did not exhibit changes in abundance, consistent with tissue-specific responses to chronic radiation. Similarly, glycan 21 was detected in Carcasses across all exposure doses but was not detected in Organs. Ensembles of glycans were able to drive dose-dependent clustering of samples. In Organs, for instance, the abundances of glycans 61, 45, 44, 32, 27, 47, 40 were increased in the high dose (p-value < .001), the abundances of glycans 33, 51, 62 were increased in the middle and high doses (p-value < .001), while the abundances of glycans 60, 48, 58, 14, 36 were decreased in low and high doses (p-value < .001). Increased abundances of glycans 55, 53, 18 stood out as unique markers of medium-dose IR (p < .001). The abundances of glycan ensembles in Carcasses were less discriminating than in Organs, especially in relation to dose.
A common feature observed across the glycans whose abundances were significantly changed was the presence of modifications with fucose and/or sialic acid. Significantly altered structures at high and medium radiation levels in Organs contain fucose and/or sialic acid, except for glycans 4 and 46. Ten structures that carry modifications with fucose, sialic acid, or both were unique in Organs (designated ∼ in ), of which seven structures belong to high doses (glycans 44, 45, 47, 50, 57, 32, and 61). The low dose had one unique structure (glycan 56), while two unique structures were detected in medium dose samples (glycans 53 and 55), and two structures in Organs (glycans 4 and 49) were repressed in all the irradiated samples.
In Organs, we saw structures with differences in only one monosaccharide that showed very distinctive responses to IR. For example, structure 49 is repressed in irradiated samples but structure 50 (containing an extra galactose compared to structure 49), is overexpressed following exposure to high levels of IR. Glycan 20 and 22 (having an extra Neu5Ac compared to glycan 20) showed no differences in expression across samples but glycan 23 (presence of Neu5Gc instead of Neu5Ac compared to the glycan 22) was underexpressed in irradiated samples. Lastly, glycan 33 wass overexpressed following exposure to medium and high levels of IR while glycan 34 (presence of Neu5Gc instead of Neu5Ac compared to glycans 33 and 36) presented no change, and glycan 36 (containing an extra GlcNAc compared to the glycans 33 and 34) was repressed at high levels of exposure. presents the graphical summary of changes associated with structures that differed by a single monosaccharide.
Table 2. Structures differing in one sugar with distinctive response to different levels of IR after chronic exposure.
Discussion
IR damages cells by breaking covalent bonds in DNA and generating free radicals that may alter macromolecules, such as proteins and lipids. However little is known about the direct or indirect impacts of IR on glycosylation. Our results demonstrate that environmentally relevant levels of IR cause alterations in the levels of both fucose and sialic acid, with a marked increase in fucose levels in a dose-dependent manner. These two sugars have been shown to impact cell function, tissue differentiation, and malignancy (Varki et al. Citation2015; Li et al. Citation2018), and an increase in fucose has been utilized as a biomarker for tumors (Ito et al. Citation2003; Kumar et al. Citation2015; Jia et al. Citation2018). A pilot study reported increases in fucosylation of complement factor H (CFAH) during the course of radiotherapy (Tóth et al. Citation2016), and an increase of fucosylation in CFAH has been reported as a biomarker in patients with liver disease and hepatocellular carcinoma (Benicky et al. Citation2014). Our study of gills and liver also shows an organ dependent change in fucosylated glycoconjugates, in gills and liver. For sialic acids, the highest changes of Neu5Ac in gills and liver (a fluoresce intensity/µm3 of 458.4 and 205.5 respectively) were observed at medium levels of IR (21.01 mGy/day) (). The relationships between sialylation and different intensities of exposure to radiation have been previously demonstrated. Overexpression of ST6Gal I in cells induced radiation resistance (Lee et al. Citation2008), and radioprotection (Punch et al. Citation2020). An increase in sialylation was shown to impact both cellular adhesion and migration in human colon cancer cells after radiation (3.81 Gy/min) (Lee et al. Citation2010). Organ dependent increases in sialylation due to IR exposure have been suggested previously due to the up-regulation of ß–galactoside α(2,6)-sialyltransferase (ST6Gal I) following 0.2 Gy whole-body irradiation (Lee et al. Citation2006). Aberrations in the expression of fucose and/or sialylation have been associated with several pathologies, the incorrect folding of proteins, and may serve as markers for certain cancers (Zhu et al. Citation2014; Zhang et al. Citation2018; Lee and Wang Citation2019).
To determine how these alterations in the levels of fucose and sialic acid are being realized at the glycan structural level, we chose to perform mass spectrometric analysis to generate profiles of the N-glycans following chronic exposure to different levels of IR. In this first application of tandem mass spectrometry for assessing the glycemic impact of whole-body chronic exposure to LoDIR we detected a significant increase in fucosylated structures and some variation in sialylated structures across two separate collections of organs, in agreement with previous observations. N-glycosylation acts as a checkpoint to avoid the accumulation of improperly folded proteins in the cell (Freeze et al. Citation2009) and alterations in protein glycan assembly are closely related with the congenital disorders of glycosylation (CDG) (Freeze and Schachter Citation2009; Ganetzky et al. Citation2017; Chang et al. Citation2018). Even relatively subtle changes between similar N-glycan structures, such as the addition or lack of a single monosaccharide, can impact protein functionality, stability, folding, protein–protein interaction, and cell–cell recognition causing disorders that may result in a variety of pathologies (Freeze and Schachter Citation2009). Earlier studies reporting alterations in fucose/sialic acid-related to radiation, along with our study, demonstrate the importance of documenting changes in glycosylation to deepen our understanding of the impacts of IR, as well as for providing candidates biomarkers for IR exposure.
Less than 20 papers related to the impacts of radiation on glycans, including sialylation or fucosylation, have been published in the past 15 years and most of these have been focused on how cosmic rays (preliminary study) (Szarka et al. Citation2018), radiotherapy, or acute exposure to high levels of IR affects glycosylation (Chaze et al. Citation2013; Jaillet et al. Citation2017) and subsequently radiation resistance (Lee et al. Citation2008). In other cases, the research has been focused on developing protocols to study these changes (Ma et al. Citation2013), analyzing a single organ, or analyzing a particular group of proteins such as plasma proteins (Ma et al. Citation2013; Tóth et al. Citation2016). To our knowledge, this is the first study analyzing the whole-body N-glycome after chronic exposure to environmentally relevant levels of IR.
The global N-glycan response for Carcasses and Organs after chronic exposure did not show a tendency toward over or under expression related to IR, similar to a previous report by Tóth et al. (Citation2016). In that study characteristic changes in N-glycans were linked to specific plasma proteins, but no clear correlation was found in the global N-glycome over the course of radiotherapy (51–72 Gy during 22–50 days with dose fraction of 1.8–3 Gy) (Tóth et al. Citation2016). We did not detect alterations in a particular type of structure as has been described previously in endothelial cells after exposure to IR, where a decrease in complex-type structures (those including fucose and sialylated structures) and glycosaminoglycans, and increases in high mannose structures were detected (Jaillet et al. Citation2017). N-glycome profiles across the different levels of IR exposure did not demonstrate considerable changes in the number of structures identified in our study. Rather, the most notable changes correspond to new structures expressed in irradiated samples or structures only detected in the control (these two sets of structures represent almost all of the significantly – p-value < .05 – affected structures based on statistical analyses). Contrary to what might be expected in terms of a global radiation dependent response, our results indicate that N-glycans are impacted at all doses studied but not in a dose-dependent manner. Multiantennary glycans increased while biantennary glycans decreased, especially in the samples with high doses of IR. This is similar to what was observed in serum samples from irradiated mice at 40 and 80 Gy, which represents high intensity, acute exposure (Chaze et al. Citation2013). In this earlier study, an increase in expression of genes involved in the synthesis of multiantennary structures was identified, but the authors were not able to correlate mRNA levels with the detected changes in biantennary structures. A second study, looking at the glycosylation of serotransferrin, reported that biantennary structures containing sialic acid decreased during radiotherapy, and 1 month after finishing the treatment, an abundance of these structures increased, but without reaching the original levels (Tóth et al. Citation2016). Glycan related changes that have been identified as markers of inflammation include an increase in the branching of glycan structures in serum proteins (Higai et al. Citation2005) as well as an increase in the levels of sialylation (De Graaf et al. Citation1993; Anthony and Ravetch Citation2010) and/or fucosylation (Thompson et al. Citation1989; Yokobori et al. Citation2019). Our results, showing an increase in the degree of branching, suggest that inflammation could be a part of the response to chronic exposure to low doses of IR.
The occurrence and variation in glycoprotein glycosylation, known as microheterogeneity, may also be impacted by chronic exposure to LoDIR and may underlie the glycomic changes that we are reporting. Microheterogeneity in N-glycan branching, the extent of terminal fucosylation and sialylation on plasma proteins (such as α1-acid glycoprotein and haptoglobin) can enhance or attenuate drug interactions (Wu et al. Citation2018). An in-depth analysis of glycoprotein glycosylation microheterogeneity could provide important clues to particular steps of the biosynthetic pathways that are especially sensitive to LoDIR.
Alterations in glycan expression can be a consequence of under- or over-expression of glycosyltransferases, as well as the availability/abundance of sugar nucleotide donors and cofactors (Pinho and Reis Citation2015) or ER/Golgi alterations. Impacts to glycosylation can in turn result in changes in the tertiary/quaternary conformation of proteins, affecting protein expression and function. This study did not reveal alterations at the glycan level that were lethal or significantly affected the vitality. Still, from this set of experiments it is unclear how or if these changes would impact offspring or, if following radiation exposure, the fish would develop cancer, cancer-related diseases, or present immunological disruptions.
As we described above, our results did not identify a trend in a particular type of structure as previous research has indicated. Rather, our results suggest that the effects due to chronic exposure to IR could be on a subset of proteins that have specific N-glycans linked to them instead of an alteration in the glycosylation process per se. For this reason, a concurrent proteomic study is ongoing, which will be vital for fully understanding the biological response to chronic exposure and for determining if any impacted proteins are related to the mechanism of fucosylation/sialylation. In this study, we analyzed enzymatically released N-glycans, which provides important information about the global N-glycosylation process but loses information about which proteins contain these glycans. Linking glycan changes with proteins are critical if these subtle changes belong to a limited set of proteins. Exploratory studies such as this one allow us to present profile baselines that act as a starting point for more focused research and also provide the development of protocols or strategies for those expanded studies. Finally, an understanding of how IR affects N-glycan and O-glycan pathways should be helpful in determining if glycans can be used as biomarkers for early detection of chronic, low exposure to IR. More studies in LoDIR are important to expand our understanding of organismal response and, more importantly, the exposure risk.
A2013-05-018_Animal_Care_and_Use_at_the_University_of_Georgia..pdf
Download PDF (521.6 KB)Supplementary_file_S3.xlsx
Download MS Excel (764.9 KB)Supplementary_File_S2.docx
Download MS Word (5 MB)Supplementary_File_S1.xlsx
Download MS Excel (21.3 KB)Supplementary_Figures.docx
Download MS Word (9.2 MB)Acknowledgments
We thank the LoDiF facility at the SREL for help to conduct the exposure for this experiment, Dr. Alvin Camus for his help to obtain the whole body paraffin slides, Dr. Melody Perlman Porterfield for her guidance on Grits, Dr. Donald Bernsteel and Ian Black for their technical support. The authors thank the students that assisted in the laboratory during this research: Emily Rester and Mercer Mahaffey for their valuable help.
Disclosure statement
This report was prepared as an account of work sponsored by an agency of the United States Government. Neither the United States Government nor any agency thereof, nor any of their employees, makes any warranty, express or implied, or assumes any legal liability or responsibility for the accuracy, completeness, or usefulness of any information, apparatus, product, or process disclosed or represents that its use would not infringe privately owned rights. Reference herein to any specific commercial product process, or service by trade name, trademark, manufacturer, or otherwise does not necessarily constitute or imply its endorsement, recommendation, or favoring by the United States Government or any agency thereof. The views and opinions of authors expressed herein do not necessarily state or reflect those of the United States Government or any agency thereof.
Additional information
Funding
Notes on contributors
Yeni Natalia C. Perez-Gelvez
Yeni Natalia C. Perez-Gelvez, Ph.D., is a Postdoctoral researcher at the Complex Carbohydrate Research Center at the University of Georgia, Athens, United States. She studies the effects of chronic exposure to low-dose of IR at the glycomic and proteomic level.
Shem Unger
Shem Unger, Ph.D., is an assistant professor of Biology at Wingate University, Wingate, United States. He completed a postdoctoral research position at the Savannah River Ecology Laboratory in Aiken, South Carolina, United States.
Simone Kurz
Simone Kurz, Ph.D., is the program manager Life Sciences at the Austrian Research Promotion Agency, Vienna, Austria. She completed a Postdoctoral Fellow position at the Complex Carbohydrate Research Center at the University of Georgia, Athens, United States.
Katelyn Rosenbalm
Katelyn Rosenbalm is a Ph.D candidate at the Complex Carbohydrate Research Center at the University of Georgia, Athens, United States. She studies the role of glycosylation in neuroinflammation in Alzheimer’s using mass spectrometry-based analytical methods.
William Matthew Wright
William Matthew Wright is an MS1 at the Mercer University School of Medicine, Macon, United States. He served as an Undergraduate Research Assistant at the Complex Carbohydrate Research Center, at the University of Georgia, Athens, United States.
Olin E. Rhodes
Olin E. Rhodes Jr., Ph.D., is the Director of the University of Georgia’s Savannah River Ecology Laboratory and a Georgia Athletic Association Professor of Applied Ecology in the Odum School of Ecology at the University of Georgia, Athens, United States.
Michael Tiemeyer
Michael Tiemeyer, Ph.D., is a distinguished research professor in the Biochemistry department at the University of Georgia and Co-director of the complex carbohydrate research center, Athens, United States. Currently focusing efforts to help in the COVID-19 research.
Carl W. Bergmann
Carl W. Bergmann, Ph.D., is the Associate Vice President for Research at University of Georgia, where he is responsible for UGA Core Research Laboratories and Research Facilities, and an Associate Director of the Complex Carbohydrate Research Center at the University of Georgia, Athens, United States.
References
- Anthony RM, Ravetch JV. 2010. A novel role for the IgG Fc glycan: the anti-inflammatory activity of sialylated IgG Fcs. J Clin Immunol. 30(1):S9–S14.
- Aoki K, Perlman M, Lim JM, Cantu R, Wells L, Tiemeyer M. 2007. Dynamic developmental elaboration of N-linked glycan complexity in the Drosophila melanogaster embryo [Research Support, N.I.H., Extramural Research Support, Non-U.S]. J Biol Chem. 282(12):9127–9142.
- Azzam EI, Jay-Gerin JP, Pain D. 2012. Ionizing radiation-induced metabolic oxidative stress and prolonged cell injury. Cancer Lett. 327(1–2):48–60.
- Badie C, Hess J, Zitzelsberger H, Kulka U. 2016. Established and emerging biomarkers of radiation exposure. Clin Oncol. 28(10):619–621.
- Baiocco G, Babini G, Barbieri S, Morini J, Friedland W, Villagrasa C, Rabus H, Ottolenghi A. 2019. What roles for track-structure and microdosimetry in the era of -omics and systems biology? Radiat Prot Dosimetry. 183(1–2):22–25.
- Barber R, Plumb MA, Boulton E, Roux I, Dubrova YE. 2002. Elevated mutation rates in the germ line of first- and second-generation offspring of irradiated male mice. Proc Natl Acad Sci USA. 99(10):6877–6882.
- Benicky J, Sanda M, Pompach P, Wu J, Goldman R. 2014. Quantification of fucosylated hemopexin and complement factor H in plasma of patients with liver disease. Anal Chem. 86(21):10716–10723.
- Bertucci EM, Mason MW, Camus AC, Rhodes OE, Parrott BB. 2020. Chronic low dose irradiation alters hepatic transcriptional profiles, but not global DNA methylation in Medaka (Oryzias latipes). Sci Total Environ. 729:138680.
- Ceroni A, Maass K, Geyer H, Geyer R, Dell A, Haslam SM. 2008. GlycoWorkbench: a tool for the computer-assisted annotation of mass spectra of glycans. J Proteome Res. 7(4):1650–1659.
- Chang IJ, He M, Lam CT. 2018. Congenital disorders of glycosylation. Ann Transl Med. 6(24):477.
- Chaze T, Slomianny M-C, Milliat F, Tarlet G, Lefebvre-Darroman T, Gourmelon P, Bey E, Benderitter M, Michalski J-C, Guipaud O. 2013. Alteration of the serum N-glycome of mice locally exposed to high doses of ionizing radiation. Mol Cell Proteomics. 12(2):283–301.
- Chinnannavar SN, Ashok L, Vidya KC, Setty SM, Narasimha GE, Garg R. 2015. Evaluation of serum sialic acid, fucose levels and their ratio in oral squamous cell carcinoma. J Int Soc Prevent Communit Dent. 5(6):446–450.
- Ciucanu I, Kerek F. 1984. A simple and rapid method for the permethylation of carbohydrates. Carbohydr Res. 131(2):209–217.
- De Graaf TW, Van der Stelt ME, Anbergen MG, van Dijk W. 1993. Inflammation-induced expression of sialyl Lewis X-containing glycan structures on alpha 1-acid glycoprotein (orosomucoid) in human sera. J Exp Med. 177(3):657–666.
- de Toledo SM, Azzam EI. 2006. Adaptive and bystander responses in human and rodent cell cultures exposed to low level ionizing radiation: the impact of linear energy transfer. Dose Response. 4(4):291–301.
- Desouky O, Ding N, Zhou G. 2015. Targeted and non-targeted effects of ionizing radiation. J Radiat Res Appl Sci. 8(2):247–254.
- Dubrova YE. 2003. Radiation-induced transgenerational instability. Oncogene. 22(45):7087–7093.
- Evans DH. 1987. The fish gill: site of action and model for toxic effects of environmental pollutants [Research Support, U.S. Gov’t, Non-P.H.S. Research Support, U.S. Gov’t, P.H.S. Review]. Environ Health Perspect. 71:47–58.
- Freeze HH, Esko JD, Parodi AJ, et al. 2009. Glycans in glycoprotein quality control. In: Varki A, Cummings RD, editors. Essentials of glycobiology. New York (NY): Cold Spring Harbor; p. 513.
- Freeze HH, Schachter H. 2009. Genetic disorders of glycosylation. In: Varki A, Cummings RD, editors. Essentials of glycobiology. New York (NY): Cold Spring Harbor; p. 567.
- Freeze HH, Vacquier VD, Esko JD. 2009. Deuterostomes. In: Varki A, Cummings RD, editors. Essentials of glycobiology. New York (NY): Cold Spring Harbor; p. 363.
- Ganetzky R, Reynoso FJ, He M. 2017. Congenital disorders of glycosylation. In: Garg U, Smith LD, editors. Biomarkers in inborn errors of metabolism. San Diego (CA): Elsevier; p. 343–360.
- Guipaud O, Benderitter M. 2009. Protein biomarkers for radiation exposure: towards a proteomic approach as a new investigation tool. Ann Ist Super Sanita. 45(3):278–286.
- Higai K, Aoki Y, Azuma Y, Matsumoto K. 2005. Glycosylation of site-specific glycans of alpha1-acid glycoprotein and alterations in acute and chronic inflammation [Research Support, Non-U.S]. Biochim Biophys Acta. 1725(1):128–135.
- Hinton TG, Coughlin DP, Yi Y, Marsh LC. 2004. Low Dose Rate Irradiation Facility: initial study on chronic exposures to Medaka. J Environ Radioact. 74(1–3):43–55.
- Horemans N, Spurgeon DJ, Lecomte-Pradines C, Saenen E, Bradshaw C, Oughton D, Rasnaca I, Kamstra JH, Adam-Guillermin C. 2019. Current evidence for a role of epigenetic mechanisms in response to ionizing radiation in an ecotoxicological context. Environ Pollut. 251:469–483.
- IAEA. 2006. Environmental consequences of the Chernobyl accident and their remediation: twenty years of experience. Vienna (Austria): International Atomic Energy Agency.
- Ito Y, Miyauchi A, Yoshida H, Uruno T, Nakano K, Takamura Y, Miya A, Kobayashi K, Yokozawa T, Matsuzuka F, et al. 2003. Expression of alpha1,6-fucosyltransferase (FUT8) in papillary carcinoma of the thyroid: its linkage to biological aggressiveness and anaplastic transformation. Cancer Lett. 200(2):167–172.
- Jaillet C, Morelle W, Slomianny MC, Paget V, Tarlet G, Buard V, Selbonne S, Caffin F, Rannou E, Martinez P, et al. 2017. Radiation-induced changes in the glycome of endothelial cells with functional consequences. Sci Rep. 7(1):5290.
- Jia L, Zhang J, Ma T, Guo Y, Yu Y, Cui J. 2018. The function of fucosylation progression of lung cancer. Front Oncol. 8:565.
- Joo HM, Kang SJ, Nam SY, Yang KH, Kim CS, Lee IK, Kim JY. 2015. The inhibitory effects of low-dose ionizing radiation in IgE-mediated allergic responses. PLoS One. 10(8):e0136394.
- Joo HM, Nam SY, Yang KH, Kim CS, Jin YW, Kim JY. 2012. The effects of low-dose ionizing radiation in the activated rat basophilic leukemia (RBL-2H3) mast cells. J Biol Chem. 287(33):27789–27795.
- Joseph LJ, Patwardhan UN, Samuel AM. 2004. Frequency of micronuclei in peripheral blood lymphocytes from subjects occupationally exposed to low levels of ionizing radiation. Mutat Res. 564(1):83–88.
- Karapiperis C, Chasapi A, Angelis L, Scouras ZG, Mastroberardino PG, Tapio S, Atkinson MJ, Ouzounis CA. 2020. The coming of age for big data in systems radiobiology, an engineering perspective. Big Data. doi:10.1089/big.2019.0144
- Kumar S, Saxena M, Srinivas K, Singh VK. 2015. Fucose: a biomarker in grading of oral cancer. Natl J Maxillofac Surg. 6(2):176–179.
- Lee M, Lee HJ, Bae S, Lee YS. 2008. Protein sialylation by sialyltransferase involves radiation resistance. Mol Cancer Res. 6(8):1316–1325.
- Lee M, Lee H-J, Seo WD, Park KH, Lee Y-S. 2010. Sialylation of Integrin beta1 is involved in radiation-induced adhesion and migration in human colon cancer cells . Int J Radiat Oncol Biol Phys. 76(5):1528–1536.
- Lee WJ, Majumder ZR, Jeoung DI, Lee HJ, Kim SH, Bae S, Lee YS. 2006. Organ-specific gene expressions in C57BL/6 mice after exposure to low-dose radiation. Radiat Res. 165(5):562–569.
- Lee WL, Wang PH. 2019. Aberrant sialylation of immune cells in rheumatoid arthritis. J Chin Med Assoc. 82(5):341–342.
- Li J, Hsu HC, Mountz JD, Allen JG. 2018. Unmasking fucosylation: from cell adhesion to immune system regulation and diseases. Cell Chem Biol. 25(5):499–512.
- Lin CY, Chiang CY, Tsai HJ. 2016. Zebrafish and Medaka: new model organisms for modern biomedical research. J Biomed Sci. 23:19.
- Locke J, Karimpour S, Young G, Lockett MA, Perez CA. 2001. Radiotherapy for epithelial skin cancer. Int J Radiat Oncol Biol Phys. 51(3):748–755.
- Lusiyanti Y, Syaifudin M, Budiantari T, Purnami S, Ramadhani D. 2019. Development of dose-response calibration curve for dicentric chromosome induced by X-rays. Genome Integr. 10:2.
- M KP, Shyama SK, D’Costa A, Kadam SB, Sonaye BH, Chaubey RC. 2017. Evaluation of DNA damage induced by gamma radiation in gill and muscle tissues of Cyprinus carpio and their relative sensitivity. Ecotoxicol Environ Saf. 144:166–170.
- Ma J, Han D, Zhang M, Chen C, Zhang B, Zhang Z, Wang X, Yang S, Guo Y, Okunieff P, et al. 2013. Alteration of plasma galactose/N-acetylgalactosamine level after irradiation. Adv Exp Med Biol. 765:147–153.
- Mahaney BL, Meek K, Lees-Miller SP. 2009. Repair of ionizing radiation-induced DNA double-strand breaks by non-homologous end-joining. Biochem J. 417(3):639–650.
- Marchetti F, Coleman MA, Jones IM, Wyrobek AJ. 2006. Candidate protein biodosimeters of human exposure to ionizing radiation. Int J Radiat Biol. 82(9):605–639.
- Morgan WF, Bair WJ. 2013. Issues in low dose radiation biology: the controversy continues. A perspective. Radiat Res. 179(5):501–510.
- Morgan WF, Sowa MB. 2007. Non-targeted bystander effects induced by ionizing radiation. Mutat Res. 616(1–2):159–164.
- Murata Y, Yasuda T, Watanabe-Asaka T, Oda S, Mantoku A, Takeyama K, Chatani M, Kudo A, Uchida S, Suzuki H, et al. 2015. Histological and transcriptomic analysis of adult Japanese Medaka sampled onboard the international space station. PLoS One. 10(10):e0138799.
- Nakata D, Troy FA. 2nd. 2005. Degree of polymerization (DP) of polysialic acid (polySia) on neural cell adhesion molecules (N-CAMS): development and application of a new strategy to accurately determine the DP of polySia chains on N-CAMS. J Biol Chem. 280(46):38305–38316.
- Pena MJ, Tuomivaara ST, Urbanowicz BR, O’Neill MA, York WS. 2012. Methods for structural characterization of the products of cellulose- and xyloglucan-hydrolyzing enzymes. Methods Enzymol. 510:121–139.
- Perez-Gelvez Y, Unger S, Gutierrez-Sanchez G, Bridger R, Rhodes OE, Jr., Bergmann C. 2019. An effective protocol for proteome analysis of Medaka (Oryzias latipes) after acute exposure to ionizing radiation. Methods Protoc. 2(3):66.
- Perumal V, Gnana Sekaran TS, Raavi V, Basheerudeen SA, Kanagaraj K, Chowdhury AR, Paul SF. 2015. Radiation signature on exposed cells: relevance in dose estimation. World J Radiol. 7(9):266–278.
- Pinho SS, Reis CA. 2015. Glycosylation in cancer: mechanisms and clinical implications. Nat Rev Cancer. 15(9):540–555.
- Punch PR, Irons EE, Manhardt CT, Marathe H, Lau JTY. 2020. The sialyltransferase ST6GAL1 protects against radiation-induced gastrointestinal damage. Glycobiology. 30(7):446–453.
- Rana S, Kumar R, Sultana S, Sharma RK. 2010. Radiation-induced biomarkers for the detection and assessment of absorbed radiation doses. J Pharm Bioallied Sci. 2(3):189–196.
- Ranzinger R, Weatherly D, Arpinar S, Khan S, Porterfield M, Tiemeyer M, York W. 2015. GRITS Toolbox - A software system for the archival, processing and interpretation of glycomics data. North Carolina, (NC): Oxford Univ Press Inc., pp. 1275–1275.
- RCoreTeam. 2019. A language and environment for statistical computing. Vienna, Austria: R Foundation for Statistical Computing. URL https://www.R-project.org/
- Saha GB. 2012. Physics and radiobiology of nuclear medicine. New York (NY); London (UK): Springer; p. 2012.
- Shima A, Mitani H. 2004. Medaka as a research organism: past, present and future. Mech Dev. 121(7–8):599–604.
- Smith RW, Mothersill C, Hinton T, Seymour CB. 2011. Exposure to low level chronic radiation leads to adaptation to a subsequent acute X-ray dose and communication of modified acute X-ray induced bystander signals in Medaka (Japanese rice fish, Oryzias latipes). Int J Radiat Biol. 87(10):1011–1022.
- Spiro RG. 2002. Protein glycosylation: nature, distribution, enzymatic formation, and disease implications of glycopeptide bonds [Research Support, U.S. Gov’t, P.H.S. Review]. Glycobiology. 12(4):43R–56R.
- Spitz DR, Hauer-Jensen M. 2014. Ionizing radiation-induced responses: where free radical chemistry meets redox biology and medicine. Antioxid Redox Signal. 20(9):1407–1409.
- Stanley P, Schachter H, Taniguchi N, 2009. N-glycans. In: Varki A, Cummings RD, editors. Essentials of glycobiology. New York (NY): Cold Spring Harbor; p. 101.
- Szarka M, Szilasi S, Donczo B, Sarkozy D, Rajta I, Guttman A. 2018. The effect of simulated space radiation on the N-glycosylation of human immunoglobulin G1. Electrophoresis. 39(22):2872–2876.
- Thompson S, Kelly CA, Griffiths ID, Turner GA. 1989. Abnormally-fucosylated serum haptoglobins in patients with inflammatory joint disease [Comparative Study Research Support, Non-U.S. Gov’t]. Clinica Chimica Acta; Int J Clin Chem. 184(3):251–258.
- Tóth E, Vékey K, Ozohanics O, Jekő A, Dominczyk I, Widlak P, Drahos L. 2016. Changes of protein glycosylation in the course of radiotherapy. J Pharm Biomed Anal. 118:380–386.
- Turner GA, Skillen AW, Buamah P, Guthrie D, Welsh J, Harrison J, Kowalski A. 1985. Relation between raised concentrations of fucose, sialic acid, and acute phase proteins in serum from patients with cancer: choosing suitable serum glycoprotein markers. J Clin Pathol. 38(5):588–592.
- Varki A, Schnaar Rl, Schauer R. 2015. Sialic acids and other nonulosonic acids. In: Varki A, Cummings RD, editors. Essentials of glycobiology. New York (NY): Cold Spring Harbor; p. 179–195.
- Waldren CA. 2004. Classical radiation biology dogma, bystander effects and paradigm shifts. Hum Exp Toxicol. 23(2):95–100.
- Wolf JC, Baumgartner WA, Blazer VS, Camus AC, Engelhardt JA, Fournie JW, Frasca S, Jr., Groman DB, Kent ML, Khoo LH, et al. 2015. Nonlesions, misdiagnoses, missed diagnoses, and other interpretive challenges in fish histopathology studies: a guide for investigators, authors, reviewers, and readers. Toxicol Pathol. 43(3):297–325.
- Wolf JC, Wolfe MJ. 2005. A brief overview of nonneoplastic hepatic toxicity in fish [Review. Toxicol Pathol. 33(1):75–85.
- Wolff S. 1998. The adaptive response in radiobiology: evolving insights and implications. Environ Health Perspect. 106(1):277–283.
- Wu D, Struwe WB, Harvey DJ, Ferguson MAJ, Robinson CV. 2018. N-glycan microheterogeneity regulates interactions of plasma proteins [Research Support, Non-U.S. Gov’t]. Proc Natl Acad Sci USA. 115(35):8763–8768.
- Yokobori T, Yazawa S, Asao T, Nakazawa N, Mogi A, Sano R, Kuwano H, Kaira K, Shirabe K. 2019. Fucosylated α1-acid glycoprotein as a biomarker to predict prognosis following tumor immunotherapy of patients with lung cancer . Sci Rep. 9(1):14503.
- Zhang Z, Wuhrer M, Holst S. 2018. Serum sialylation changes in cancer. Glycoconj J. 35(2):139–160.
- Zhu J, Wang Y, Yu Y, Wang Z, Zhu T, Xu X, Liu H, Hawke D, Zhou D, Li Y. 2014. Aberrant fucosylation of glycosphingolipids in human hepatocellular carcinoma tissues. Liver Int. 34(1):147–160.