
Abstract
Purpose
For triage purposes following a nuclear accident or a terrorist event, gene expression biomarkers in blood have been demonstrated to be good bioindicators of ionizing radiation (IR) exposure and can be used to assess the dose received by exposed individuals. Many IR-sensitive genes are regulated by the DNA damage response pathway, and modulators of this pathway could potentially affect their expression level and therefore alter accurate dose estimations. In the present study, we addressed the potential influence of temperature, sample transport conditions and the blood cell fraction analyzed on the transcriptional response of the following radiation-responsive genes: FDXR, CCNG1, MDM2, PHPT1, APOBEC3H, DDB2, SESN1, P21, PUMA, and GADD45.
Materials and Methods
Whole blood from healthy donors was exposed to a 2 Gy X-ray dose with a dose rate of 0.5 Gy/min (output 13 mA, 250 kV peak, 0.2 mA) and incubated for 24 h at either 37, 22, or 4 °C. For mimicking the effect of transport conditions at different temperatures, samples incubated at 37 °C for 24 h were kept at 37, 22 or 4 °C for another 24 h. Comparisons of biomarker responses to IR between white blood cells (WBCs), peripheral blood mononuclear cells (PBMCs) and whole blood were carried out after a 2 Gy X-ray exposure and incubation at 37 °C for 24 hours.
Results
Hypothermic conditions (22 or 4 °C) following irradiation drastically inhibited transcriptional responses to IR exposure. However, sample shipment at different temperatures did not affect gene expression level except for SESN1. The transcriptional response to IR of specific genes depended on the cell fraction used, apart from FDXR, CCNG1, and SESN1.
Conclusion
In conclusion, temperature during the incubation period and cell fraction but not the storing conditions during transport can influence the transcriptional response of specific genes. However, FDXR and CCNG1 showed a consistent response under all the different conditions tested demonstrating their reliability as individual biological dosimetry biomarkers.
Introduction
In recent years, radiation exposure from terrorist events or nuclear accidents has become a recognized threat to public health (Sproull et al. Citation2017). High throughput and fast screening methods to detect radiation exposure are key to improve emergency responses. Conventional methods to assess exposure such as the evaluation of dicentric chromosomes or micronuclei provide reliable data (Rothkamm et al. Citation2013) although they are not optimal for usage in the case of large scale radiation events due to low sample throughput and time requirement of several days to provide dose estimates.
Exposure to IR causes genotoxic lesions which leads to the transcription of genes involved in cell death, DNA repair, cell cycle arrest and autophagy (Amundson et al. Citation2000; Badie et al. Citation2000); genes involved in these pathways have shown good linear dose-response relationships up to certain doses providing accurate dose estimates (Kabacik, Mackay, et al. Citation2011; Manning et al. Citation2013; Lacombe et al. Citation2018; O’Brien et al. Citation2018). During the last 10 years, gene expression analysis has been explored as a potential tool for faster results at larger scales (Pernot et al. Citation2012; Hall et al. Citation2017). Gene expression biomarkers have also demonstrated to be good bioindicators of radiation exposure alone (Kabacik, Mackay, et al. Citation2011; Budworth et al. Citation2012; Manning et al. Citation2013; Badie et al. Citation2016; Cruz-Garcia et al. Citation2018) or for multiparametric comparisons (Tichy et al. Citation2018).
All these studies have identified sets of responsive genes in human PBMCs, whole blood or WBC (Kabacik, Mackay, et al. Citation2011; Manning et al. Citation2013; Beer et al. Citation2014; Chauhan and Howland Citation2014; Li et al. Citation2017). Some being cross validated in vivo in other species (Port et al. Citation2018). Among these genes, FDXR (Ferredoxin Reductase) stands out as the most accurate gene identified so far for providing accurate dose estimates not only in vitro but also in vivo with validation in radiotherapy patients’ blood samples presenting high fold changes of expression after radiation exposure and low expression in non-irradiated samples (O’Brien et al. Citation2018). Moreover, alternative FDXR transcripts in human blood have a great potential as biomarkers of expression as they are not detectable in non-exposed samples (Cruz-Garcia, O’Brien, Sipos, Mayes, Tichý, et al. Citation2020).
Hence, in recent years, the use of gene expression for the purpose of biological dosimetry has been illustrated through exercises (Badie et al. Citation2013; Abend et al. Citation2016; Manning et al. Citation2017). Gene expression is now recognized and integrated in dosimetry methods for emergency response (Ainsbury et al. Citation2017; Kulka et al. Citation2017). Recently, a new protocol was validated, allowing reliable dose estimates from blood samples in less than 4 hours (Polozov et al. Citation2019). We have also reported that transcript variants of the gene FDXR represent very promising biomarkers of radiation exposure due to their lack of expression in non-exposed blood samples (Cruz-Garcia, O’Brien, Sipos, Mayes, Tichý, et al. Citation2020).
To further assess the robustness of these biomarkers in more challenging conditions closer to ‘on the field’ conditions, the role of potential confounding factors has been addressed to determine the potential influence on their response. The role of several confounding factors such as smoking or inflammation have been already studied (Tucker Citation2008; Cruz-Garcia et al. Citation2018), but the potential influence of others still has to be addressed.
The present study aimed to analyze several parameters that can influence gene expression biomarkers of radiation (X-ray) exposure in human blood namely temperature, temperature conditions during shipment of samples to laboratories and blood derived cell fractions. These experiments aimed to help to further characterize these transcriptional biomarkers providing new insights of their radiation responsiveness and suitability for triage purposes.
Materials and methods
Blood samples
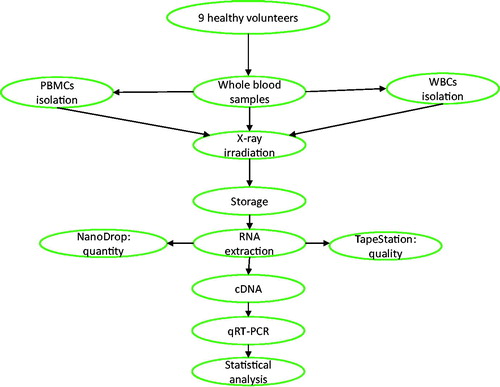
Venous blood from 9 healthy donors (6 men and 3 women between 25 and 54 years old) was taken at the Center for Radiation, Chemical & Environmental Hazards, Public Health England (Chilton, UK) with informed consent and the ethical approval of the West Midlands – Solihull Research Ethics Committee (REC 14/WM/1182) for these experiments. Whole blood samples were aliquoted in 2 ml tubes (500ul per tube) and white blood cells (WBCs) and/or peripheral blood mononuclear cells (PBMCs) were isolated as described below and in .
Figure 1. Schematic representation of the experimental process. Peripheral blood samples from 9 healthy donors including 6 men and 3 women between 25 and 54 years old were collected to complete the 3 experiments presented (each experiment n = 3). For some experiments, PBMCs and WBCs were isolated, and the treated samples were subjected to irradiation of 2 Gy of X-rays. The irradiated samples and their controls were stored at 24 or 48 hours, depending on the experiments. Subsequently, RNA is extracted and used for analysis of gene expression through QRT-PCR. RNA quantity was assessed using Nanodrop and quality by RIN values produced by Tapestation. To compare the irradiated and non-irradiated samples, statistical analysis of the data was performed by using paired t-test with a significance of p≤.05. One-way ANOVA followed by Tukey's test was performed to compare groups of irradiated samples.
PBMCs isolation
PBMCs were isolated using a density gradient centrifugation of peripheral whole blood using Lymphoprep (STEMCELL Technologies, UK). Briefly, blood was diluted with Dulbecco's phosphate-buffered saline (DPBS) (1 volume of DPBs for 1 volume of whole blood) and layered on top of the Lymphoprep solution (15 ml of Lymphoprep for 10 ml of diluted blood). After a centrifugation at 800 × g at 22 °C for 20 minutes, the cloudy PBMC layer between a top layer of plasma and a bottom layer of polymorphonuclear cells was collected and transferred to a new tube to proceed with DPBS washes (300 × g at room temperature for 10 minutes). After the isolation, PBMCs were maintained in LGM-3 culture medium (Lonza, Slough, UK) in T25 flasks at 2 × 10⁶ cells/ml for 24 h at 37 °C in a humidified 5% CO2 atmosphere ().
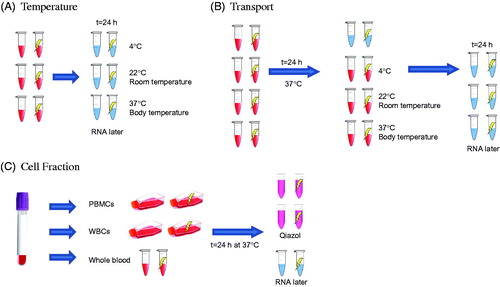
Figure 2. Schematic representation of the three experimental setups. (A) Temperature experiment: whole blood samples were incubated at 3 different temperatures (37, 22, and 4 °C) for 24 h after 2 Gy x-ray (0.5 Gy/min) exposure. (B) Transport experiment: whole blood samples were exposed (2 Gy x-ray, 0.5 Gy/min) and incubated at 37 °C for 24 h. After this incubation, samples were kept at 3 different temperatures (37, 22, and 4 °C) to simulate different transport temperatures. One condition was stopped at 24 h and the rest of the conditions at 48 h after exposure. (C) Blood cell types experiment: whole blood, WBCs and PBMCs were prepared from the blood of each donor. The 3 types of samples were exposed at 2 Gy x-ray (0.5 Gy/min) and incubated at 37 °C for 24 h. After the incubation period, WBCs and PBMCs were stored in 700 µl of Qiazol buffer from the Rneasy kit (Qiagen, UK) and the whole blood was stored with 1 ml of RNAlater.
WBCs isolation
WBCs were isolated from peripheral whole blood using an erythrocyte aggregation agent, Hetasep (STEMCELL Technologies, UK). Briefly, whole blood was mixed with Hetasep buffer (1 volume of Hetasep for 5 volumes of blood) and centrifuged at 90 g at room temperature for 2 minutes. After 10 minutes incubation at room temperature, the upper phase was collected and washed with DPBS. Ammonium-Chloride-Potassium lysis buffer (ACK) was used to remove remaining erythrocytes in the WBC pellet. After washing the ACK buffer, the cells were resuspended in DPBS and the platelets were removed by centrifuging the samples at 125 g for 10 min. WBCs were kept in LGM-3 culture medium in T25 flasks at 2 × 10⁶ cells/ml for 24 h at 37 °C in a humidified 5% CO2 atmosphere ().
Ex vivo irradiation
Whole blood, PBMCs and WBCs were exposed to 2 Gy of x-rays at room temperature (22 °C) in air on top of a Perspex platform, with a dose rate of 0.5 Gy/min, using self-contained 250 kVp X-ray unit (CD160/1, AGO X-Ray Ltd., Aldermaston, Reading RG7 4PW, UK) with aluminum and copper filtration (∼1 mm) containing a Varian NDI-320 source (output 13 mA, 250 kV peak, 0.2 mA). Dosimetry was performed with a calibrated reference ionization chamber for the exact exposure setup used. Exposures were always monitored using a calibrated UNIDOS E electrometer and ‘in-beam’ monitor ionization chamber (all from PTW, Germany) located at source. Correction factors are used to calculate exact dose. Spatial dose uniformity was checked using Gafchromic EBT2 films (Vertec Scientific Ltd., UK) to ensure a homogenous dose was delivered. Once irradiated, the samples were incubated at 37 °C with 5% CO2, 4 °C or left at room temperature (22 °C). Following incubation, whole blood was mixed with 1 ml of RNA later Stabilization Solution; PBMCs and WBCs were mixed with 700 µl of QIAzol Lysis Reagent (miRNeasy kit, Qiagen Ltd, Crawley, UK) and stored at −80 °C ().
RNA extraction and reverse transcription
The RiboPure™-Blood RNA Purification Kit (Thermo Fisher Scientific, Loughborough, UK) was used to extract RNA from blood samples and the miRNeasy Mini Kit (Qiagen Ltd, Crawley, UK) to isolate RNA from blood cells, according to the manufacturer's' instructions. The quantity of isolated RNA was subsequently determined by spectrophotometry using a ND-1000 NanoDrop (Thermo Fisher Scientific, 168 3rd Av., Waltham, MA 02451 USA) and quality was assessed using a Tapestation 2200 (Agilent Technologies, CA, USA). The experiments performed in this study had specific controls for each sample type (either whole blood, WBCs or PBMCs), and the results were compared to each sample type. Differences which might have been introduced by the RNA extraction kit do not affect the results since controls and treated samples had the same sample processing.
The High-Capacity cDNA reverse transcription kit (Applied Biosystems, Foster City, CA, USA) was used to prepare cDNA from 800 or 300 ng of total RNA according to the manufacturer’s protocol.
Quantitative real-time polymerase chain reaction
A Rotor-Gene Q (Qiagen, Hilden, Germany) with PerfeCTa MultiPlex qPCR SuperMix (Quanta Bioscience, Inc., Gaithersburg, MD, USA) was used to perform the QRT-PCR. The samples were run in triplicates in 10 µl reactions with 1 µl of the cDNA synthesis reaction together with seven different sets of primers and fluorescent probes at 500 nM concentration each. 3′6-Carboxyfluorescein (FAM), 6-Hexachlorofluorescein (HEX), Texas red (TEX), CY5, Atto 680, Atto 390 (Eurogentec Ltd., Fawley, Hampshire, UK) were used as fluorochrome reporters for the probes analyzed in multiplexed reactions with different genes per run.
Primer sequences:
HPRT1 F: 5′-TCAGGCAGTATAATCCAAAGATGGT-3′, R: 5′-AGTCTGGCTTATATCCAACACTTCG-3′, probe: 5′-CGCAAGCTTGCTGGTGAAAAGGACCC-3′;
CCNG1 F: 5′-GGAGCTGCAGTCTCTGTCAAG-3′, R: 5′-TGACATCTAGACTCCTGTTCCAA-3′, probe: 5′-AACTGCTACACCAGCTGAATGCCC-3′;
PHPT1 F: 5′-TCGCTCTCATTCCTGATGTG-3′, R: 5′-TCGTAGATGTCCGCATGGTA-3′, probe: 5′-CTTGTAGCCGCGCACGATCTCCTT-3′
FDXR F: 5′-GTACAACGGGCTTCCTGAGA-3′, R: 5′-CTCAGGTGGGGTCAGTAGGA-3′, probe: 5′-CGGGCCACGTCCAGAGCCA-3′
APOBEC3H F: 5′-AGTCTGCTAAGGAAGCTGTG-3′, R: 5′-GCGGCGCTTGTTGTTAAA-3′, probe: 5′-AGCACAGATCAGAAACACGATGGCT-3′
GADD45 F: 5′-CTGCGAGAACGACATCAAC-3′, R: 5′-AGCGTCGGTCTCCAAGAG-3′, probe: 5′-ATCCTGCGCGTCAGCAACCCG-3′
DDB2 F: 5′-GTCACTTCCAGCACCTCACA-3′, R: ACGTCGATCGTCCTCAATTC-3′, probe: 5′-AGCCTGGCATCCTCGCTACAACC-3′
MDM2: 5′-CCATGATCTACAGGAACTTGGTAGTA-3′, R: ACACCTGTTCTCACTCACAGATG-3′, probe: 5′-CAATCAGCAGGAATCATCGGACTCAG-3′
SESN1: 5′-GCTGTCTTGTGCATTACTTGTG-3′, R: CTGCGCAGCAGTCTACAG-3′, probe: 5′-ACATGTCCCACAACTTTGGTGCTGG-3′
P21: 5′-GCAGACCAGCATGACAG-3′, R: TAGGGCTTCCTCTTGGA-3′, probe: 5′-TTTCTACCACTCCAAACGCCGGCT-3′
PUMA: 5′-CGGAGACAAGAGGAGCAG-3′, R: GGAGTCCCATGATGAGATTG-3′, probe: 5′-CCCTCACCCTGGAGGGTCCTGT-3′
During all our experiments, the reactions were performed with the same cycling conditions: 2 min at 95 °C followed by 45 cycles of 10 s at 95 °C and then 60 s at 60 °C. Data were collected. and analyzed using Rotor-Gene Q Series software. Hypoxanthine phosphoribosyltransferase 1 (HPRT1) internal control was used to normalize the gene target Ct (cycle threshold) values. For each gene, standard curves obtained from a serial dilution of PCR-amplified DNA fragments were used to convert Ct values to transcript quantity.
Statistical analysis
Minitab software was used to perform the statistical analyses. Data are presented as mean ± standard deviation (SD) and comparisons were analyzed by t test (Student's t test). When multiple comparisons are needed, one-way ANOVA followed by Tukey's tests was applied. For all statistical tests performed, a significance p≤.05 was applied.
Results
Effect of temperature on transcriptional regulation after radiation exposure
The impact of incubation temperature of blood samples after irradiation on gene expression was assessed with 3 temperatures ranging from ‘body’ temperature 37 °C, ‘room’ temperature 22 °C and ‘refrigerator’ 4 °C. For this aim, blood from each donor was aliquoted and 3 non-irradiated and irradiated blood samples (exposed to a single 2 Gy X-ray dose) were kept for 24 hours after irradiation at one of these 3 different temperatures ().
The level of expression of the following radiation-responsive genes FDXR, CCNG1, MDM2, PHPT1, APOBEC3H, DDB2, SESN1, P21, PUMA and GADD45 was monitored at 24 h post-exposure (). For most genes, the transcriptional response of the biomarkers is significant only when the samples were kept at 37 °C. However, perhaps surprisingly, P21, GADD45 and SESN1, there was a slightly transcriptional upregulation after radiation exposure in samples kept at room temperature.
Figure 3. Transcriptional response of 10 biomarkers to ionizing radiation in human blood after 24 h incubation at 4 °C, room temperature (22 °C) and 37 °C after exposure. Blood from healthy volunteers (n = 3) was exposed to a single 2 Gy X-ray dose (0.5 Gy/min). The data are presented as mean values ± standard deviation (SD). Statistical analyses were performed in log-transformed data. The presence of an asterisk (*) indicates a significant difference (paired T test, p≤.05) with each control group. IR: ionizing radiation; RT: room temperature.
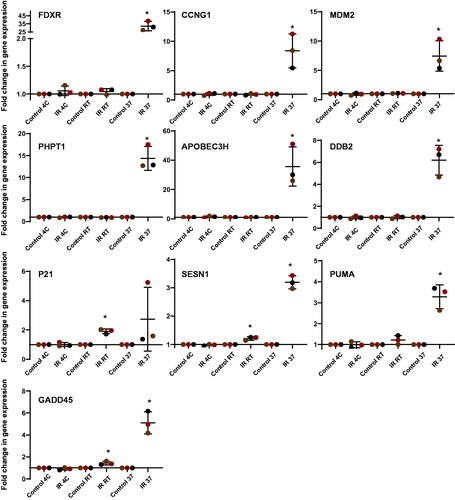
As previously established, FDXR and APOBEC3H presented the highest transcriptional responses at 37 °C (32.2 and 35.7 mean fold change respectively), although the latter showed higher inter-individual variability. The lowest responses to IR were observed in SESN1 and PUMA with respectively 3.19 and 3.28 mean fold of changes. Additionally, P21 did not present a significant upregulation unexpectedly, due to the high variability of responses between donors.
Effect of sample transport temperature on transcriptional regulation after radiation exposure
Simulations of changes on sample transport temperature were performed to assess the potential impact on transcriptional gene expression and ultimately dose estimation. We considered a situation where the blood would be obtained from individuals 24 hours after exposure to IR and allowing 24 hours to reach the laboratory. We compared 3 different transport temperature conditions similar to a shipment at 37 °C, room temperature (20 °C) or 4 °C ().
The gene expression profile of FDXR, CCNG1, MDM2, PHPT1, APOBEC3H, DDB2, SESN1, P21, PUMA, and GADD45 was monitored at 48 h post-exposure ().
Figure 4. Transcriptional response of 10 biomarkers to ionizing radiation in human blood after 24 h incubation at 37 °C followed by 24 h at 4 °C, room temperature (RT 22 °C) and 37 °C after exposure to simulate possible conditions of sample transport. Blood from healthy volunteers (n = 3) was exposed to a single 2 Gy X-ray dose (0.5 Gy/min). The data are presented as mean values ± standard deviation (SD). Statistical analyses were performed in log-transformed data. The presence of an asterisk (*) indicates a significant difference (paired T test, p ≤ 0.05) with each control group. One-way ANOVA followed by Tukey's test was performed to compare the radiation response between 24 h, 48 h, RT and 4 °C (compared the IR only). Values not sharing a common letter are significantly different and figures not presenting any letters indicate no significant differences. IR: ionizing radiation; RT: room temperature.
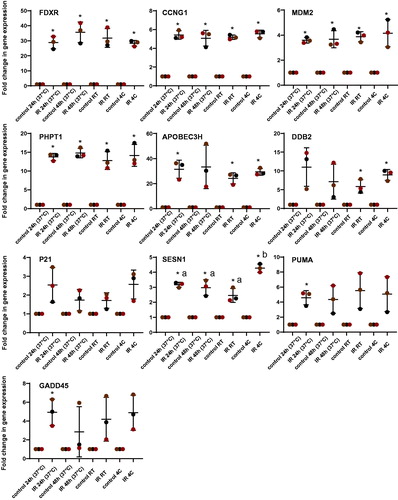
For the genes FDXR, CCNG1, MDM2 and PHPT1, the measurements of the transcriptional responses were not affected by the temperature during shipment. Besides, the non-significant differences between the samples kept at 37 °C for 24 or 48 h indicated that these genes have reached a plateau phase of expression in their response to the radiation exposure.
APOBEC3H and DDB2 did not seem to be affected by room temperature or 4 °C transport but unlike the above-mentioned genes, their response between 24 and 48 h at 37 °C showed no significant differences due to the variability between donors. Interindividual variability of response between donors could be seen for P21, PUMA and GADD45. SESN1 was the only gene significantly affected by transport temperature, presenting an up-regulation of expression at 4 °C.
Comparison of the transcriptional profile of expression biomarkers in whole blood, WBC and PBMCs after IR exposure
Blood from the same donors was used to isolate WBC and PBMCs from blood in order to compare the IR response of the 10 genes studied and their responses observed in comparison with irradiated whole blood.
For each blood sample received, specific cell isolation was performed and both irradiated and non-irradiated samples were incubated for 24 hours under the same conditions (37 °C) ().
Figure 5. Transcriptional response of 10 biomarkers to ionizing radiation in human whole blood (WB), white blood cells (WBCs) and peripheral blood mononuclear cells (PBMCs) 24 h after ionizing radiation exposure. Blood from healthy volunteers (n = 3) was exposed to a single 2 Gy X-ray dose (0.5 Gy/min) and incubated for 24 h at 37 °C. The data are presented as mean values ± standard deviation (SD). The presence of an asterisk (*) indicates a significant difference (paired T test, p≤.05) with each control group. One-way ANOVA followed by Tukey's test was performed to compare the radiation response between whole blood, WBCs and PBMCs (compared the IR only). Values not sharing a common letter are significantly different and figures not presenting any letters indicate no significant differences. IR: ionizing radiation.
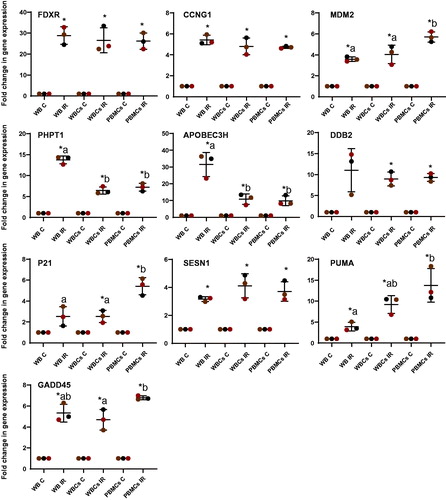
The same transcriptional response to radiation exposure in whole blood, WBC and PBMCs was observed for FDXR, CCNG1 and SESN1. This was also the case for DDB2 however it seemed to have a higher interindividual variability.
By contrast, clear and significant differences were found between blood cell fractions isolated for the other genes. MDM2, P21 and PUMA particularly presented a higher transcriptional upregulation in PBMCs than in WBCs or whole blood (e.g. PUMA, WB 4 ± 1.03 fold-change compared to 9 ± 4.01-fold in WBCs and 13 ± 2.1-fold in PBMCs) while PHPT1 and APOBEC3H showed a lower response in PBMCs and WBCs than whole blood with an almost 2- and 3-fold drop in overexpression following exposure (13 ± 0.95- to 6 ± 0.85-fold and 31 ± 7.20- to 10 ± 3.15-fold respectively).
Discussion
Radiological emergencies after nuclear accidents, explosions or dirty bombs would require a rapid and robust method to assess the dose received by a potentially large number of individuals (Kulka et al. Citation2017). Genes regulated by the DNA damage response pathway can be used as biomarkers of gene expression of ex vivo and in vivo radiation exposure, and as part of transcription-based biological dosimetry, they are promising biomarkers (Badie et al. Citation2013; Abend et al. Citation2016; Manning et al. Citation2017; O’Brien et al. Citation2018). Dose estimates could be provided in a short time from gene expression using different protocols in several multicenter biodosimetry exercises (Badie et al. Citation2013; Abend et al. Citation2016; Manning et al. Citation2017; Polozov et al. Citation2019).The genes selected in the present study, (FDXR, CCNG1, MDM2, PHPT1, APOBEC3H, DDB2, SESN1, P21, PUMA and GADD45), have previously been identified as IR responsive and demonstrated a strong transcriptional response in ex vivo experiments in our laboratory and others (Amundson et al. Citation2004; Kabacik, Mackay, et al. Citation2011; Kabacik, Ortega-Molina, et al. Citation2011; Paul et al. Citation2011; Budworth et al. Citation2012; Manning et al. Citation2013; Ghandhi et al. Citation2015; Cruz-Garcia et al. Citation2018; Jacobs et al. Citation2020; Cruz-Garcia, O’Brien, Sipos, Mayes, Love, et al. Citation2020) and in vivo (Cruz-Garcia et al. Citation2018; O’Brien et al. Citation2018). Previous studies have shown that factors such as inflammation, sex or nutritional components can contribute in the modulation of the biomarker’s response to radiation exposure (Budworth et al. Citation2012; Soltani et al. Citation2016; Cruz-Garcia et al. Citation2018; Cruz-Garcia, O’Brien, Sipos, Mayes, Tichý, et al. Citation2020). Understanding how factors that could affect the DNA damage response (DDR) pathways and consequently compromise the biomarkers’ response is crucial to be able to take such factors into account and thus be able to obtain accurate and reproducible dose estimations.
Several studies have demonstrated that the DDR can be affected by hypothermia. Hypothermia is a drop-in core body temperature to a level of 35 °C or less. It has been described that hypothermia can increase resistance of DNA damage caused by ionizing radiation, improves survival and protect cells from apoptosis (Elmroth, Erkell, and Hultborn 1999; Elmroth, Erkell, Nygren, et al. 1999; Elmroth et al. Citation2000; Sakurai et al. Citation2005; Baird et al. Citation2011). However, while hypothermia protects organisms from the acute effects following irradiation, it can also lead to impaired ability to repair damage caused by radiation (Fukunaga Citation2020). Previous studies have shown that hyperthermia leads to activation of human ATR inducing cell cycle arrest at the G2/M transition (Furusawa et al. Citation2012) Besides, exposing samples at very low temperatures during radiation exposure doesn’t seem to affect the radiation response of biomarkers of gene expression such as BBC3, FDXR, GADD45a, XPC, MDM2 and CDKN1A(Lisowska et al. Citation2018). In the present study the temperatures tested after exposure far below body temperature, 22 and 4 °C, stopped the transcriptional upregulation of the majority of the biomarker genes studied in response to a 2 Gy dose exposure. Notably, we could still observe a slight, but significant transcriptional upregulation for 3 of the genes: SESN1, P21 and GADD45. All members of the GADD45 protein family are rapidly induced when DNA damage occurs. This leads to cell cycle arrest and/or apoptosis, or they participate in repair mechanisms. These highly conserved proteins appear to perform similar functions and interact with similar sets of proteins, including P21 (Tamura et al. Citation2012). The latter protein is involved in the regulation of cell cycle checkpoints by interaction with GADD45 proteins and interacts with CDK/cyclin complexes, activating the G1/S checkpoint (Zhang et al. Citation1993). Sestrins (SESN) are a family of proteins induced under various stress conditions including DNA damage, oxidative stress and hypoxia and is mainly transcriptionally controlled by TP53 (Budanov et al. Citation2002; Lee et al. Citation2013). Although we do not have enough evidence in our results to determine why GADD45, P21 and SESN1 show some upregulation after irradiation at 22 °C and even 4 °C, one can propose the hypothesis that their response might be implicated in the survival of the cells under hypothermic conditions or perhaps the signaling pathway is not completely attenuated by hypothermia,. In a study using hepatoblastoma cells, RNA and protein synthesis were reduced at 27 °C but still presenting 70% of detectable activity (Ohsaka et al. Citation2001). However, at temperatures of 10 °C and below, transcription and translation are inhibited (Fuller Citation1999, Citation2003).
As a temperature decrease seems to fully impair the transcriptional response of most biomarkers of radiation, we decided to determine whether ambient (20 °C) and/or 4 °C transport conditions could potentially affect the dose estimations calculated using the biomarkers selected. Previous studies regarding blood sample transport role in gene expression analysis reported changes in gene expression when samples are not stored in RNA stabilizers leading to low RNA quality (Malentacchi et al. Citation2016; Huang et al. Citation2017). Our samples’ RIN value average was 6.2, which is too low for applications like sequencing analysis. However, for the genes studied, our qPCR analysis results did not show any difference between the samples stored in RNA later 24 h after exposure at 37 °C or samples which were kept at room temperature or 4 °C. Therefore, in circumstances where RNA stabilizers cannot be added to the samples at the moment of collection, transport for 24 h at 22 or 4 °C does not compromise the results when data are generated by qPCR analysis. These results also point out the need of temperature control and monitoring during sample transport in order to be able to detect abnormal temperatures or fluctuations which might affect transcriptional levels of radiation responsive genes, hence therefore affecting the derived dose-estimates.
When comparing the level of expression over time in the control samples at 24 h and 48 h, we observed that the gene expression levels seem to reach a plateau phase. Characterization of the expression profile of these biomarkers over time after exposure is crucial to provide good dose estimates. Previous studies have compared the transcriptional response within the first 24 h after exposure ex vivo (Manning et al. Citation2013; Beer et al. Citation2014; Cruz-Garcia et al. Citation2018) demonstrating an increased level of expression at 24–20 h compared to 2 and 4 h. However, Brzóska and Kruszewski, Citation2015 showed that the transcriptional response of a list of 16 radiation responsive genes was affected by the dose but not over time at 6, 12, 24 and 48 h (Brzóska and Kruszewski Citation2015). These results are however to be taken cautiously as there were obtained ex vivo and may not reflect what is happening in vivo. Further characterization of these biomarkers needs to be performed in vivo to characterize transcriptional profiles over time after exposure.
It should be noted that although a trend toward an up-regulation of P21 gene is clear, it does not present a significant transcriptional response at body temperature (37 °C). We observed the same result in repeated experiments with samples left 24 h to 37 °C (IR 24 h 37 °C). Although P21 can be considered an ‘early responsive’ gene at 2 hours post-exposure (Manning et al. Citation2013), inter-individual variability between donor responses in this study probably explain the non-significance of the up-regulation at 24 hours. Other similar studies, reported P21 as significantly up-regulated 24 h after radiation exposure (Budworth et al. Citation2012; Chauhan and Howland Citation2014).
In the literature, data reported have been generated with either WBCs, whole blood or PBMCs (Paul et al. Citation2011; Chauhan and Howland Citation2014; Macaeva et al. Citation2016). These differ in the cell composition, with WBCs including lymphocytes, macrophages and granulocytes (neutrophils, eosinophils, basophils) populations while PBMCs fraction shares the same cell populations as WBCs except for the granulocytes, which are lost in the isolation process. Both WBCs and PBMCs differ from whole blood as it also contents platelets, erythrocytes and plasma. Erythrocytes, mainly immature ones, contain high numbers of alpha- and beta-globin mRNA copies which form the 4 subunits of the hemoglobin. Platelets, as erythrocytes, lack genomic DNA but contain mRNA and miRNAs and they are equipped with translational machinery (Rowley et al. Citation2012). These differences in cell composition can affect the level of transcriptional response to IR exposure as shown in the present study. Hence, our results highlighted the fact that, at least for certain genes, it is advisable to compare data obtained with the same blood cell fraction when comparing genes responses in the context of IR exposure. For example, the transcriptional responses of MDM2, P21 and PUMA are significantly more pronounced in PBMCs, presenting fold-changes of 5.7, 5.4 and 13.7, respectively. However, for PHPT1 and APOBEC3H, whole blood provides a significantly higher level of response with fold-changes of 13.7 and 31, respectively. These differences between the blood fractions can be attributed to the absence of certain cell populations, namely granulocytes in PBMCs. Using different blood cell fractions affect the level of expression of genes as previously described as each cell type contributes to a specific gene expression signature reflecting their function (Whitney et al. Citation2003; Debey et al. Citation2004; Gruel et al. Citation2008; Min et al. Citation2010). In this study we confirmed these previously reported findings with radiation-responsive genes not studied before. Moreover, whole blood which includes erythrocytes, immature erythrocytes and platelets carry large amounts of specific mRNAs (Bonafoux et al. Citation2004; Rowley et al. Citation2012), which may not be the reflection of the transcriptional changes in response of DNA damage as a DNA damage response is not expected to occur. Therefore, the changes in gene expression for some genes between WBCs and whole blood might be related to methodological differences during cell isolation as previously described (Debey et al. Citation2004). Interestingly, and by contrast with the above-mentioned genes, for FDXR, CCNG1 and SESN1, similar results were obtained in all three cell fractions studied here. Overall, our results suggest that consideration should be given to the blood sample type studied when performing dose estimations based on gene expression analyses. Whole blood is an easily accessible resource, while the separation of PBMCs and WBCs requires several time-consuming methodological additional steps. Transcriptomic differences may be induced by different sample collection, handling, storage and extraction methods (Asare et al. Citation2008; Debey-Pascher et al. Citation2011; Jiang et al. Citation2013; Franken et al. Citation2016).
Looking at the reliability of individual genes based on the experimental settings studied, FDXR and APOBEC3H showed the highest gene expression response to IR compared to the others. However, APOBEC3H shows a more pronounced inter-individual variability as observed before (Cruz-Garcia, O’Brien, Sipos, Mayes, Love, et al. Citation2020); FDXR is clearly a remarkable biomarker with a strong response to IR exposure as has been demonstrated in previous studies (Manning et al. Citation2013; O’Brien et al. Citation2018) showing reproducibility and sensitivity in the time frame studied. Together with FDXR, CCNG1 gave the most consistent responses to IR under the confounding factors tested. CCNG1 is a gene regulated through the DDR and has proven to present very low inter-individual variability and linear dose-response at low doses (25–100 mGy) in previous studies (Manning et al. Citation2013). Besides, the pro-inflammation effect of the lipopolysaccharide have demonstrated to exert a confounding effect on the response to IR of this gene in whole blood irradiated ex vivo but it seems to be temporary (Cruz-Garcia et al. Citation2018).
In conclusion, our results provide new insights in the modulation of the transcriptional response to radiation due to the temperature, the transport conditions and the blood derived cell fraction on a panel of radiation-responsive genes. We have shown that, for most of these genes, hypothermic conditions can inhibit transcriptional radiation-response following irradiation during the first 24 hours post exposure. Besides, their level of expression seems not to be affected during transport of samples and finally, we have shown that for certain genes, the blood derived cell fraction analyzed lead to different responses to IR.
Within the parameters studied, our results also demonstrate the reliability of FDXR and CCNG1 as transcriptional biomarkers of IR-exposure. The results confirm that FDXR is the radiation-responsive gene with the most relevant characteristics for blood-based dose estimation. However, the high level of responsiveness and dose estimation accuracy of FDXR and the low level of inter-individual variability and linear response at low doses for CCNG1 previously observed(Manning et al. Citation2013; Cruz-Garcia et al. Citation2018; O’Brien et al. Citation2018), suggest that combining the information of both biomarkers may provide more robust dose estimates. This study highlights the fact that standardization of sample handling and processing procedures is paramount when comparing radiation induced gene expression responses. Future studies should take in account these identified sources of data variability in order to obtain reliable and reproducible results.
Acknowledgments
The views expressed are those of the author(s) and not necessarily those of the NIHR, Public Health England or the Department of Health and Social Care.
Disclosure statement
No potential conflict of interest was reported by the author(s).
Additional information
Funding
Notes on contributors
Farah Nasser
Farah Nasser is a master student at the Department of Radiation Effects, Public Health England.
Lourdes Cruz-Garcia
Lourdes Cruz-Garcia, PhD, is a Senior Scientist at the Department of Radiation Effects, Public Health England.
Grainne O’Brien
Grainne O'Brien, PhD, is a Scientist at the Department of Radiation Effects, Public Health England.
Christophe Badie
Christophe Badie, PhD, is a Group Leader at the Department of Radiation Effects, Public Health England.
References
- Abend M, Badie C, Quintens R, Kriehuber R, Manning G, Macaeva E, Njima M, Oskamp D, Strunz S, Moertl S, et al. 2016. Examining radiation-induced in vivo and in vitro gene expression changes of the peripheral blood in different laboratories for biodosimetry purposes: first RENEB gene expression study. Radiat Res. 185(2):109–123.
- Ainsbury E, Badie C, Barnard S, Manning G, Moquet J, Abend M, Antunes AC, Barrios L, Bassinet C, Beinke C, et al. 2017. Integration of new biological and physical retrospective dosimetry methods into EU emergency response plans – joint RENEB and EURADOS inter-laboratory comparisons. Int J Radiat Biol. 93(1):99–109.
- Amundson SA, Do KT, Shahab S, Bittner M, Meltzer P, Trent J. 2000. Identification of potential mRNA biomarkers in peripheral blood lymphocytes for human exposure to ionizing radiation. Radiat Res. 154(3):342–346.
- Amundson SA, Grace MB, McLeland CB, Epperly MW, Yeager A, Zhan Q, Greenberger JS, Fornace AJ. 2004. Human in vivo radiation-induced biomarkers: gene expression changes in radiotherapy patients. Cancer Res. 64(18):6368–6371.
- Asare AL, Kolchinsky SA, Gao Z, Wang R, Raddassi K, Bourcier K, Seyfert-Margolis V. 2008. Differential gene expression profiles are dependent upon method of peripheral blood collection and RNA isolation. BMC Genomics. 9(1):474.
- Badie C, Hess J, Zitzelsberger H, Kulka U. 2016. Established and emerging biomarkers of radiation exposure. Clin Oncol. 28(10):619–621.
- Badie C, Itzhaki JE, Sullivan MJ, Carpenter AJ, Porter AC. 2000. Repression of CDK1 and other genes with CDE and CHR promoter elements during DNA damage-induced G(2)/M arrest in human cells. Mol Cell Biol. 20(7):2358–2366.
- Badie C, Kabacik S, Balagurunathan Y, Bernard N, Brengues M, Faggioni G, Greither R, Lista F, Peinnequin A, Poyot T, et al. 2013. Nato biodosimetry study: laboratory intercomparison of gene expression assays. Radiat Res. 180(2):138–148.
- Baird BJ, Dickey JS, Nakamura AJ, Redon CE, Parekh P, Griko YV, Aziz K, Georgakilas AG, Bonner WM, Martin OA. 2011. Hypothermia postpones DNA damage repair in irradiated cells and protects against cell killing. Mutat Res. 711(1–2):142–149.
- Beer L, Seemann R, Ristl R, Ellinger A, Kasiri MM, Mitterbauer A, Zimmermann M, Gabriel C, Gyongyosi M, Klepetko W, et al. 2014. High dose ionizing radiation regulates micro RNA and gene expression changes in human peripheral blood mononuclear cells. BMC Genomics. 15:814.
- Bonafoux B, Lejeune M, Piquemal D, Quere R, Baudet A, Assaf L, Marti J, Aguilar-Martinez P, Commes T. 2004. Analysis of remnant reticulocyte mRNA reveals new genes and antisense transcripts expressed in the human erythroid lineage. Haematologica. 89(12):1434–1438.
- Brzóska K, Kruszewski M. 2015. Toward the development of transcriptional biodosimetry for the identification of irradiated individuals and assessment of absorbed radiation dose. Radiat Environ Biophys. 54(3):353–363.
- Budanov AV, Shoshani T, Faerman A, Zelin E, Kamer I, Kalinski H, Gorodin S, Fishman A, Chajut A, Einat P, et al. 2002. Identification of a novel stress-responsive gene Hi95 involved in regulation of cell viability. Oncogene. 21(39):6017–6031.
- Budworth H, Snijders AM, Marchetti F, Mannion B, Bhatnagar S, Kwoh E, Tan Y, Wang SX, Blakely WF, Coleman M, et al. 2012. DNA repair and cell cycle biomarkers of radiation exposure and inflammation stress in human blood. PLoS One. 7(11):e48619.
- Chauhan V, Howland M. 2014. Gene expression responses in human lung fibroblasts exposed to alpha particle radiation. Toxicol in Vitro. 28(7):1222–1229.
- Cruz-Garcia L, O'Brien G, Donovan E, Gothard L, Boyle S, Laval A, Testard I, Ponge L, Woźniak G, Miszczyk L, et al. 2018. Influence of confounding factors on radiation dose estimation using in vivo validated transcriptional biomarkers. Health Phys. 115(1):90–101.
- Cruz-Garcia L, O’Brien G, Sipos B, Mayes S, Tichý A, Sirák I, Davídková M, Marková M, Turner DJ, Badie C. 2020. In vivo validation of alternative FDXR transcripts in human blood in response to ionizing radiation. IJMS. 21(21):7851.
- Cruz-Garcia L, O'Brien G, Sipos B, Mayes S, Love MI, Turner DJ, Badie C. 2020a. Generation of a transcriptional radiation exposure signature in human blood using long-read nanopore sequencing. Radiat Res. 193(2):143–154.
- Debey S, Schoenbeck U, Hellmich M, Gathof BS, Pillai R, Zander T, Schultze JL. 2004. Comparison of different isolation techniques prior gene expression profiling of blood derived cells: impact on physiological responses, on overall expression and the role of different cell types. Pharmacogenomics J. 4(3):193–207.
- Debey-Pascher S, Hofmann A, Kreusch F, Schuler G, Schuler-Thurner B, Schultze JL, Staratschek-Jox A. 2011. RNA-stabilized whole blood samples but not peripheral blood mononuclear cells can be stored for prolonged time periods prior to transcriptome analysis. J Mol Diagn. 13(4):452–460.
- Elmroth K, Erkell LJ, Hultborn R. 1999a. Influence of temperature on radiation-induced inhibition of DNA supercoiling. Radiat Res. 152(2):137–143.
- Elmroth K, Erkell LJ, Nygren J, Hultborn R. 1999b. Radiation and hypothermia: changes in DNA supercoiling in human diploid fibroblasts. Anticancer Res. 19(6B):5307–5311.
- Elmroth K, Nygren J, Erkell LJ, Hultborn R. 2000. Radiation-induced double-strand breaks in mammalian DNA: influence of temperature and DMSO. Int J Radiat Biol. 76(11):1501–1508.
- Franken C, Remy S, Lambrechts N, Hollanders K, Den Hond E, Schoeters G. 2016. Peripheral blood collection: the first step towards gene expression profiling. Biomarkers. 21(5):458–465.
- Fukunaga H. 2020. The effect of low temperatures on environmental radiation damage in living systems: does hypothermia show promise for space travel? Int J Mol Sci. 21(17):6349.
- Fuller BJ. 1999. Organ preservation: The profit and loss account of using hypothermia to maintain viability. Transplantat Rev. 13(2):55–66.
- Fuller BJ. 2003. Gene expression in response to low temperatures in mammalian cells: a review of current ideas. Cryo Letters. 24(2):95–102.
- Furusawa Y, Iizumi T, Fujiwara Y, Zhao QL, Tabuchi Y, Nomura T, Kondo T. 2012. Inhibition of checkpoint kinase 1 abrogates G2/M checkpoint activation and promotes apoptosis under heat stress. Apoptosis. 17(1):102–112.
- Ghandhi SA, Smilenov LB, Elliston CD, Chowdhury M, Amundson SA. 2015. Radiation dose-rate effects on gene expression for human biodosimetry. BMC Med Genom. 8(1):22.
- Gruel G, Voisin P, Vaurijoux A, Roch-Lefevre S, Gregoire E, Maltere P, Petat C, Gidrol X, Voisin P, Roy L. 2008. Broad modulation of gene expression in CD4+ lymphocyte subpopulations in response to low doses of ionizing radiation. Radiat Res. 170(3):335–344.
- Hall J, Jeggo PA, West C, Gomolka M, Quintens R, Badie C, Laurent O, Aerts A, Anastasov N, Azimzadeh O, et al. 2017. Ionizing radiation biomarkers in epidemiological studies – an update. Mutat Res. 771:59–84.
- Huang LH, Lin PH, Tsai KW, Wang LJ, Huang YH, Kuo HC, Li SC. 2017. The effects of storage temperature and duration of blood samples on DNA and RNA qualities. PLoS One. 12(9):e0184692.
- Jacobs AR, Guyon T, Headley V, Nair M, Ricketts W, Gray G, Wong JYC, Chao N, Terbrueggen R. 2020. Role of a high throughput biodosimetry test in treatment prioritization after a nuclear incident. Int J Radiat Biol. 96(1):57–59.
- Jiang Z, Uboh CE, Chen J, Soma LR. 2013. Isolation of RNA from equine peripheral blood cells: comparison of methods. Springerplus. 2:478.
- Kabacik S, Mackay A, Tamber N, Manning G, Finnon P, Paillier F, Ashworth A, Bouffler S, Badie C. 2011. Gene expression following ionising radiation: identification of biomarkers for dose estimation and prediction of individual response. Int J Radiat Biol. 87(2):115–129.
- Kabacik S, Ortega-Molina A, Efeyan A, Finnon P, Bouffler S, Serrano M, Badie C. 2011. A minimally invasive assay for individual assessment of the ATM/CHEK2/p53 pathway activity. Cell Cycle. 10(7):1152–1161.
- Kulka U, Abend M, Ainsbury E, Badie C, Barquinero JF, Barrios L, Beinke C, Bortolin E, Cucu A, De Amicis A, et al. 2017. RENEB - Running the European network of biological dosimetry and physical retrospective dosimetry. Int J Radiat Biol. 93(1):2–14.
- Lacombe J, Sima C, Amundson SA, Zenhausern F. 2018. Candidate gene biodosimetry markers of exposure to external ionizing radiation in human blood: a systematic review. PLoS One. 13(6):e0198851.
- Lee JH, Budanov AV, Karin M. 2013. Sestrins orchestrate cellular metabolism to attenuate aging. Cell Metab. 18(6):792–801.
- Li S, Zhang QZ, Zhang DQ, Feng JB, Luo Q, Lu X, Wang XR, Li KP, Chen DQ, Mu XF, et al. 2017. GDF-15 gene expression alterations in human lymphoblastoid cells and peripheral blood lymphocytes following exposure to ionizing radiation. Mol Med Rep. 15(6):3599–3606.
- Lisowska H, Cheng L, Sollazzo A, Lundholm L, Wegierek-Ciuk A, Sommer S, Lankoff A, Wojcik A. 2018. Hypothermia modulates the DNA damage response to ionizing radiation in human peripheral blood lymphocytes. Int J Radiat Biol. 94(6):551–557.
- Macaeva E, Saeys Y, Tabury K, Janssen A, Michaux A, Benotmane MA, De Vos WH, Baatout S, Quintens R. 2016. Radiation-induced alternative transcription and splicing events and their applicability to practical biodosimetry. Sci Rep. 6:19251.
- Malentacchi F, Pizzamiglio S, Wyrich R, Verderio P, Ciniselli C, Pazzagli M, Gelmini S. 2016. Effects of transport and storage conditions on gene expression in blood samples. Biopreserv Biobank. 14(2):122–128.
- Manning G, Kabacik S, Finnon P, Bouffler S, Badie C. 2013. High and low dose responses of transcriptional biomarkers in ex vivo X-irradiated human blood. Int J Radiat Biol. 89(7):512–522.
- Manning G, Macaeva E, Majewski M, Kriehuber R, Brzóska K, Abend M, Doucha-Senf S, Oskamp D, Strunz S, Quintens R, et al. 2017. Comparable dose estimates of blinded whole blood samples are obtained independently of culture conditions and analytical approaches. Second RENEB gene expression study. Int J Radiat Biol. 93(1):87–98.
- Min JL, Barrett A, Watts T, Pettersson FH, Lockstone HE, Lindgren CM, Taylor JM, Allen M, Zondervan KT, McCarthy MI. 2010. Variability of gene expression profiles in human blood and lymphoblastoid cell lines. BMC Genomics. 11(1):96.
- O'Brien G, Cruz-Garcia L, Majewski M, Grepl J, Abend M, Port M, Tichý A, Sirak I, Malkova A, Donovan E, et al. 2018. FDXR is a biomarker of radiation exposure in vivo. Sci Rep. 8(1):684.
- Ohsaka Y, Ohgiya S, Hoshino T, Ishizaki K. 2001. Cold-stimulated increase in a regulatory subunit of cAMP-dependent protein kinase in human hepatoblastoma cells. DNA Cell Biol. 20(10):667–673.
- Paul S, Barker CA, Turner HC, McLane A, Wolden SL, Amundson SA. 2011. Prediction of in vivo radiation dose status in radiotherapy patients using ex vivo and in vivo gene expression signatures. Radiat Res. 175(3):257–265.
- Pernot E, Hall J, Baatout S, Benotmane MA, Blanchardon E, Bouffler S, El Saghire H, Gomolka M, Guertler A, Harms-Ringdahl M, et al. 2012. Ionizing radiation biomarkers for potential use in epidemiological studies. Mutat Res. 751(2):258–286.
- Polozov S, Cruz-Garcia L, Badie C. 2019. Rapid gene expression based dose estimation for radiological emergencies. Radiat Protect Dosimet. 186(1):24–30.
- Port M, Majewski M, Herodin F, Valente M, Drouet M, Forcheron F, Tichy A, Sirak I, Zavrelova A, Malkova A, et al. 2018. Validating baboon ex vivo and in vivo radiation-related gene expression with corresponding human data. Radiat Res. 189(4):389–398.
- Rothkamm K, Beinke C, Romm H, Badie C, Balagurunathan Y, Barnard S. 2013. Comparison of established and emerging biodosimetry assays. Radiat Res. 180(2):111–119.
- Rowley JW, Schwertz H, Weyrich AS. 2012. Platelet mRNA: the meaning behind the message. Curr Opin Hematol. 19(5):385–391.
- Sakurai T, Itoh K, Liu Y, Higashitsuji H, Sumitomo Y, Sakamaki K, Fujita J. 2005. Low temperature protects mammalian cells from apoptosis initiated by various stimuli in vitro. Exp Cell Res. 309(2):264–272.
- Soltani B, Ghaemi N, Sadeghizadeh M, Najafi F. 2016. Redox maintenance and concerted modulation of gene expression and signaling pathways by a nanoformulation of curcumin protects peripheral blood mononuclear cells against gamma radiation. Chem Biol Interact. 257:81–93.
- Sproull MT, Camphausen KA, Koblentz GD. 2017. Biodosimetry: a future tool for medical management of radiological emergencies. Health Secur. 15(6):599–610.
- Tamura RE, de Vasconcellos JF, Sarkar D, Libermann TA, Fisher PB, Zerbini LF. 2012. GADD45 proteins: central players in tumorigenesis. Curr Mol Med. 12(5):634–651.
- Tichy A, Kabacik S, O’Brien G, Pejchal J, Sinkorova Z, Kmochova A, Sirak I, Malkova A, Beltran CG, Gonzalez JR, et al. 2018. The first in vivo multiparametric comparison of different radiation exposure biomarkers in human blood. PLoS One. 13(2):e0193412.
- Tucker JD. 2008. Low-dose ionizing radiation and chromosome translocations: a review of the major considerations for human biological dosimetry. Mutat Res. 659(3):211–220.
- Whitney AR, Diehn M, Popper SJ, Alizadeh AA, Boldrick JC, Relman DA, Brown PO. 2003. Individuality and variation in gene expression patterns in human blood. Proc Natl Acad Sci USA. 100(4):1896–1901.
- Zhang H, Xiong Y, Beach D. 1993. Proliferating cell nuclear antigen and p21 are components of multiple cell cycle kinase complexes. Mol Biol Cell. 4(9):897–906.