
Abstract
Purpose
Biological and/or physical assays for retrospective dosimetry are valuable tools to recover the exposure situation and to aid medical decision making. To further validate and improve such biological and physical assays, in 2019, EURADOS Working Group 10 and RENEB performed a field exercise in Lund, Sweden, to simulate various real-life exposure scenarios.
Materials and methods
For the dicentric chromosome assay (DCA), blood tubes were located at anthropomorphic phantoms positioned in different geometries and were irradiated with a 1.36 TBq 192Ir-source. For each exposure condition, dose estimates were provided by at least one laboratory and for four conditions by 17 participating RENEB laboratories. Three radio-photoluminescence glass dosimeters were placed at each tube to assess reference doses.
Results
The DCA results were homogeneous between participants and matched well with the reference doses (≥95% of estimates within ±0.5 Gy of the reference). For samples close to the source systematic underestimation could be corrected by accounting for exposure time. Heterogeneity within and between tubes was detected for reference doses as well as for DCA doses estimates.
Conclusions
The participants were able to successfully estimate the doses and to provide important information on the exposure scenarios under conditions closely resembling a real-life situation.
Introduction
Due to very high safety standards, accidental exposures to ionizing radiation are nowadays, fortunately, rare events. Nevertheless, there is a small risk for radiological or nuclear terrorist attacks threatening a large number of individuals. Furthermore, although mostly at relatively low doses, small-scale accidents or suspected accidental exposures to ionizing radiation occur sometimes in medical or industrial applications (Beinke et al. Citation2015; Wernli et al. Citation2015; Elmiger et al. Citation2018; Tawn et al. Citation2018; Güçlü Citation2021). In the case of small or large scale radiological accidents, it is crucial to provide reliable dose estimates or dose categories for potentially exposed individuals to aid the decision making on legal consequences, on the necessity of clinical treatments or to reassure ‘worried well’ individuals (Kulka and Wojcik Citation2017; Barquinero et al. Citation2021). Methods for retrospective physical and biological dosimetry are very valuable tools to provide dose estimates after an unclear exposure to ionizing radiation occurred (IAEA Citation2011; Trompier, Burbidge, et al. Citation2016; Wojcik et al. Citation2017; ICRU Citation2019). For biological dosimetry, the dicentric chromosome assay (DCA) is considered the gold standard for recent radiation exposure (Blakely et al. Citation2009; Hall et al. Citation2017) and enables high-quality assessments of the blood dose. However, the DCA needs a relatively large amount of work to produce dose estimates (Oestreicher et al. Citation2018), requiring new strategies to speed up analysis and/or share the workload (Jaworska et al. Citation2015). One approach to tackle this problem is based on networking among national and/or international laboratories. In recent years, several international networks for biological dosimetry were established in Europe, Asia, Latin American, Canada, and the United States (Kulka et al. Citation2018).
High-quality standards for the experimental work and the statistical methods for dose and uncertainty estimation are crucial for reliable dose estimates. In recent years, much effort has been undertaken to standardize methods for retrospective physical and biological dosimetry as well as the associated statistical routines (ISO21243 Citation2008; IAEA Citation2011; ISO17099 Citation2014; ISO19238 Citation2014; Gregoire et al. Citation2017; ISO20046 Citation2019; ISO13304 Citation2020a, Citation2020b). In general, networking between laboratories improved quality standards and increased harmonization of dose estimates between member laboratories (Di Giorgio et al. Citation2011; Jaworska et al. Citation2015; Wojcik et al. Citation2017). In the European RENEB (Running the European Network of Biological and retrospective Physical dosimetry), the central aims are to ensure availability, quality, and efficiency in the assessment of individual radiation doses after exposure by facilitating mutual assistance of international partner laboratories and to identify needs for training and harmonization in the field of retrospective physical and biological dosimetry. Similarly, within EURADOS (European Radiation Dosimetry Group) WG10 (Working Group 10; retrospective dosimetry), a multi-parameter approach for retrospective dose assessment has been established based on physical and biological methods and newly developed approaches are constantly evaluated (Rühm et al. Citation2018). RENEB and EURADOS WG10 closely collaborate to provide and validate multiple methods for retrospective dosimetry that can be applied in emergency cases (Kulka et al. Citation2017; Ainsbury et al. Citation2017). Scientific exercises and international inter-laboratory comparisons (ILCs) are central tools to ensure high-quality standards and to identify potential needs for future improvements. In the frame of RENEB or EURADOS WG10, several exercises have been performed in recent years to evaluate methods for biological or physical retrospective dosimetry (Brzozowska et al. Citation2017; Barnard et al. Citation2015; Abend et al. Citation2016; Manning et al. Citation2017; Depuydt et al. Citation2017; Moquet et al. Citation2017; Oestreicher et al. Citation2017; Terzoudi et al. Citation2017; Gregoire et al. Citation2021; Wieser et al. Citation2005; Wieser et al. Citation2006; Hoshi et al. Citation2007; Ivannikov et al. Citation2007; Fattibene et al. Citation2011; Bassinet et al. Citation2014; Fattibene et al. Citation2014; Trompier, Burbidge, et al. Citation2016; Ainsbury et al. Citation2017). Furthermore, in the frame of the research project CATO (CBRN crisis management, architectures, technologies and operational procedures), a field test where a radioactive source was placed in the baggage compartment of a bus was performed to test physical and biological methods for retrospective dosimetry in a simulated potential real-life scenario (Rojas Palma et al. Citation2020).
The current exercise was planned and performed in cooperation by EURADOS WG10 and RENEB in Lund, Sweden in October 2019, to resemble a small scale exposure scenario of a few individuals, exposed in different geometries, to test the ability of the different assays alone or in combination to resolve the exposure types as well as the relevant doses (Waldner et al. Citation2021). In comparison to standard ILCs performed under controlled laboratory conditions, this exercise was a field test, to more closely resemble a real-life scenario, where exposure conditions and logistical aspects are much more difficult to control than in the laboratory. In total four anthropomorphic phantoms were equipped with several materials that were used for retrospective physical and biological dosimetry (Waldner et al. Citation2021). Biological dosimetry for a variety of exposure scenarios was performed based on the DCA by the participants and the resulting dose estimates were compared to reference dose estimates from radio-photoluminescence (RPL) glass dosimeters (GD). The aim of the exercise was to validate different dosimetric methods in parallel as well as the performance of laboratories for a given tool. In the current paper, the resulting dose estimates from the DCA are shown and discussed in detail, clearly demonstrating that RENEB partner laboratories are able to provide reliable dose estimates based on the DCA, also under field conditions with many parameters contributing to uncertainties. Separate publications are in preparation to present the results of the other methods involved in the field exercise.
Materials and methods
Irradiation scenarios
In the frame of the exercise, two irradiation setups were arranged with a total of four phantoms (). The irradiation was performed with a 1.36 TBq 192Ir- source (Tech-Ops 880 Sentinal) intended for radiography. All phantoms (P1–P4) were positioned on chairs at a height of 45 cm. Details about the source, dose rates, phantoms and irradiation conditions can be found in Waldner et al. (Citation2021). For biological dosimetry purposes, each phantom was equipped with 2 thermos flasks (Primus Trailbreak, 550 ml) filled with water at approximately 37 °C. Tubes, each containing 7 ml blood, were placed in the thermos flask. The number of tubes per thermos flask varied according to the partners involved in the analysis. Three RPL GD were placed outside each blood tube in sealed vinyl bags at the surface facing the source along the vertical axis, at the bottom, middle and top. In addition, RPL GDs were placed around the outside of the thermos flasks (). The participating partners from the RENEB network analyzed samples from flasks P1-A, P1-B, P3-A and P4-A. In the frame of EURADOS, additional samples from flasks P2-A, P2-B, P3-B and P4-B were analyzed only by single laboratories (BfS, Germany; PHE, UK; IRSN, France).
Figure 1. Irradiation setups and positions of samples for biological dosimetry. (A, C) setup of the first irradiation (phantoms P1 and P2), with samples P1-A (left hip) and P1-B (left shoulder) in red thermos flasks, samples P2-A (left hip) and P2-B (right hip) in black thermos flasks. (B, D) setup of the second irradiation (phantoms P3 and P4), with samples P3-A (left hip) and P3-B (left shoulder) in black, samples P4-A (left hip) and P4-B (right hip) in red thermos flasks. (E, F) RPL glass dosimeter reference doses measured outside the flasks. Red (hip) or yellow (shoulder) circles indicate the positions of flasks on the phantoms. Small blue circles indicate the position of the RPL reference glass dosimeters on the outside of the flasks. Missing doses are indicated by ‘NA’.
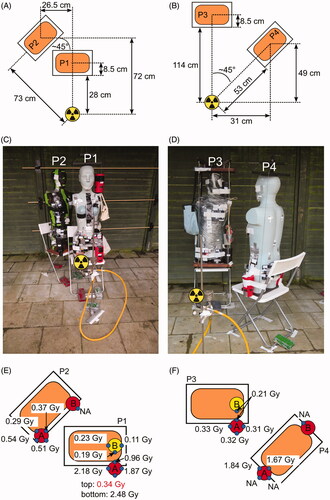
For the first irradiation (), the source was placed at a height of 59.5 cm from the ground, phantom P1 was placed close (28 cm), in an anterior–posterior geometry to the source and flasks P1-A and P1-B were placed at the left hip and left shoulder. Three tubes from each, P1-A and P1-B, were used for simulating a homogeneous exposure scenario and blood from one tube from each was mixed in a 50:50 proportion to simulate a heterogeneous exposure with two different doses (sample P1-MIX). Phantom P2 was placed angular (45° relative to P1) behind P1, at a distance of approximately 70 cm to the source, to simulate a partially shielded exposure and was equipped with flasks P2-A and P2-B at the left and right hip, respectively. Each of the thermos flasks contained one tube with 7 ml blood. The water temperature was between 37 and 37.7 °C before the irradiation and between 32.0 and 32.5 °C after 1 h of irradiation.
For the second irradiation (), phantom P4 was placed at a distance of 53 cm at an angle of 45° to the source to simulate a lateral exposure, flasks P4-A (3 tubes) and P4-B (1 tube) were located at the left and right hip, respectively. Phantom P3 was placed distant (114 cm) in an anterior-posterior geometry to the source and was equipped with flasks P3-A (3 tubes) and P3-B (1 tube), at the left hip and shoulder, respectively. The water temperature was between 38.2 and 39.3 °C before the irradiation and between 27.7 and 33.1 °C after 2.5 h of irradiation. For each phantom, blood from the two thermos flasks (A&B) was mixed in 50:50 proportions to simulate heterogeneous exposures with two different doses (P1-MIX, P2-MIX, P3-MIX, P4-MIX).
RPL GD reference dosimetry
A detailed description of the RPL glass dosimeters used for this field test can be found in (Waldner et al. Citation2021). For the purpose of biological dosimetry, RPL glass dosimeters were placed in a sealed vinyl bag for the measurements performed inside thermos flasks filled with warm water and on the external surface of the thermos flasks. Inside the thermos flasks, three dosimeters were placed on each blood tube at the surface facing the source along the vertical axis, namely at the top, center and bottom of the tube. The blood height in each tube was approximately 6 cm. The dosimeters were placed in this way to evaluate a possible dose gradient on the vertical axis and also to estimate the doses received by the samples. To evaluate a possible problem of the positioning of the water container, for samples analyzed by the RENEB participants, additional dosimeters were placed in the horizontal plane around the outside of the flask at half height. Dose estimates from 1–4 dosimeters (blue circles in ) were available for the analysis. This also aims to evaluate any possible perturbation caused by the phantom on which the containers were attached.
For the calibration of the RPL signal, RPL dosimeters of the same batch as used for the field exercise were irradiated at a known dose in a controlled facility. Two types of irradiations were performed to calibrate RPL in terms of absorbed dose in water and air kerma. Calibration in terms of absorbed dose in water was used to convert the RPL signal from GD placed in the thermos flasks and air kerma calibration for GD placed around the outside of the thermos flasks. The calibration of the RPL GDs in terms of absorbed dose in water was performed with 4 MV X-rays from LINAC (Elekta) at IRSN, France. RPL GDs irradiated at the LINAC facility were placed in a water tank, with water at 20 °C, according to the specification of IAEA TRS-398 protocol (IAEA Citation2001). Reference dosimetry was performed with a PTW 31010 ionization chamber calibrated in terms of absorbed dose in the water against 60Co gamma-rays. Dosimeters were also sealed in a vinyl bag. The delivered absorbed doses in water (Dw) ranged from 0.1 Gy to 3 Gy in order to provide a calibration curve. Uncertainty on the delivered Dw was estimated at 5% (k = 2). For calibration of kerma in air, irradiations were performed with gamma-rays of a 137Cs radioactive source at the IRSN reference facility. Dosimeters were irradiated in the air behind a 2 mm PMMA plate as specified in the new version of the ISO standard (ISO4037-3 Citation2019) with doses ranging from 10 mGy to 3 Gy. Uncertainty on-air kerma values was estimated at 2.5% (k = 2). For these irradiations, two dosimeters were irradiated per dose and configuration.
As the temperature of the water filling the containers was 37 °C for the field exercise and 20 °C for the Dw calibration, the absence of an effect of temperature during the irradiation on the RPL signal intensity was verified. Two sets of six dosimeters were irradiated with 4 MV X-rays in the water tank at a dose of 5 Gy, one in water at 20 °C and the second one at 37 °C.
One RPL GD dose measured inside flask P1-A has to be considered as a very probable outlier (GD-1, P1-AIII, ) and was excluded from the downstream analysis. This dose is above the doses measured at the front surface outside of flask P1-A (). This is a discrepancy to the expectation that the doses on the front, outside the flask, should be higher than the ones inside and is most likely due to a mixed-up dosimeter code.
Table 1. RPL GD reference doses for tubes inside the thermos flasks.
Sample processing and shipment
Blood samples were shipped by express service within 18 h to IRSN (France), PHE (UK) and BfS (Germany). The packages included one tube from each of the flasks P1-A, P1-B, P3-A and P4-A. Only single blood tubes from flasks P2-A and P2-B were shipped to PHE and from flasks P3-B and P4-B to IRSN (). The distribution of blood samples for preparation to three different laboratories was chosen to share the workload between these laboratories. The culturing and preparation were performed according to standard procedures (IAEA Citation2011; ISO19238 Citation2014). To achieve cell cycle control, Colcemid was added to the cultures after 24 h, at a final concentration of 0.04 µg/ml. Blood samples were cultured in total for 48 h (BfS, PHE) or 50 h (IRSN). The hypotonic treatment of cells was carried out with 75 mM KCl. Cells were then fixed in methanol: acetic acid (3:1) and the suspension was stored in the freezer (−18° C) before it was distributed to the participants. For the simulation of heterogeneous exposure scenarios equal amounts of blood from two blood tubes exposed to different doses were mixed and processed as described above. The cell suspension for the 50:50 mixture of sample P1-MIX was prepared at BfS and was due to the limited amount of blood available only analyzed by 11 participants. From flasks P1-A and P1-B cell suspensions were provided to 7, 6 and 6 laboratories by BfS, IRSN and PHE, respectively. Cell suspensions from flasks P3-A and P4-A were provided to 7, 3 and 9 laboratories by BfS, IRSN and PHE, respectively. For logistical reasons, the cell suspensions were distributed to partners located close to the processing laboratories. In total 19 laboratories agreed to participate in the exercise, 16 laboratories provided the complete results with dose estimates in time. One laboratory did not provide any results, one laboratory only provided dicentric counts without dose estimates and one laboratory sent the results late due to administrative problems with the courier services between the sending and the receiving institutions, leading to a delay of approximately two months between the initiation and the final shipment of the samples.
Dicentric chromosome analysis
Conventional manual scoring and/or semi-automatic scoring were applied by the participants of the exercise. Most partners (n = 11) performed the manual scoring mode. In this conventional scoring mode, only metaphase spreads with 46 centromeres were considered. The analysis procedure and detection of dicentric chromosomes were performed by well-trained and experienced human scorers at 63x or 100x magnification in the microscope and/or on the screen of a PC.
Some partners (n = 6) provided results for semi-automated scoring of dicentric chromosomes using the automatic scoring system Metafer 4 by MetaSystems (Altlussheim, Germany) including the software modules for metaphase finding (MSearch) to detect the metaphase spreads. In a second step, additional software tools were applied for auto-capturing of high-resolution images at 63× magnification (with oil) (AutoCapt) and automatic detection of dicentric candidates (DCScore). In a third step, a human scorer evaluated the automatically detected dicentric candidates on the screen of the PC, thus resulting not in a full but in a semi-automated scoring approach (Romm et al. Citation2013).
Statistical analysis
Dicentric counts should be obtained for 500 cells if scored in manual mode or at least 1500 cells in semi-automatic mode. Each participating laboratory was sent an Excel template to provide information on (a) the calibration curve used for dose estimation, (b) dicentric distributions with U values and dispersion indices (δ) and (c) dose estimates based on the assumption of acute exposures with 95% confidence intervals (CI) for each of the blind samples. Furthermore, the participating laboratories were asked to use a newly developed statistical software for biological dosimetry (Biodose Tools version 2019.10.15-beta) (Hernández et al. Citation2019) with default settings. The estimated doses were sent to BfS where the evaluation of the results was performed.
After the resulting dose estimates were collected, the data were checked to ensure that the distribution of dicentrics corresponded to the number of dicentrics given in the excel sheets provided by the participating laboratories. Several typos were detected during this step and laboratories were contacted to double-check the values and provide corrected results. In the next step, doses were re-calculated with the statistic software R to check whether the provided doses could be reproduced with the calibration curve coefficients and dicentric counts provided by the participants. If inconsistencies were observed the laboratories were contacted and asked to double-check their results and provide corrected results. Due to administrative problems with the shipment of samples, the results of Lab17 were provided after the RPL GD reference doses were revealed to the participating laboratories and are displayed in graphs and tables but not considered for comparisons with the RPL GD doses within the text of this report. After the correction of typos in filling in the excel template, the provided doses corresponded to the re-calculated doses.
As routines for the estimation of a mixture of two doses were developed relatively recently (Pujol et al. Citation2016) and are currently not commonly used in the biological dosimetry community, most laboratories did not provide estimates for a heterogeneous exposure with two different doses for sample P1-MIX. To test whether the single mixture doses can be reproduced based on the dicentric distribution provided by the participating laboratories, the estimation of the heterogeneous doses for sample P1-MIX was performed at BfS after the results were provided by the participants. Biodose Tools version 2019.10.15-beta (Hernández et al. Citation2019) was used for the estimation of heterogeneous doses, using a survival coefficient D37 = 2.7, that is, the dose where it is expected that 37% of the cells are killed (Lloyd et al. Citation1973). Similarly, dose estimates assuming a protracted exposure were performed at BfS based on the dicentric counts and calibration curves provided by each of the participants using the G-function approach (Lea and Catcheside Citation1942; IAEA Citation2011), assuming a mean lifetime of breaks t0 = 2h (Lloyd et al. Citation1984; Bauchinger et al. Citation1979; IAEA Citation2011), which is defined as the average time until a lesion of the DNA is repaired.
Results
RPL GD reference doses
RPL GD reference dosimeters were placed inside, at the surface of the blood tubes, and outside the thermos flasks. As expected, the RPL GD reference doses placed outside the thermos flasks showed the highest or lowest doses at the side facing or not facing the phantom, respectively (). For comparisons to the DCA dose estimates only RPL GD reference doses measured inside the thermos flasks, directly at the surface of the blood tubes, were considered (). Surprisingly, especially for the flask exposed closest to the source (P1-A), the RPL GD doses placed on the blood tubes, showed considerable variation between tubes and also for a given tube the three positions along with its height (). Even at 30 cm from the source, such vertical dose gradients on tubes were not expected. With a 6 cm difference between the upper and lower dosimeter on a tube at 30 cm distance, in the worst case, a dose difference of about 4% would be expected between the top and the bottom using the inverse square distance law, whereas here relative differences between maximal and minimal doses (divided by the mean dose of the tube) on each tube reach 21% (P1-AI), 10% (P1-AII), 3% (P1-AIII) and 37% (P1-MIX). Due to spatial limitations in the thermos flasks, some tubes overlapped and partial shielding can therefore be expected. For the same reason, some tubes probably had a higher distance (1.5–2 cm) from the source than other tubes. The median RPL GD doses inside the thermos flasks () ranged between 0.09 and 0.18 Gy (P1-B), 0.26 and 0.33 Gy (P3-A), 1.25 and 1.73 Gy (P4-A), or 1.54 and 2.17 Gy (P1-A). For thermos flasks equipped with single tubes, the median RPL GD doses were 0.38 Gy (P2-A), 0.10 Gy (P2-B), 0.18 Gy (P3-B) and 0.05 Gy (P4-B). The corresponding dose rates can be found in . The lowest RPL GD dose corresponded to the shielded samples on P4, located lateral to the source (P4-B) and the highest dose to the closest sample (P1-A). Due to the heterogeneity of the RPL GD doses between tubes within one sample, the biological dose estimates from each tube were compared to the median RPL GD doses corresponding to a particular tube. The median RPL GD reference dose was used instead of the mean because it is more robust against single outliers.
General information on results provided by participants
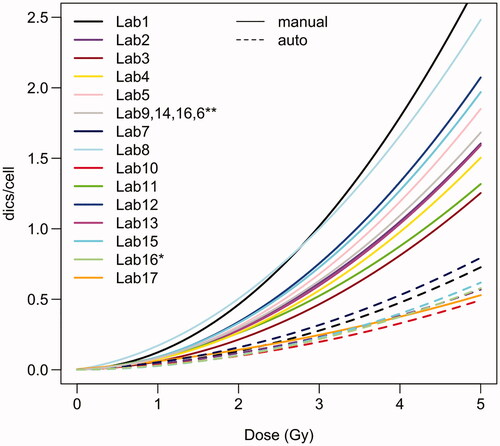
In total 19 laboratories agreed to participate in this exercise. One laboratory did not send any results and one laboratory sent only dicentric counts without dose estimates. Thus, results on dose estimates were available for 17 laboratories and 16 laboratories provided the results before the participants were told the blinded RPL GD reference doses. From the 17 laboratories providing full dose estimates, 11 laboratories (65%) provided only manually scored results, 4 laboratories (23%) provided manually and semi-automatically scored results and 2 laboratories (12%) provided only semi-automatically scored results. Almost all participants scored at least the requested 500 manually or 1500 semi-automatically scored cells. Only some laboratories manually scored less than 500 cells for some of the samples: Lab2 (P1-A: 472 cells), Lab9 (P3-A: 306 cells; P4-A: 113 cells; P1-MIX: 143 cells) and Lab11 (P3-A: 249 cells; P4-A: 428 cells). Similarly, some laboratories semi-automatically scored less than 1500 cells for some samples: Lab1 (P3-B: 1194 cells; P2-MIX: 726 cells), Lab7 (P1-A: 1283 cells; P1-B: 1496 cells; P3-A: 1176 cells; P1-MIX: 855 cells), Lab10 (P1-A: 1161 cells), Lab15 (P1-A: 1363 cells; P1-B: 1318 cells; P3-A: 1482 cells; P4-A: 1323 cells; P1-MIX: 1172 cells). 14/17 (82%) laboratories used their own calibration curve for dose estimation, 3/17 (18%) did not use their own calibration curve and used the curve provided in the IAEA manual (Barquinero et al. Citation1995; IAEA Citation2011), one laboratory used the curve described in (Vaurijoux et al. Citation2009) for dose estimation based on semi-automatically scored data. A new software tool was introduced for this exercise and participants were asked to perform the dose estimation with the new software. 7/17 laboratories used only the new Biodose Tools software (Hernández et al. Citation2019), 4/17 laboratories used CABAS (Deperas et al. Citation2007) and Biodose Tools, 3/17 used Dose Estimate (Ainsbury and Lloyd Citation2010) and Biodose Tools, 2/17 laboratories used only Dose Estimate and 1/17 laboratories used only CABAS for dose estimation. The calibration curves of the participants showed considerable variation (). As expected, the calibration curves based on semi-automatic scoring were generally much lower than the manually scored curves. One laboratory (Lab8) used the FISH (telomere/centromere) staining method for the analysis of dicentric chromosomes. The curve provided by Lab17 for manual scoring was much lower compared to all other curves. The exact reasons remain unknown, as the curve is relatively old and was prepared by another group.
Figure 2. Calibration curves used by the participating laboratories. For dose estimation based on manual scoring, laboratories 6, 9, 14 and 16 used curves from (Barquinero et al. Citation1995). For dose estimation based on semi-automatic scoring, laboratory 16 used the curve described in (Vaurijoux et al. Citation2009). Curves based on manually or semi-automatically counted data are shown by solid or dashed lines, respectively.
Homogeneous exposure scenarios
In total, blood samples from eight thermos flasks simulated various situations of a supposedly homogeneous exposure with different doses. One part of the samples (ILC samples) was evaluated by all participants (P1-A, P1-B, P3-A, P4-A) and another part of the samples only by single laboratories (P2-A, P2-B, P3-B, P4-B) (). This design was chosen to limit the workload for the participants while providing at least one DCA dose estimate for each sample for later comparisons with estimates from other materials. While the coefficient of variation (CV) of the RPL GD estimates was lower compared to the biological dose estimates for the low dose points P1-B (0.30 vs 0.98) and P3-A (0.12 vs 0.38), the CV was similar for the biological and RPL GD estimates for the high dose points P1-A (0.16 vs 0.16) and P4-A (0.17 vs 0.14). All the provided DCA dose estimates identified P1-A as the sample with the highest and P4-A as the sample with the second-highest dose ( and ). The remaining samples were always identified as low-dose samples (≤0.6 Gy by all laboratories). For ILC samples with reference doses <1 Gy, 95% (P1-B) and 90% (P3-A) or 95% (P1-B) and 100% (P3-A) of the dose estimates for manual & semi auto-scoring were within ±0.25 Gy or ±0.5 Gy of the median RPL GD reference dose, respectively ( and ). For ILC samples with reference doses >1 Gy, 40% (P1-A) and 65% (P4-A) or 95% (P1-A) and 100% (P4-A) of the whole body dose estimates were within ±0.25 Gy or ±0.5 Gy of the median RPL GD reference dose, respectively ( and ). The median RPL GD reference dose was included in 90% (P1-B), 75% (P3-A), 50% (P1-A) and 55% (P4-A) of the CI’s estimated based on the DCA (). For the samples evaluated by single laboratories, almost all (4/5) provided biological dose estimates included the median RPL GD reference dose in the estimated 95% CI’s and were within ±0.25 Gy ( and ). All dose estimates were within ±0.5 Gy of the median RPL GD reference dose.
Figure 3. RPL GD reference vs DCA dose estimates. (A) DCA dose estimates based on the assumption of an acute exposure. (B) DCA dose estimates based on the assumption of a protracted exposure considering the exposure times of each sample. Boxplots show the median and quartiles of the DCA dose estimates for each blood tube. Red dots indicate semi-automatically and blue dots manually scored DCA results. The DCA results of Lab17 (gray dots) were provided after the blind doses were distributed to the participants and are not considered in the evaluations. The RPL GD reference doses of each blood tube (2–3 replicates per tube) and the corresponding median values are shown by orange crosses and orange horizontal lines, respectively. Green rectangles show an interval of ±0.25 Gy around the median RPL GD reference dose of each tube.
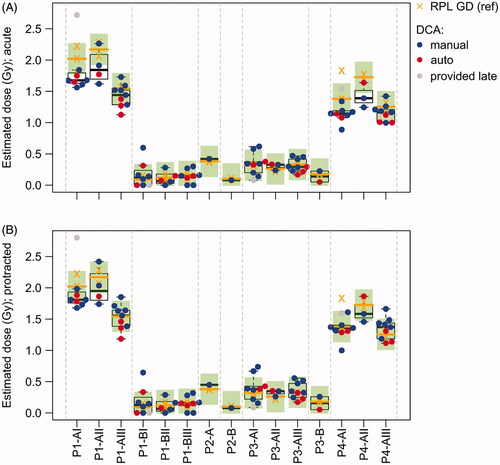
Table 2. DCA dose estimates from all participating laboratories (rows) for blood samples (columns) from all thermos flasks.
Table 3. Percentage of DCA dose estimates (manual and semi-automatic scoring) for the ILC samples evaluated by the RENEB participants, including the median RPL GD reference dose in the 95% CI, within an interval of ±0.25 Gy or ±0.5 Gy or including 0 Gy in the estimated 95% CI.
For samples P3-A (5%), P1-A (0%) and P4-A (0%), most of the estimated 95% CI’s did not include 0 Gy and a significant exposure could therefore be detected (). However, as expected from the detection limit of the DCA, for sample P1-B with median RPL GD reference doses between 0.09 and 0.18 Gy, 70% of the estimated 95% CIs included 0 Gy, for semi-automatic as well as for manual scoring. Similarly, the manually scored estimate from P2-B and the semi-automatically scored estimate from P3-B included 0 Gy in the estimated 95% CI and could therefore not significantly be distinguished from the background (). This result strongly suggested that the scored cell numbers (500–755 for manual and 1318–4318 for semi-automatic scoring) were not sufficient to significantly distinguish such low doses, close to the detection limit of the DCA, from the background level.
Estimates accounting for exposure time
For samples P1-A and P4-A, the biological dose estimates based on the assumption of an acute exposure were systematically lower than the RPL GD dose estimates (). The median deviation from the RPL GD reference dose was −0.26 (P1-A) and −0.22 Gy (P4-A). In total, 85% (P1-A) and 90% (P4-A) of the biological dose estimates were lower than the median RPL GD reference doses. Interestingly, this effect seemed to be more pronounced for some blood tubes. For instance, for tube P1-AI the 95% CI’s included the median RPL GD reference dose for only 29% of the biological dose estimates and the median deviation was −0.35 Gy. In contrast, for tube P1-AIII 67% of the biological dose estimates included the median RPL GD reference dose in the 95% CI and the median deviation was −0.10 Gy. One possible explanation for the systematic ‘underestimation’ might be the protracted exposure of the samples (1 h for setup 1 and 2.5 h for setup 2). The participating laboratories were only asked to provide dose estimates based on an acute exposure scenario and were not informed about the exposure times. However, low dose rates resulting in prolonged exposure times have the effect of a decreased frequency of dicentric chromosomes at higher doses. By Re-estimating the DCA doses with considering exposure time, the ‘underestimation’ was partly corrected () and the percentage of dose estimates within ±0.25 Gy increased to 70% (P1-A) and 85% (P4-A). In addition, the median deviation from the RPL GD reference doses improved for P1-A (−0.15 Gy) and P4-A (−0.01 Gy).
Dose heterogeneities within thermos flasks
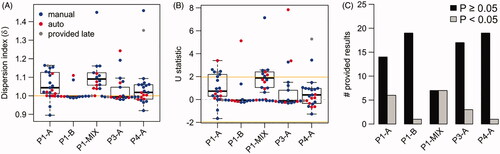
The RPL GD doses inside the thermos flasks ( and ) showed relatively high inter-tube heterogeneity for samples with reference doses >1 Gy (P1-A and P4-A). In line with this result, the biological dose estimates from tube P1-AIII were significantly (p < .05) lower than the estimates from tubes P1-AI and P1-AII (Supplementary Figure 1). A similar trend for inter-tube differences with the same pattern for RPL GD and DCA doses was observed for sample P4-A (Supplementary Figure 1). In summary, the similarity of the inter-tube heterogeneity observed for the reference doses and the biological dose estimates strongly suggest that tubes from these samples were not all exposed to the same doses, very likely due to partial shielding and/or differences in the positioning of the tubes inside the thermos flasks. Moreover, for sample P1-A a relatively high intra-tube heterogeneity of RPL GD reference dose estimates was observed between the dosimeters placed at each tube (). For dicentric counts, overdispersion (variance > mean) is commonly considered as a strong indicator of an inhomogeneous exposure (IAEA Citation2011). Therefore, dispersion analysis was performed on the ILC samples to evaluate whether intra-tube heterogeneities can also be detected for the DCA. This analysis indicated a heterogeneous exposure for 30% (P1-A), 5% (P1-B), 15% (P3-A), and 5% (P4-A) of the results (). Especially for sample P1-A, most estimates (80% with dispersion index δ > 1) indicated a strong tendency for overdispersion () and δ showed a significant location shift from 1 (Wilcoxon test, p = .005). In concordance with the results from the RPL GDs, this is a strong indication of an inhomogeneous exposure within tubes of sample P1-A. The median of δ was comparable between tubes of sample P1-A and the tubes did not show a significant difference in dispersion levels (Kruskal–Wallis test p = .39), indicating that this effect is independent of the blood tube.
Figure 4. Dispersion analysis for all samples analyzed by RENEB members. (A) Dispersion index for all samples. Dispersion index of 1 (horizontal orange line) indicates that the counts approximately follow a Poisson distribution. (B) U test statistic for all samples. For results with U > 1.96 the null hypothesis of equi-dispersion (Poisson assumption) can be rejected at the two-sided 5% significance level, indicating a heterogeneous exposure. Red dots indicate semi-automatically and blue dots manually scored results. The results of Lab17 (gray dots) were provided after the blind doses were distributed to the participants and are not considered in the evaluations. (C) Number of provided results with significant (p < .05, gray bar) or non-significant (black bar) U test.
If partial body dose estimates were used for dicentric counts showing a significant indication (U > 1.96) for an inhomogeneous exposure, the doses would generally be overestimated for these false-positive samples (Supplementary Figure 2). For low dose points, P1-B and P3-A the over-estimation of the dose is quite pronounced. Interestingly, for the low dose samples P1-B and P3-A, 3/4 of the false-positive results were semi-automatically scored. For P1-B, P3-A and P4-A all laboratories observing U > 1.96 provided partial as well as whole-body dose estimates. For P1-A two of the laboratories observing U > 1.96 estimated only partial body doses, one laboratory only whole-body doses and the remaining laboratories partial as well as whole-body doses. If partial body dose estimates were used for all samples with U > 1.96, for the low dose points 90% (P1-B) and 80% (P3-A) or 90% (P1-B) and 85% (P3-A) would be within ±0.25 Gy or ±0.5 Gy, respectively. For the higher dose points, 45% (P1-A) and 60% (P4-A) or 80% (P1-A) and 95% (P4-A) would be within ±0.25 Gy or ±0.5 Gy, respectively.
Heterogeneous exposure scenarios
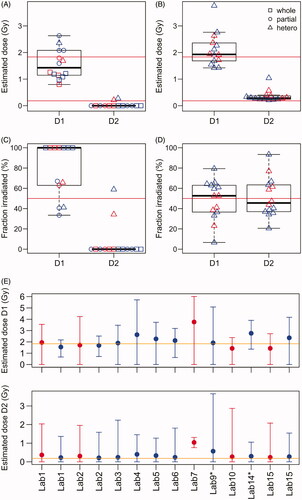
Samples P1-MIX, P2-MIX, P3-MIX and P4-MIX simulated heterogeneous exposures with two different doses by mixing blood from samples located at the different positions of each particular phantom in a 50:50 ratio. While sample P1-MIX was evaluated by 11 participating laboratories, the remaining mixture samples were only evaluated by single laboratories. For sample P1-MIX, the participants were not informed that blood was mixed for this sample. The median RPL GD reference doses of the single samples used for the 50:50 mixtures were 1.91 vs 0.18 Gy (P1-MIX), 0.38 vs 0.1 Gy (P2-MIX), 0.26 vs 0.18 Gy (P3-MIX) and 1.73 vs 0.05 Gy (P4-MIX). For samples analyzed by single laboratories, significant evidence for a heterogeneous exposure could only be detected for P4-MIX. The sample was evaluated by Lab10 by applying a statistical method assuming a partial body exposure, that is, one part of the body was irradiated while the other part was not irradiated, suggesting that 25% of the cells were irradiated with a dose of 2.06 Gy (). Re-estimating the doses with an algorithm (Pujol et al. Citation2016) based on the assumption that the body was exposed to a mixture of two different doses led to a relatively strong underestimation of dose D1 (0.54 Gy), overestimation of dose D2 (0.40 Gy) and biased estimation of the fraction irradiated by dose D1 (99%). The algorithm showed convergence problems for sample P4-MIX, indicating that the differences between the two doses and/or the number of analyzed cells were too low. For samples P2-MIX and P3-MIX, the doses used for the mixtures were too low (<0.5 Gy) to detect a heterogeneous exposure. However, the averaged RPL GD reference doses of the samples (P2-A and P2-B or P3-A and P3-B) used for P2-MIX or P3-MIX were within the 95% CI of the biological whole-body dose estimate.
Table 4. Dose estimates based on the DCA for 50:50 mixture samples simulating a heterogeneous exposure.
For sample P1-MIX, dicentric counts indicated overdispersion (δ > 1, ) for all of the provided estimates. However, significant overdispersion (U > 1.96) was only detected for 7/14 (50%) of the provided estimates (), indicating too low statistical power due to insufficient sample size. As expected, laboratories that calculated only whole-body doses generally underestimated the higher dose D1 (RPL reference 1.91 Gy) and estimated doses between 0.8 and 1.1 Gy (). All laboratories observing U > 1.96 provided partial body dose estimates and two laboratories provided estimates for a heterogeneous exposure with two different doses (). Partial body/heterogeneous doses were provided with confidence intervals by 4 laboratories. One laboratory did not provide confidence intervals and an estimate of the fraction of irradiated cells. Based on estimates provided by each of the laboratories ( and ), the median deviation from the higher RPL GD reference dose (D1) was −0.48 with an IQR (Interquartile-range) of 0.85. For 57% of the estimated doses, the absolute difference to the reference dose of D1 was more than 0.5 Gy, 50% showed underestimation and were more than 0.5 Gy lower and 7% showed overestimation and were more than 0.5 Gy higher than the RPL GD reference dose. Regardless of the U test statistic, dose estimates assuming a heterogeneous exposure with two different doses were re-calculated afterward at BfS for sample P1-MIX (results can be found in ), to assess whether the doses could theoretically be successfully estimated based on the method described in (Pujol et al. Citation2016) and to validate the new implementation of an algorithm for this type of estimation within the Biodose Tools software (Hernández et al. Citation2019). The median deviation from the reference dose of D1 was 0.018 with an IQR of 0.64, indicating an improvement in dose assessments. For 21% of the results, D1 was overestimated by more than 0.5 Gy and no laboratory underestimated D1 by more than 0.5 Gy. The lower dose D2 was slightly over-estimated in the case of estimation of the heterogeneous exposure with two doses (). The estimated fractions of the body irradiated were relatively variable between the laboratories, ranging from 7% to 79% with a median of 53% and an IQR of 26% for dose D1 (). The 95% confidence intervals provided for the heterogeneous dose estimates were very wide (), indicating that the sample size was too low to resolve this exposure scenario.
Figure 5. Dose estimates for the heterogeneous exposure simulated by sample P1-MIX. (A) Dose estimates provided by each laboratory. (B) Heterogeneous dose estimates re-calculated with the Biodose Tools software. (C) The estimated fraction of the body irradiated for the two doses as estimated by each laboratory. (D) The estimated fraction of the body irradiated for the two doses re-calculated with the Biodose Tools software. (E) Dose estimates for heterogeneous exposures with 95% confidence intervals estimated with the Biodose Tools software. In all sub-panels red color indicates semi-automatically and blue color manually scored results.
Discussion
Typically, in the community of biological dosimetry, ILCs are performed under controlled laboratory conditions and the sources for uncertainties are relatively well known. In a real-life scenario, the situation is often much more complicated and additional uncertainties are introduced due to environmental conditions, exposure geometries, shielding, unknown dose rates, or heterogeneous exposures. Therefore, in addition to ILCs under controlled laboratory conditions, field exercises that more closely resemble a real-life exposure are required to test the validity of different methods for retrospective dosimetry, to identify logistic problems, and to test the ability of network members to provide valid results. The EURADOS/RENEB field exercise performed in Lund, Sweden in October 2019 simulated a small-scale exposure scenario by irradiating four phantoms placed in different geometries to a 1.36 TBq 192Ir-source (Waldner et al. Citation2021). The phantoms were equipped with a variety of materials to perform biological and physical retrospective dosimetry, including blood samples used for the assessment of doses based on the DCA. Dose estimates were provided by 17 RENEB partner laboratories, including results from the manual as well as from semi-automated scoring. In general, good reproducibility of results between RENEB partner laboratories was observed, for manual as well as for semi-automatic scoring (), suggesting a high degree of harmonization between the participants. This is in line with results from other exercises performed in the frame of RENEB suggesting that increasing standardization of laboratory practices and training of partner laboratories significantly improved the harmonization between laboratories (Gregoire et al. Citation2017; Oestreicher et al. Citation2017; Romm et al. Citation2017; Gregoire et al. Citation2021). In particular, for the samples exposed to doses <1 Gy (distant, partly shielded) the dose estimates provided by the participants were in very good agreement with the RPL GD reference doses, that is, for all ILC samples at least 95% of the estimates were within ±0.5 Gy of the reference dose and after accounting for exposure time at least 70% were within ±0.25 Gy. For the very low dose samples (<0.2 Gy), the cell numbers were presumably too low to significantly distinguish the dose from the background level in all cases; especially for sample P1-B, 70% of the estimated 95% CI’s included 0 Gy. Assuming a background rate of 0.001 dicentrics/cell and a true dose of 0.1 Gy, a false negative rate (i.e. estimates that could not significantly be distinguished from background) of ∼70% or ∼50% would be expected for 500 manually or 1500 semi-automatically scored cells, respectively. Thus, the results for P1-B are in the expected range given the low dose and the number of cells scored. Despite the dose estimates for samples exposed to doses >1 Gy (close to the source) were relatively homogeneous between laboratories, that is, the coefficient of variation was relatively low, the biological estimates were systematically lower than the RPL GD reference doses. One possible explanation for this systematic bias might be, that the exposure was protracted over 1 and 2.5 h. The participating laboratories were only asked to provide dose estimates based on an acute exposure scenario and were not informed about the exposure times. However, low dose rates resulting in prolonged exposure times have the effect that a first DNA lesion produced by one track can be repaired before a second lesion produced by a second track can occur. As two lesions on two different chromosomes close together are required for the formation of dicentric chromosomes, increased exposure times can lead to a lower number of dicentric chromosomes. The latter mainly influences the dicentric rates at higher doses, where the probability of lesions formed by two separate tracks increases. To consider exposure time for dose estimates based on the DCA, the linear-quadratic coefficient of the calibration curve was modified by the G-function approach (Lea and Catcheside Citation1942; Lloyd et al. Citation1984; Bauchinger et al. Citation1979; IAEA Citation2011). Assuming a mean lifetime of breaks of 2 h, the quadratic coefficient would theoretically be reduced to 85% and 68% for a 1 h and 2.5 h exposure time, respectively. This would theoretically result in an expected underestimation of approximately 0.09–0.15 Gy for sample P1-A and 0.14–0.26 Gy for sample P4-A for the dose rates used in this study. Compared to the RPL GD reference doses, the initially provided biological dose estimates without considering protraction deviated in the median by −0.26 Gy and −0.22 Gy for samples P1-A and P4-A, respectively. After considering protraction, the deviation from the reference doses (P1-A: −0.15 Gy; P4-A: −0.01 Gy) improved considerably, but a certain degree of underestimation was still observed for sample P1-A. Thus, considering exposure time could partly correct the observed underestimation and informing the participants about exposure times a priori would have considerably improved the provided dose estimates. It should be noted that other factors, for example, related to the reference doses or sample preparation might also contribute to the observed bias, especially as the RPL GD reference doses were quite variable.
Due to spatial limitations within the thermos flasks, there were probably effects related to the positioning of the tubes (e.g. partial shielding, different distances between tubes, variation in the orientation of RPL GD dosimeters) that lead to the observed heterogeneities of RPL GD doses within one tube and between tubes, especially for doses >1 Gy. Unfortunately, the exact positioning of the tubes in the thermos flasks was not recorded and it is, therefore, difficult to determine the exact reasons for the observed variability. The heterogeneities of RPL GD doses observed for most tubes of the closest sample (P1-A) were very consistent with the fact that the dicentric results from several laboratories indicated a trend for a heterogeneous exposure. Theoretically, at a greater distance, these effects have a lesser impact on the distribution of the dose in the tube, as can be seen from the measured doses. In fact, the smallest variation is observed for the longest distance. A study using the Monte Carlo particle transport code is intended to explore the origin of just such a discrepancy. The possibility of dosimeter coding errors cannot fully be excluded, especially as some unreasonable outlier doses were observed, while the measured doses cannot reasonably be questioned. Interestingly, for sample P1-A, the underestimation was more pronounced for results from two blood tubes showing RPL GD doses of approximately 2 Gy compared to results from one blood tube with approximately 1.5 Gy. The reason for this observation remains unknown. In general, a relatively high heterogeneity has been observed for the RPL GD doses and was confirmed by the DCA results for samples irradiated with doses >1 Gy and irradiated closest to the source. Taken together, these results indicate an inhomogeneous exposure of the tubes from sample P1-A, very probably related to the positioning of tubes in the flask, this effect becoming significant close to the source.
In addition to simulating homogeneous exposures, samples from this exercise were used to simulate an exposure with two different doses by mixing blood in a 50:50 proportion. Methods for the estimation of two doses from a heterogeneous exposure were only recently developed (Pujol et al. Citation2016). Therefore, the most commonly used software tools for biological dosimetry (Deperas et al. Citation2007; Ainsbury and Lloyd Citation2010) do not provide methods to obtain estimates for this exposure scenario. However, during this exercise, a recently developed software tool (Hernández et al. Citation2019) was used, which enables the estimation for a heterogeneous exposure with two different doses. Sample P1-MIX was a 50:50 mixture of blood irradiated with ∼2 Gy and ∼0.2 Gy. Although the results from all laboratories indicated a trend for overdispersion, significant evidence for a heterogeneous exposure was only detected by 50% (manual scoring: 56%; semi-automatic scoring: 40%) of the provided results, strongly suggesting that 500 manually scored cells or the 900–2700 automatically scored cells are not sufficient to detect a non-homogeneous exposure with sufficient sensitivity. Assuming that the first dose was between 0.17 and 0.20 Gy and the second dose between 1.5 and 2.1 Gy, it can be expected from computational simulations that for 500 manually scored cells between 8% and 55% and for 1500 semi-automatically scored cells between 60% and 80% of the tests would have a false negative result, that is, the tests would falsely suggest a homogeneous exposure. Hence, the observed numbers of false-negative results are in the expected range for the number of cells scored for this exercise. Most of the laboratories that detected the heterogeneous exposure did not provide estimates for a mixture of two different doses but provided partial body dose estimates, assuming that only a part of the body is irradiated, which results in underestimation of the lower dose and overestimation of the higher dose. In a real-life scenario, it will generally be very difficult to distinguish between a partial body exposure and an exposure of two or more different doses. To test whether the two heterogeneous doses could theoretically be successfully estimated for the given exposure scenario, the Biodose Tools software (Hernández et al. Citation2019) was used to perform the estimation based on the results provided by the participants. The results suggested that the point estimates for most laboratories were close to the reference doses. However, the estimated 95% CIs were very wide, and the convergence of the estimation algorithm was often poor. In comparison to Pujol et al. Citation2016, the separate doses used for the mixtures during this exercise were very low, thus, revealing some of the limits of the algorithm. More research will be required to validate methods for the estimation of confidence intervals and to determine the minimum requirements (e.g. cell number, fraction irradiated and doses) to obtain meaningful estimates for this exposure scenario.
Uncertainty estimation is a central part of dose estimation and laboratories use several different software tools for uncertainty estimation. Some of these tools only consider parts of factors required for uncertainty estimation and support or the possibility for updates is no longer possible. Therefore, within RENEB, a new open-source software, the Biodose Tool (Hernández et al. Citation2019), was developed on the basis of the statistical programming language R, to harmonize the dose and uncertainty estimation, to enable the usage and implementation of the most up-to-date methods, to provide a well-documented software and to provide the programming code to the community. This software was successfully tested during this exercise and will be provided to the international community of biological dosimetry in the future.
Based on the current recommendation for biological dosimetry, each laboratory should use its own calibration curve to avoid uncertainties introduced due to differences in SOPs and scoring criteria (Wilkins et al. Citation2008; IAEA Citation2011). While most laboratories used their own calibration curves, some laboratories used calibration curves published by other groups (Barquinero et al. Citation1995; Vaurijoux et al. Citation2009). In line with (Wilkins et al. Citation2008; Oestreicher et al. Citation2017; Gregoire et al. Citation2021) a considerable degree of heterogeneity was observed between calibration curves of the participants. This might be due to different experimental setups (e.g. telomere/centromere staining), irradiation conditions (e.g. air kerma vs water, temperature, radiation quality, dose rate) (Trompier, Baumann, et al. Citation2016), technical equipment or scoring criteria used for the establishment of the calibration curves. As already described in (Romm et al. Citation2013), semi-automatically scored calibration curves showed lower numbers of dicentrics/cell than manually scored curves. The comparison of calibration curves revealed that the curve from Lab17 showed much lower dicentric counts than all other laboratories, leading to strongly overestimated doses for samples irradiated with doses >1 Gy. After correspondence with Lab17 it turned out, that the calibration curve was relatively old and prepared by another group. If the publicly available calibration curve from (Barquinero et al. Citation1995; IAEA Citation2011) had been used, the resulting dose estimates would have been in the range of the estimates from the other participants. This clearly demonstrated that intercomparisons between laboratories can reveal problems and help to find solutions. In general, the heterogeneity in the provided calibration curves suggested that each laboratory should still use its own calibration curves for dose estimations. However, this approach will only be valid, if the scoring in each laboratory is performed according to that used to construct the calibration curve. To ensure this, in addition to ILCs, each laboratory should also carry out regular intra-laboratory comparisons, especially, in the case of changes in technical equipment or staff members (ISO19238 Citation2014).
Due to the fact that this exercise was performed in the open air, under realistic field conditions with limited infrastructure and lab equipment, several additional sources for uncertainties were introduced. For instance, the weather was relatively cold and windy, and it was therefore not possible to keep the blood samples at a constant temperature of 37 °C in the thermos flasks. In particular, for the second irradiation setup with an exposure time of 2.5 h, the water temperature dropped by 5.8–11.6 °C during the time of exposure. However, for most of the exposure time, the temperature was above 30 °C and always above 25 °C and the expected effect on the number of dicentric chromosomes is therefore probably negligible (Gumrich et al. Citation1985). Moreover, an exact fixing of the tubes in the thermos flasks was not possible, complicating the analysis of factors leading to heterogeneities in the reference doses. The setup of the irradiation scenarios (e.g. closeness to the source, placement of the tubes in thermos flasks) might lead to additional heterogeneities in the absorbed doses. Due to differences in the absorbed doses between blood tubes within one sample and the generally high heterogeneities and uncertainties of the reference doses within and between tubes of one sample, the results were not classified into ‘satisfactory’ and ‘unsatisfactory’ based on Z scores as recommended in (ISO5725 Citation1998; ISO13528 Citation2015) and applied in many ILCs in the past (Di Giorgio et al. Citation2011; Wilkins et al. Citation2015; Oestreicher et al. Citation2017). For the same reasons, a direct comparison of the results from the participants was only partly possible. Furthermore, fixed cell suspension from the different blood tubes from one thermos flask was prepared and then sent to the participants by three different laboratories and it is therefore not possible to analyze whether differences between blood tubes of a sample originate from differences in the absorbed dose or from differences in sample preparation between BfS, PHE and IRSN. For logistic reasons, the participants only received fixed cell suspension. Thus, the step of the preparation of the blood samples by every single laboratory is not part of the comparisons from this exercise. Prior to the exercise, the exact doses for each sample were not exactly known and it was, therefore, difficult to exactly evaluate the number of cells that would be required to estimate the heterogeneous exposure or the lower doses with sufficiently high sensitivity. Despite all these limitations, the data suggested that the DCA also performs well, under these difficult conditions. One of the main benefits of an exercise with many participating laboratories is that it enables observations that would not be possible based on data from a single laboratory. For instance, the heterogeneities observed for sample P1-A, the systematic underestimation for samples with doses >1 Gy or the problems regarding the calibration curve initially applied by Lab17 would probably not have been revealed based on the results from one single laboratory.
The members of RENEB and EURADOS WG10 together provide a source of strong expertise in various methods of biological and physical retrospective dosimetry. This enabled a field exercise where numerous different methods for retrospective dosimetry could be applied in parallel, tested and compared. One of the major future aims of this exercise is the integration of data from different assays to assess the validity of the estimates and to understand the exposure scenario based on the combination of multiple data sources. The results from the RPL GD doses for the blood tubes and the corresponding DCA results already raise very interesting research questions regarding the exposures. For instance, what are the reasons for the observed dose heterogeneities or for the underestimation of doses from sample P1-A if protraction can only partly explain the observation? One could speculate that the RPL GD doses reported might not be sufficient to correctly estimate the average dose in a blood tube, especially when the missing dosimeters and identified outliers are taken into account. The combination of the results from the different methods for dose estimation and the close collaboration of biologists and physicists can possibly shed light on these questions. This exercise also showed that further research is required regarding the limits (i.e. cell numbers, doses, fraction irradiated) and the methods for uncertainty estimation in the case of a heterogeneous exposure with two different doses. To keep and to further improve the high level of harmonization between RENEB laboratories, regular ILCs will still be performed in the future. The heterogeneity of calibration curves between RENEB laboratories raises the question if all laboratories use appropriate calibration curves and if laboratories actually score in concordance to the applied calibration curve. The answer to this central question is beyond the scope of this exercise and it might be the focus of a future ILC within the frame of RENEB to validate the setup used for establishing calibration curves under controlled laboratory conditions.
In summary, this exercise showed that most participating laboratories are able to provide valid dose estimates based on the DCA, under difficult conditions closely resembling a real-life exposure scenario. For the DCA as a very robust method for dose estimation, this exercise had elements of an ILC, that is, comparing the performance of laboratories for a given assay, and also of a scientific exercise, that is, to validate an assay for a given research question. The data seems to reveal unexpected heterogeneities for samples simulating a homogeneous exposure, especially for the samples very close to the source. More research will be required to shed light on the reasons for the observed heterogeneities. The present exercise also showed some limits of the DCA regarding the sensitivity of estimates from single laboratories for doses <0.2 Gy or for the estimation in the case of exposure with two different doses. On the whole, biological dose estimates are a very valuable component in understanding the exposure conditions and the absorbed doses. Due to the close collaboration of RENEB and EURADOS WG10, this exercise enables a direct comparison of biological and physical methods for retrospective dosimetry for the same exposure scenario. The integration of the data from several different physical and biological dosimeters will provide new exciting approaches to obtain a detailed picture of complex exposure situations. These aspects will be further investigated in separate publications in the frame of the RENEB/EURADOS field exercise.
Author contributions
LW, EA, CW, UO, UK, AW organized and conducted the field test. FT and YR performed experiments and estimation on RPL GD reference doses. SB, JSM, UO, EG, JM prepared fixed cell suspension. UO, JM, SB, EG, JSM, CB, AV, JFB, SS, KL, RH, AM, MM, OMG, MV, LB, OS, LS, MJP, MMS, AT, CP, GT, ST and RH provided dose estimates based on the DCA. AH implemented and provided the Biodose Tools software for dose estimations based on the DCA. DE did the statistical evaluation of the ILC results and wrote the manuscript. All authors reviewed and revised the manuscript.
Acknowledgments
This work was partly supported by European Radiation Dosimetry Group Working Group 10 (EURADOS WG 10), by Running the European Network of Biological and retrospective Physical dosimetry (RENEB) and by Public Health England (PHE). The authors thank all technical staff involved in this exercise for their great contribution to the experimental work.
Disclosure statement
The authors declare that they have no conflict of interest. The views expressed are those of the authors and not necessarily those of PHE.
Additional information
Notes on contributors
David Endesfelder
David Endesfelder, PhD, Biomathematician, section: Biological Dosimetry, Federal Office for Radiation Protection (BfS), Oberschleissheim, Germany.
Ursula Oestreicher
Ursula Oestreicher, PhD, Biologist and Head of the Section: Biological Dosimetry, Federal Office for Radiation Protection (BfS), Oberschleissheim, Germany.
Ulrike Kulka
Ulrike Kulka, PhD, biologist and head of the section: National and International Cooperation, Reporting, Federal Office for Radiation Protection (BfS), Oberschleissheim, Germany.
Elizabeth A. Ainsbury
Elizabeth A. Ainsbury, PhD, MInstP MSRP CSci, Principal Radiation Protection Scientist and Cytogenetics Group Leader, Public Health England Center for Radiation, Chemical and Environmental Hazards (PHE CRCE), UK.
Jayne Moquet
Jayne Moquet, PhD, Principal Radiation Protection Scientist, Public Health England, Cytogenetics and Pathology Group, Chilton, UK.
Stephen Barnard
Stephen Barnard, PhD, Senior Radiation Protection Scientist, Public Health England, Cytogenetics and Pathology Group, Chilton, UK.
Eric Gregoire
Eric Gregoire, Scientist, Cytogenetician in Biological Dosimetry, Institute for Radiological Protection and Nuclear Safety (IRSN), Radiobiology of Accidental Exposure Laboratory (LRAcc), Fontenay aux Roses, France.
Juan S. Martinez
Juan S. Martinez, PhD, Researcher, Institute for Radiological Protection and Nuclear Safety (IRSN), Radiobiology of Accidental Exposure Laboratory (LRAcc), Fontenay aux Roses, France.
François Trompier
François Trompier, PhD and Engineer in Nuclear Science, Physicist, Institute of Radiological Protection and Nuclear Safety (IRSN), Unit, Ionizing Radiation Dosimetry Laboratory, Fontenay-aux Roses, France.
Yoann Ristic
Yoann Ristic, Research Technician in Nuclear Science, Institute of Radiological Protection and Nuclear Safety (IRSN), Unit, Ionizing Radiation Dosimetry Laboratory, Fontenay-aux Roses, France.
Clemens Woda
Clemens Woda, PhD, Physicist, Helmholtz Zentrum Muenchen, Institute of Radiation Medicine, Germany.
Lovisa Waldner
Lovisa Waldner, MSc, Medical Physicist and PhD student, Medical Radiation Physics, Malmö, Institution of Translational Medicine, Lund University, Sweden.
Christina Beinke
Christina Beinke, PhD, Biologist, Bundeswehr Institute of Radiobiology affiliated to the University of Ulm, Munich, Germany.
Anne Vral
Anne Vral, PhD, full Professor and Head of the Radiobiology Research Group at Ghent University, Belgium.
Joan-Francesc Barquinero
Joan-Francesc Barquinero, PhD, Biologist, University Professor, Department of Animal Biology, Plant Biology and Ecology, Faculty of Biosciencies, Universitat Autònoma de Barcelona (UAB), Bellaterra (Cerdanyola del Vallès), Spain.
Alfredo Hernandez
Alfredo Hernández, MSc, Physicist and Data Scientist, Independent Researcher, London, UK.
Sylwester Sommer
Sylwester Sommer, PhD, Radiobiologist, Institute of Nuclear Chemistry and Technology (INCT), Unit: Radiobiology and Biological Dosimetry, Warsaw, Poland.
Katalin Lumniczky
Katalin Lumniczky, M.D., PhD, Radiation Biologist, National Public Health Center, Department of Radiobiology and Radiohygiene, Unit of Radiation Medicine, Budapest, Hungary.
Rita Hargitai
Rita Hargitai, PhD, Biologist, National Public Health Center, Department of Radiobiology and Radiohygiene, Unit of Radiation Medicine, Budapest, Hungary.
Alegría Montoro
Alegría Montoro, PhD in Biology and Master’s Degree in Occupational Hazard Prevention, specializing in hygiene and security. Supervisor for radioactive facilities and head of the biodosimetry laboratory in the Radiation Protection Service (RPS), University-Polytechnic Hospital La Fe,Valencia, Spain.
Mirta Milic
Mirta Milić, PhD, Molecular Biologist and Toxicologist, Institute for Medical Research and Occupational Health, Mutagenesis Unit, Zagreb, Croatia.
Octávia Monteiro Gil
Octávia Monteiro Gil, PhD, Biology-Genetic, Instituto Superior Técnico, Centro de Ciências e Tecnologias Nucleares (C2TN/IST/ULisboa), Bobadela, Portugal.
Marco Valente
Marco Valente, PhD, Biologist, Cytogenetician, French Armed Forces Biomedical Research Institute (IRBA), Lab: Biological Dosimetry Lab (LDBI), Brétigny-sur-Orge, France.
Laure Bobyk
Laure Bobyk, PhD, Biologist, French Armed Forces Biomedical Research Institute (IRBA), Lab: Biological Dosimetry Lab (LDBI), Brétigny-sur-Orge, France.
Olga Sevriukova
Olga Sevriukova, PhD, Biophysician, Radiation Protection Center (RSC), Division of public exposure monitoring, Vilnius, Lithuania.
Laure Sabatier
Laure Sabatier, PhD, Research Director, Radiobiologist with molecular cytogenetics expertise, coordinator of biology and health programs and infrastructures at the fundamental research division of the french Alternative Energies and Atomic Energy Commission (CEA).
María Jesús Prieto
María Jesús Prieto, BSc, Biological Sciences, Hospital General Universitario Gregorio Marañón (HGUGM), Biological Dosimetry, Madrid, Spain.
Mercedes Moreno Domene
Mercedes Moreno Domene, MSc in Radiation Biology, biologist, Hospital General Universitario Gregorio Marañón, Centro Radiopatología, Laboratorio Dosimetría Biológica, Madrid, Spain.
Antonella Testa
Antonella Testa, Radiobiologist, Italian National Agency for New Technologies, Energy and Sustainable Economic Development (ENEA), Department for Sustainability, Division Health Protection Technologies, Laboratory Health and Environment, Rome, Italy.
Clarice Patrono
Clarice Patrono, PhD, Biologist, Italian National Agency for New Technologies, Energy and Sustainable Economic Development (ENEA), Department for Sustainability, Division Health Protection Technologies, Laboratory Health and Environment, Rome, Italy.
Georgia Terzoudi
Georgia Terzoudi, PhD, Physicist and Radiobiologist, Director of Research at the Institute of Nuclear and Radiological Sciences & Technology, Energy & Safety, working in the Health Physics, Radiobiology & Cytogenetics Laboratory, National Center for Scientific Research ‘Demokritos’ Athens, Greece.
Sotiria Triantopoulou
Sotiria Triantopoulou, MSc, Medical Physicist, working in the Health Physics, Radiobiology & Cytogenetics Lab, National Center for Scientific Research, NCSR ‘Demokritos’, Athens, Greece.
Rositsa Histova
Rositsa Hristova, PhD, Associate Professor, Head of Radiobiology Department, National Center of Radiobiology and Radiation Protection, Bulgaria.
Andrzej Wojcik
Andrzej Wojcik, PhD, is Professor of Radiation Biology at the Stockholm University (Sweden) and Jan Kochanowski University in Kielce (Poland). Wojcik focuses on studying cellular effects of radiation, with special focus on factors influencing the radiosensitivity and on combined exposure to radiations of different qualities.
Related Research Data
References
- Abend M, Badie C, Quintens R, Kriehuber R, Manning G, Macaeva E, Njima M, Oskamp D, Strunz S, Moertl S, et al. 2016. Examining radiation-induced in vivo and in vitro gene expression changes of the peripheral blood in different laboratories for biodosimetry purposes: first RENEB gene expression study. Radiat Res. 185(2):109.
- Ainsbury EA, Badie C, Barnard S, Manning G, Moquet J, Abend M, Antunes AC, Barrios L, Bassinet C, Beinke C, et al. 2017. Integration of new biological and physical retrospective dosimetry methods into EU emergency response plans - joint RENEB and EURADOS inter-laboratory comparisons. Int J Radiat Biol. 93(1):99–109.
- Ainsbury EA, Lloyd DC. 2010. Dose estimation software for radiation biodosimetry. Health Phys. 98(2):290–295.
- Barnard S, Ainsbury EA, Al-Hafidh J, Hadjidekova V, Hristova R, Lindholm C, Monteiro Gil O, Moquet J, Moreno M, Rossler U, et al. 2015. The first gamma-H2AX biodosimetry intercomparison exercise of the developing European biodosimetry network RENEB. Radiat Prot Dosimetry. 164(3):265–270.
- Barquinero JF, Barrios L, Caballín MR, Miró R, Ribas M, Subias A, Egozcue J. 1995. Establishment and validation of a dose-effect curve for gamma-rays by cytogenetic analysis. Mutat Res. 326(1):65–69.
- Barquinero JF, Fattibene P, Chumak V, Ohba T, Della Monaca S, Nuccetelli C, Akahane K, Kurihara O, Kamiya K, Kumagai A, et al. 2021. Lessons from past radiation accidents: critical review of methods addressed to individual dose assessment of potentially exposed people and integration with medical assessment. Environ Int. 146:106175.
- Bassinet C, Woda C, Bortolin E, Della Monaca S, Fattibene P, Quattrini MC, Bulanek B, Ekendahl D, Burbidge CI, Cauwels V, et al. 2014. Retrospective radiation dosimetry using OSL of electronic components: results of an inter-laboratory comparison. Radiat Meas. 71:475–479.
- Bauchinger M, Schmid E, Dresp J. 1979. Calculation of the dose-rate dependence of the decentric yield after Co gamma-irradiation of human lymphocytes. Int J Radiat Biol Relat Stud Phys Chem Med. 35(3):229–233.
- Beinke C, Ben-Shlomo A, Abend M, Port M. 2015. A case report: cytogenetic dosimetry after accidental radiation exposure during 192Ir industrial radiography testing. Radiat Res. 184(1):66–72.
- Blakely WF, Carr Z, Chu MC, Dayal-Drager R, Fujimoto K, Hopmeir M, Kulka U, Lillis-Hearne P, Livingston GK, Lloyd DC, et al. 2009. WHO 1st consultation on the development of a global biodosimetry laboratories network for radiation emergencies (BioDoseNet). Radiat Res. 171(1):127–139.
- Brzozowska B, Ainsbury EA, Baert A, Beaton-Green L, Barrios L, Barquinero JF, Bassinet C, Beinke C, Benedek A, Beukes P, et al. 2017. RENEB accident simulation exercise. Int J Radiat Biol. 93(1):75–80.
- Deperas J, Szluinska M, Deperas-Kaminska M, Edwards A, Lloyd D, Lindholm C, Romm H, Roy L, Moss R, Morand J, et al. 2007. CABAS: a freely available PC program for fitting calibration curves in chromosome aberration dosimetry. Radiat Prot Dosimetry. 124(2):115–123.
- Depuydt J, Baeyens A, Barnard S, Beinke C, Benedek A, Beukes P, Buraczewska I, Darroudi F, De Sanctis S, Dominguez I, et al. 2017. RENEB intercomparison exercises analyzing micronuclei (cytokinesis-block micronucleus assay). Int J Radiat Biol. 93(1):36–47.
- Di Giorgio M, Barquinero JF, Vallerga MB, Radl A, Taja MR, Seoane A, De Luca J, Oliveira MS, Valdivia P, Lima OG, et al. 2011. Biological dosimetry intercomparison exercise: an evaluation of triage and routine mode results by robust methods. Radiat Res. 175(5):638–649.
- Elmiger R, Schanz U, Ott B, Frei D. 2018. Exposure of a service technician repairing a biplane X-ray system. Radiat Prot Dosimetry. 182(1):18–19.
- Fattibene P, Trompier F, Wieser A, Brai M, Ciesielski B, De Angelis C, Della Monaca S, Garcia T, Gustafsson H, Hole EO, et al. 2014. EPR dosimetry intercomparison using smart phone touch screen glass. Radiat Environ Biophys. 53(2):311–320.
- Fattibene P, Wieser A, Adolfsson E, Benevides LA, Brai M, Callens F, Chumak V, Ciesielski B, Della Monaca S, Emerich K, et al. 2011. The 4th international comparison on EPR dosimetry with tooth enamel. Radiat Meas. 46(9):765–771.
- Gregoire E, Ainsbury EA, Barrios L, Bassinet C, Fattibene P, Kulka U, Oestreicher U, Pantelias G, Terzoudi G, Trompier F, et al. 2017. The harmonization process to set up and maintain an operational biological and physical retrospective dosimetry network: QA QM applied to the RENEB network. Int J Radiat Biol. 93(1):81–86.
- Gregoire E, Barquinero JF, Gruel G, Benadjaoud M, Martinez JS, Beinke C, Balajee A, Beukes P, Blakely WF, Dominguez I, et al. 2021. RENEB InterLaboratory comparison 2017; limits and pitfalls of ILCs. Int J Radiat Biol. 1–18. doi:https://doi.org/10.1080/09553002.2021.1928782
- Güçlü I. 2021. Cytogenetic follow-up of an individual after accidental exposure to industrial radiation using dicentric frequency in blood lymphocytes. Mutat Res. 861–862:503276.
- Gumrich K, Virsip-Peuckert RP, Harder D. 1985. Temperature and the formation of radiation-induced chromosome aberrations. I. The effect of irradiation temperature. Int J Radiat Biol Relat Stud Phys Chem Med. 49:665–672.
- Hall J, Jeggo PA, West C, Gomolka M, Quintens R, Badie C, Laurent O, Aerts A, Anastasov N, Azimzadeh O, et al. 2017. Ionizing radiation biomarkers in epidemiological studies – an update. Rev Mut Res. 771:59–84.
- Hernández A, Barquinero JF, Endesfelder D, Puig P, Barrios L, Einbeck J, Benadjaoud A, Aisnbury E. 2019. Biodose tools. Department of Animal Biology, Plant Biology and Ecology Building C, Faculty of Biosciences 08193 Bellaterra (Barcelona). [accessed 2019 Nov]. https://aldomann.shinyapps.io/biodose-tools-beta/_w_7bf9e171/_w_b69c9547/
- Hoshi M, Toyoda S, Ivannikov A, Zhumadilov K, Fukumura A, Apsalikov K, Zhumadilov ZS, Bayankin S, Chumak V, Ciesielski B, et al. 2007. Interlaboratory comparison of tooth enamel dosimetry on Semipalatinsk region: part 1, general view. Radiat Meas. 42(6–7):1005–1014.
- IAEA. 2001. Absorbed dose determination in external beam radiotherapy an international code of practice for dosimetry based on standards of absorbed dose to water. Vienna (Austria): IAEA. Technical Report Series 398.
- IAEA. 2011. Cytogenetic dosimetry: applications in prepardness for and response to radiation emergencies. Vienna (Austria): EPR-Biodosimetry, International Atomic Energy Agency.
- ICRU. 2019. Methods for Initial-Phase Assessment of Individual Doses Following Acute Exposures to Ionizing Radiation. Bethesta (MD): International Commission on Radiation Units. Report No. 94.
- ISO13304. 2020a. Radiological protection—minimum criteria for electron paramagnetic resonance (EPR) spectroscopy for retrospective dosimetry of ionizing radiation—part 1: general principles. Geneva (Switzerland): ISO.
- ISO13304. 2020b. Radiological protection—minimum criteria for electron paramagnetic resonance (EPR) spectroscopy for retrospective dosimetry of ionizing radiation—part 2: ex vivo human tooth enamel dosimetry. Geneva (Switzerland): ISO.
- ISO13528. 2015. Statistical methods for use in proficiency testing by interlaboratory comparison. Geneva (Switzerland): ISO.
- ISO17099. 2014. Radiological protection—performance criteria for laboratories using the cytokinesis block micronucleus (CBMN) assay in peripheral blood lymphocytes for biological dosimetry. Geneva (Switzerland): ISO.
- ISO19238. 2014. International Organization for Standardization (ISO), radiation protection performance criteria for service laboratories performing biological dosimetry by cytogenetics. Geneva (Switzerland): ISO.
- ISO20046. 2019. Radiological protection—performance criteria for laboratories using Fluorescence In Situ Hybridization (FISH) translocation assay for assessment of exposure to ionizing radiation. Geneva (Switzerland): ISO.
- ISO21243. 2008. Radiation protection—performance criteria for laboratories performing cytogenetic triage for assessment of mass casualties in radiological or nuclear emergencies—general principles and application to dicentric assay. Geneva (Switzerland): ISO.
- ISO4037-3. 2019. Radiological protection — X and gamma reference radiation for calibrating dosemeters and doserate meters and for determining their response as a function of photon energy—part 3: calibration of area and personal dosemeters and the measurement of their response as a function of energy and angle of incidence. Geneva (Switzerland): ISO.
- ISO5725. 1998. Precision of test methods-determination of repeatability & reproducibility for a standard test method by interlaboratory tests. Geneva (Switzerland): ISO.
- Ivannikov A, Toyoda S, Hoshi M, Zhumadilov K, Fukumura A, Apsalikov K, Zhumadilov Z, Bayankin S, Chumak V, Ciesielski B, et al. 2007. Interlaboratory comparison of tooth enamel dosimetry on Semipalatinsk region: part 2, effects of spectrum processing. Radiat Meas. 42(6–7):1015–1020.
- Jaworska A, Ainsbury EA, Fattibene P, Lindholm C, Oestreicher U, Rothkamm K, Romm H, Thierens H, Trompier F, Voisin P, et al. 2015. Operational guidance for radiation emergency response organisations in Europe for using biodosimetric tools developed in EU MULTIBIODOSE project. Radiat Prot Dosimetry. 164(1–2):165–169.
- Kulka U, Abend M, Ainsbury EA, Badie C, Barquinero JF, Barrios L, Beinke C, Bortolin E, Cucu A, De Amicis A, et al. 2017. RENEB - running the European network of biological dosimetry and physical retrospective dosimetry. Int J Radiat Biol. 93(1):2–14.
- Kulka U, Wojcik A. 2017. Special issue: networking in biological and EPR/OSL dosimetry: the European RENEB platform for emergency preparedness and research. Int J Radiat Biol. 93(1):1.
- Kulka U, Wojcik A, Di Giorgio M, Wilkins R, Suto Y, Jang S, Quing-Jie L, Jiaxiang L, Ainsbury EA, Woda C, et al. 2018. Biodosimetry and biodosimetry networks for managing radiation emergency. Radiat Prot Dosimetry. 182(1):128–138.
- Lea DE, Catcheside DG. 1942. The mechanism of the induction by radiation of chromosome aberrations in Tradescantia. J Genetics. 44(2–3):216–245.
- Lloyd DC, Edwards AA, Prosser JS, Corp MJ. 1984. The dose response relationship obtained at constant irradiation times for the induction of chromosome aberrations in human lymphocytes by cobalt-60 gamma rays. Radiat Environ Biophys. 23(3):179–189.
- Lloyd DC, Purrott RJ, Dolphin GW. 1973. Chromosome aberration dosimetry using human lymphocytes in simulated partial body irradiation. Phys Med Biol. 18(3):421–431.
- Manning G, Macaeva E, Majewski M, Kriehuber R, Brzóska K, Abend M, Doucha-Senf S, Oskamp D, Strunz S, Quintens R, et al. 2017. Comparable dose estimates of blinded whole blood samples are obtained independently of culture conditions and analytical approaches. Second RENEB gene expression study. Int J Radiat Biol. 93(1):87–98.
- Moquet J, Barnard S, Staynova A, Lindholm C, Monteiro Gil O, Martins V, Rößler U, Vral A, Vandevoorde C, Wojewódzka M, et al. 2017. The second gamma-H2AX assay inter-comparison exercise carried out in the framework of the European biodosimetry network (RENEB). Int J Radiat Biol. 93(1):58–64.
- Oestreicher U, Endesfelder D, Gomolka M, Kesminiene A, Lang P, Lindholm C, Rößler U, Samaga D, Kulka U. 2018. Automated scoring of dicentric chromosomes differentiates increased radiation sensitivity of young children after low dose CT exposure in vitro. Int J Radiat Biol. 94(11):1017–1026.
- Oestreicher U, Samaga D, Ainsbury E, Antunes AC, Baeyens A, Barrios L, Beinke C, Beukes P, Blakely WF, Cucu A, et al. 2017. RENEB intercomparisons applying the conventional Dicentric Chromosome Assay (DCA). Int J Radiat Biol. 93(1):20–29.
- Pujol M, Barrios L, Puig P, Caballin MR, Barquinero JF. 2016. A new model for biological dose assessment in cases of heterogeneous exposures to ionizing radiation. Radiat Res. 185(2):151–162.
- Rojas Palma C, Woda C, Discher M, Steinhausler F. 2020. On the use of retrospective dosimetry to assist in the radiological triage of mass casualties exposed to ionizing radiation. J Radiol Prot. doi:https://doi.org/10.1088/1361-6498/abc181
- Romm H, Ainsbury EA, Barnard S, Barrios L, Barquinero JF, Beinke C, Deperas M, Gregoire E, Koivistoinen A, Lindholm C, et al. 2013. Automatic scoring of dicentric chromosomes as a tool in large scale radiation accidents. Mutat Res. 756(1–2):174–183.
- Romm H, Ainsbury EA, Barquinero JF, Barrios L, Beinke C, Cucu A, Domene MM, Filippi S, Monteiro Gil O, Gregoire E, et al. 2017. Web based scoring is useful for validation and harmonisation of scoring criteria within RENEB. Int J Radiat Biol. 93(1):110–117.
- Rühm W, Bottollier-Depois JF, Gilvin P, Harrison R, Knežević Ž, Lopez MA, Tanner R, Vargas A, Woda C. 2018. The work programme of EURADOS on internal and external dosimetry. Ann Icrp. 47(3–4):20–34.
- Tawn EJ, Curwen GB, Riddell AE. 2018. Chromosome aberrations in workers occupationally exposed to tritium. J Radiol Prot. 38(2):N9–N16.
- Terzoudi GI, Pantelias G, Darroudi F, Barszczewska K, Buraczewska I, Depuydt J, Georgieva D, Hadjidekova V, Hatzi VI, Karachristou I, et al. 2017. Dose assessment intercomparisons within the RENEB network using G0-lymphocyte prematurely condensed chromosomes (PCC assay). Int J Radiat Biol. 93(1):48–57.
- Trompier F, Baumann M, Barrios L, Gregoire E, Abend M, Ainsbury EA, Barnard S, Barquinero JF, Bautista JA, Brzozowska B, et al. 2016. Investigation of the influence of calibration practices on cytogenetic laboratory performance for dose estimation. Int J Radiat Biol. 93(1):118–126.
- Trompier F, Burbidge C, Bassinet C, Baumann M, Bortolin E, De Angelis C, Eakins J, Della Monaca S, Fattibene P, Quattrini MC, et al. 2016. Overview of physical dosimetry methods for triage application integrated in the new European network RENEB. Int J Radiat Biol. 93(1):65–74.
- Vaurijoux A, Gruel G, Pouzoulet F, Gregoire E, Martin C, Roch-Lefevre S, Voisin P, Voisin P, Roy L. 2009. Strategy for population triage based on dicentric analysis. Radiat Res. 171(5):541–548.
- Waldner L, Bernhardsson C, Woda C, Trompier F, Van Hoey O, Kulka U, Oestreicher U, Bassinet C, Raaf C, Discher M, et al. 2021. The 2019-2020 EURADOS WG10 and RENEB field test of retrospective dosimetry methods in a small-scale incident involving ionizing radiation. Radiat Res. 195(3):253–264.
- Wernli C, Eikenberg J, Marzocchi O, Breustedt B, Oestreicher U, Romm H, Gregoratto D, Marsh J. 2015. 30-y follow-up of a Pu/Am inhalation case. Radiat Prot Dosimetry. 164(1–2):57–64.
- Wieser A, Debuyst R, Fattibene P, Meghzifene A, Onori S, Bayankin SN, Blackwell B, Brik A, Bugay A, Chumak V, et al. 2005. The 3rd international intercomparison on EPR tooth dosimetry: part 1, general analysis. Appl Radiat Isot. 62(2):163–171.
- Wieser A, Debuyst R, Fattibene P, Meghzifene A, Onori S, Bayankin SN, Brik A, Bugay A, Chumak V, Ciesielski B, et al. 2006. The third international intercomparison on EPR tooth dosimetry: part 2, final analysis. Rad Protect Dosimet. 120(1–4):176–183.
- Wilkins RC, Beaton-Green LA, Lachapelle S, Kutzner BC, Ferrarotto C, Chauhan V, Marro L, Livingston GK, Boulay Greene H, Flegal FN. 2015. Evaluation of the annual Canadian biodosimetry network intercomparisons. Int J Radiat Biol. 91(5):443–451.
- Wilkins RC, Romm H, Kao T-C, Awa AA, Yoshida MA, Livingston GK, Jenkins MS, Oestreicher U, Pellmar TC, Prasanna PGS. 2008. Interlaboratory comparison of the dicentric chromosome assay for radiation biodosimetry in mass casualty events. Radiat Res. 169(5):551–560.
- Wojcik A, Oestreicher U, Barrios L, Vral A, Terzoudi G, Ainsbury EA, Rothkamm K, Trompier F, Kulka U. 2017. The RENEB operational basis: complement of established biodosimetric assays. Int J Radiat Biol. 93(1):15–19.