
Abstract
Purpose
It has long been thought that the carcinogenic effect of radiation is due to the induction of oncogenic mutations, which means that a fraction of the irradiated individuals will be affected in a dose-dependent manner. This dogma was recently challenged because it was found that the model does not properly explain the life shortening effect of radiation which is seen as a parallel shift of mouse survival curves toward younger ages following an exposure to radiation. Specifically, according to the mutation induction theory, an irradiated mouse or human population evolves into two subpopulations with different mean lifespans, which would lead to a wider distribution of individual lifespans, and hence to a shallower slope in the survival curve, which is not what is observed. Instead, the parallel shift indicates that a large fraction of the irradiated mice are affected (but there are exceptions). Thus, it was thought important to pursue how the excess risk for cancer develops following an exposure to radiation.
Method
In the present study, cancer mortality data from mice and atomic-bomb survivors is presented to understand the increasing patterns of cancer risks.
Results
In both species, it was found that cancer mortality starts to increase earlier in the exposed group.
Conclusion
The results are consistent with the notion that in many irradiated organs (but not all) radiation-induced tissue damage can lead to the development of an altered microenvironment (most probably inflammation), which is favorable to the growth of spontaneously arising tumor cells and can lead to an earlier onset of the diseases or to an apparently increased risk of cancer.
Introduction
Soon after the initiation of animal studies on radiation carcinogenesis in the 1950s and 1960s, it was recognized that an exposure to radiation shortened the life span of animals in a dose dependent manner. Further, the survival curves were often shifted parallel to the control curve toward younger ages while keeping the shape unchanged (e.g. Upton et al. Citation1960; Storer Citation1965; Fry Citation1981; Carnes et al. Citation1989). This shift was once imagined as a possible radiation effect to modify the processes of natural aging, but it was later revealed that those animals dying earlier than usual did not show general signs of natural aging except for earlier development of fatal malignancies (Walburg Citation1975). The observations contained important messages on the mechanisms of radiation carcinogenesis but were nearly forgotten except for the fact that radiation can apparently increase cancer risks. Subsequent discoveries of various oncogenes and tumor suppressor genes had made the oncogenic mutation theory appropriate in radiation carcinogenesis because radiation is a well-known mutagen.
However, this theory was recently challenged because it was found to be unable to explain the parallel shift of mouse survival curves toward younger ages after an irradiation (Nakamura Citation2020). This is because the oncogenic mutation theory hypothesizes that an irradiation adds one oncogenic mutation to tissue stem cells, which have a potential to become transformed and form a tumor. This means that it affects only a fraction of the irradiated individuals in a dose-dependent manner, and thus the irradiated population would inevitably consist of two subpopulations with different mean lifespans. Such a mixed population would be expected to show a broader distribution of individual life spans, and hence automatically form a flatter or less inflected survival curve shape, and this would not generate a parallel shifted survival curve. Consequently, it is necessary to assume that an irradiation induces more robust tissue damage, including cell death, and leads to an earlier onset of a large fraction of the malignancies which eventually emerge spontaneously. In this regard, it is reminded that, although not familiar to biologists, a basic paradigm in epidemiologic thinking about risk consists of two forms of association between an exposure to radiation and cancer: excess and etiologic (Greenland and Robins Citation1988). Namely, if a cancer is caused by radiation-induced mutations, we may consider it to be an excess. In contrast, if it were associated with faster progression of spontaneously arising cancers, it would be etiologic.
The next question which arises is whether the observations made in mice can apply to humans or not. In mice, many strains were developed for the purpose of studying cancer, and consequently many of those individuals die spontaneously from cancer: more than 90% of B6C3F1 mice die from malignant tumors (Tanaka et al. Citation2007). In contrast, the fraction of people who die from cancer is much lower: it is 20 to 30% for atomic-bomb (A-bomb) survivors (Ozasa et al. Citation2012). Therefore, the possibility exists that this difference in the fraction of cancer deaths between mice and humans might reflect different mechanisms involved in radiation carcinogenesis.
The aim of the present study was to understand how excess risks for cancer develop after an exposure to radiation. Specifically, attention was focused on cancer mortality data in the early post-exposure period in both mice and humans with an expectation that there might be a clue to permit one to distinguish between the two models: an irradiation may accelerate the speed of age-related cancer mortality because irradiated cells may express genetic instability many cell generations after the initial insult (e.g. Morgan et al. Citation1996; Little Citation2000; Morgan and Sowa Citation2009), which may lead to an increased spontaneous mutation rate and cancer mortality while the latency period may remain largely unaffected. The second model assumes that irradiation may shift the mortality curve toward younger ages (Upton et al. Citation1960; Shellabarger et al. Citation1980; Fry Citation1981; Nakamura Citation2020). This model assumes that an irradiation induces gross tissue damage (e.g. inflammation) which may lead to creation of a microenvironment favorable for dormant cancer or precancerous cells to grow and form a tumor earlier than usual, which results in apparently increased cancer mortality rates when compared with that for control individuals (Nakamura Citation2020). A modified version of this explanation is that the induction of oncogenic mutations may lead to an earlier onset because the induced oncogenic mutation contributes to a multistep carcinogenesis process, and thereby shorten the time required for the complete process of spontaneous carcinogenesis (Mendelsohn Citation1996).
Materials and methods
Primary data on solid tumor mortality in mice were obtained from the Sasaki and Fukuda paper, Table 4 (Sasaki and Fukuda Citation2005). Additional mouse data was obtained from a set of reports by Tanaka et al. (Citation2003, Citation2007). Because the Tanaka papers do not contain information on solid tumor mortality, it was necessary to use the difference between the death from all neoplasms and death from malignant lymphoma ( of the Tanaka et al. paper Citation2007). Although a small number of myeloid leukemia cases would remain in the subtracted group of deaths, the two sets of mouse data can be regarded as representing nearly the same content. Specifically, the survival curves reported in the 2003 article were first used to obtain the number of mice that were alive on the first day of each 100-days observation window, and then the number of mice that dies from tumors other than malignant lymphoma during the observation window. Subsequently, the surviving number of days was summed up for each animal by assuming that the mean survival time was 50 days for those which died during the observation window, and the solid tumor mortalities (which included a small percent of myeloid leukemia cases) were calculated.
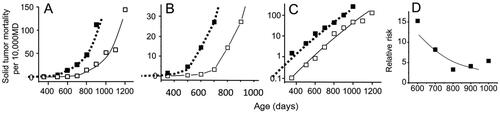
Figure 1. Solid tumor mortality in female mice irradiated with 1.9 Gy of radiation at 7 days of age (Sasaki and Fukuda Citation2005). Open symbols indicate the control group and closed symbols indicate the irradiated group. Panel A and B show a linear scale presentation while panel C shows a semi-log scale plot. Panel B is a magnified presentation of the data in the low mortality regions. The dotted lines represent shifted curves for the control group toward younger ages by 200 days. MD stands for Mouse·Days. Panel D shows a decreasing trend for relative risk with an increase in the attained age.
Cancer mortality data from A-bomb survivors were collected for survivors who were members of a 10-years-old group at the time of exposure (Ozasa et al. Citation2012). Background cancer mortality rates were obtained from control survivors (estimated dose <5 mGy) at 30–70 years of attained age. Subsequently, the mortality rates thus obtained was multiplied by the estimated relative risk values at 1 Gy (RR1Gy) at different attained ages so that the estimated cancer mortality for 1 Gy-exposed survivor could be reconstructed at different attained ages. For this purpose, excess RR (ERR) at 1 Gy (ERR1Gy) was estimated as follows. It is reported that the ERR1Gy for survivors who were exposed at age 30 and reached age 70 is 0.42 (Table 4 of Ozasa et al. Citation2012). Because the ERR is estimated to decrease by 29% with a 10-years increase in age at exposure (Ozasa et al. Citation2012), the ERR1Gy of those who were exposed to the bombs at age 10 and reached age 70 is expressed as 0.42/(1 − 0.29)2 = 0.83 (, line 9). Next, since the ERR is estimated to decrease with the −0.86 power of attained age, ERR1Gy at different attained ages is expressed as A × (attained age)−0.86 (where A is a constant). Here, because the ERR1Gy at an attained age of 70 is 0.83 as mentioned above, A is 32.05. Consequently, the ERR1Gy values at different ages are estimated as 1.72 (age 30), 1.34 (age 40), 1.11 (age 50), and 0.95 (age 60). The ERR1Gy plus 1 represents the RR1Gy. It is noted that the calculated cancer mortality rate at age 30 is hypothetical (and likely to be overestimated) because the 10-years-old group at the time of exposure to A-bomb radiation includes those who were 0–19 years old, and that the latency period for cancer development following an irradiation is estimated to be 20 years or longer (UNSCEAR Citation1986). The results are summarized in . To show a dose-response relationship, cancer mortality rates at lower doses (0.2 and 0.5 Gy) were also calculated by assuming that the ERR is linearly related to the dose. These results are included in .
Table 1. Baseline cancer mortality rate in atomic bomb survivors who were 10 years old in 1945 and their estimated cancer mortality rates following an exposure to 1 Gy (per 10,000 Person-Years; Ozasa et al. Citation2012), and the estimated ERR at different dose levels.
Results
Irradiated mice develop an earlier increase in solid tumor mortality rate than nonirradiated mice
There are many reports which studied radiation effects on carcinogenesis in mice, but the data were presented in a form different from that used by epidemiologists, and hence calculation of Mouse⋅Days is not usually possible. Nonetheless, there was at least one report which listed solid tumor mortality in each 100-days observation window (Sasaki and Fukuda Citation2005). shows plots of the data. Open symbols indicate the solid tumor mortality rate in females in the control group, and solid symbols represent female mice irradiated with 1.9 Gy of radiation at 7 days of age.
Panel 1A shows age responses of solid tumor mortality for the control and irradiated groups, and panel 1B shows a magnified view of the low mortality regions in order to understand how the mortality increased during the early phase of carcinogenesis. In the irradiated group, the mortality rate started to increase at somewhere between 400 and 500 days and is clearly elevated at 500–600 days while the mortality in the control group is still very low, and close to zero. In other words, an irradiation did not cause an upward shift of the curve in proportion to the background rate (this may be expected from the hypothesis of induction of oncogenic mutation or genetic instability), but a leftward shift (this may be expected from the induction of oncogenic mutations, which allows cells to skip one step in a multistep carcinogenesis process, or an induction of stromal damage, which leads to an earlier onset). Another point to note is that a parallel shift of the control curve toward younger ages by about 200 days showed a surprisingly good fit to the data points of the irradiated group (dotted lines in ). In the Sasaki article, the data on solid tumor mortality was presented for mice irradiated at different ages (from 17-days fetuses to 365-days old mice), and in every case an appropriate shift of the control curve was able to fit the data points surprisingly well for the irradiated group (see the Supplementary file).
Panel 1C shows a semi-log scale presentation of panel 1A. The merit of plotting the data in a semi-log scale is that it can visually show the relative risk as the interval along the Y-axis between the two curves: log RR = log (mortality ratio between the irradiated and control groups) = log (mortality of the exposed group) – log (mortality of control group), and further facilitate presentation of the data in low mortality regions. In this figure, the mortality curves are a slightly convex upward and are already parallel as early as around 400 days of age, which was not clearly seen in panels 1A and 1B. Panels 1D show the RR, and it seems a natural consequence that a parallel shift of the control curve toward younger ages resulted in a decreasing trend in the RR.
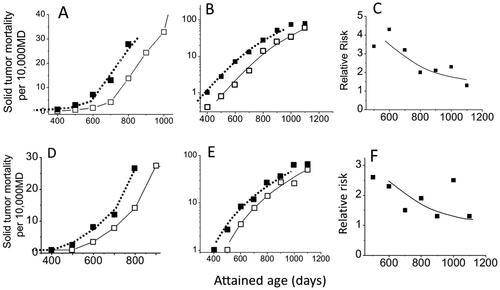
Similar results were obtained from the Tanaka papers (). In their studies, mice were chronically irradiated for 400 days and acquired a cumulative dose of 8 Gy, and the mean lifespan was shortened by about 100 days. Like the survival curves of the irradiated group, the solid tumor mortality (which includes a small percentage of myeloid leukemia cases) also shifted by about 100 days toward younger ages (). The increase in mortality begins to be apparent at 500 days of age for the irradiated group (both sexes), at which time the increase is not yet clearly seen in the control group (panel 2A for females and 2D for males). There seems to be no fundamental differences in the pattern of radiation response between males and females. Furthermore, as we have seen in , also shows that the control curve, which has been shifted by 110 days (females) or 100 days (males) toward younger ages fits closely with the observed points for solid tumor mortality for the irradiated group (closed symbols). Panels 2C and 2F show the RR, the ratios of the two mortality rates, and the RR values are smaller when compared with those in . This is simply because the biological effect is stronger for acute exposures of 1.9 Gy (which shortened the mean lifespan by about 200 days) when compared to a chronic exposure to 8 Gy (which shortened the mean lifespan by about 100 days).
Figure 2. Plots of estimated solid tumor mortality (which includes a small percentage of myeloid leukemia cases) calculated from two papers by Tanaka et al. (Citation2003, Citation2007). Mice were irradiated chronically with a mean dose rate of 20 mGy/day for 400 days (total dose 8 Gy). Open symbols indicate the control group and closed symbols indicate the irradiated group. The upper panels show the data for females and the lower panels for males. The solid lines represent control curves and the dotted lines indicate the control curves that were shifted toward younger ages by 110 days for females and 100 days for males. Panels A and D represent linear plots of the data in the low mortality regions, B and E represent semi-log scale plots, and C and F represent RR.
Cancer mortality in A-bomb survivors
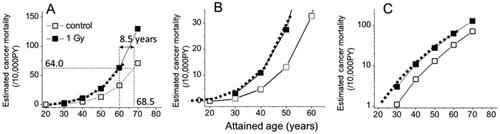
Cancer mortalities in A-bomb survivors who were 10 years old in 1945 and were exposed to <5 mGy (control group) or to 1 Gy were estimated at attained ages ranging from 30 to 70 years (). Panel 3A shows graphic presentations of the data, panel 3B shows a magnification of the low mortality regions, and panel 3C shows a semi-log presentation. The open symbols represent the control group, and the solid symbols represent the 1 Gy group. The first impression is that although the estimated mortality at 30 years of age is likely to be overestimated (larger than the actual mortality) due to an insufficient amount of time since the exposures (because the estimated latency period is 20 years or longer: UNSCEAR Citation1986), the panels look very similar to the responses seen in the mouse ( and ). This is a good indication that an irradiation would not induce an increased cancer mortality in proportion to the background rate but an earlier onset of cancer as previously seen in mouse data. To support this notion, the age of the control group was estimated at which the mortality rate reaches that of the 1 Gy group at age 60 (i.e. 64.0/104 PY: see ), and this was 68.5 years of age (panel 3 A). In other words, the results can be interpreted to indicate that an exposure to 1 Gy caused a parallel shift of the entire cancer mortality curve toward younger ages by 8.5 years. The bold dotted lines shown in panels 3A to 3C represent control curves shifted in a parallel manner by 8.5 years, and the shifted curves coincide almost exactly with the estimated points for the irradiated group (the closed symbols). This means that the parallel shift could faithfully reconstitute the temporal changes of RR values, which indicates that the mechanisms involved in radiation carcinogenesis are likely to cause an occurrence of cancer earlier than is usual in both mice and humans.
On the other hand, if one wants to describe the mortality data in as an upward change of the control curve, it becomes necessary to explain the gradual changes of the mutation induction rate which is expressed as the changes in the RR; namely, the RR is 2.6 at attained age of 30 years, 2.4 at age 40, 2.1 at age 50, and 1.9 at age 60 even though those people were exposed to the same dose of radiation at the same age. It is unlikely that those individuals who developed cancer earlier than others were more sensitive to radiation because very similar declining patterns of the RR are also seen among irradiated mice (F1 hybrids that are genetically identical; and ).
Figure 3. Graphic representations of estimated cancer mortality rates of A-bomb survivors who were 10 years of age at the time of radiation exposure (). Open symbols represent the control group and closed symbols represent the 1 Gy group. Panels A and B show plots with a linear scale while panel C is plotted in a semi-log scale. The dotted lines indicate a parallel shift of the control curve toward younger ages by 8.5 years.
Another point to note is that since the shifted time interval does not seem depend on the attained age, the carcinogenic effect of radiation can probably be expressed by a single parameter throughout life; namely, time lost in one’s life if one dies from cancer.
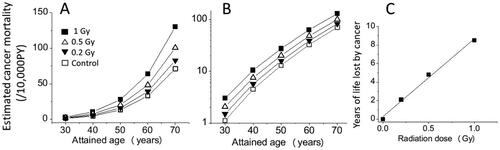
Next, the dose responses at lower doses of 0.2 and 0.5 Gy were estimated. Panel 4A shows a linear-scale plot of the data and indicates a linear dose response along the Y-axis following radiation exposures, which is expected since the RR was assumed to be linearly related to the dose. Panel 4B shows the same data but in a semi-log plot and indicates that the mortality for the irradiated groups could have started to increase earlier in a dose-dependent manner. Because the solid cancer mortality rate at age 60 of the 0.2 Gy group is estimated as 39.0/104 PY (), which corresponds to the mortality at age 62.1 in the control group, it is interpreted to mean a shift toward younger ages by 2.1 years. Similarly, since the estimated solid cancer mortality rate at age 60 in the 0.5 Gy group is 48.2/104 PY and corresponds to the mortality at age 64.8 in the control group, the length of the time shift following an exposure to 0.5 Gy was estimated to be 4.8 years. Panel 4C shows the years of life lost from cancer thus obtained as a function of the dose, and the increase in the number of years of life lost appears to be linearly related to the dose, which agrees with the life-shortening effect of radiation (all causes) observed in mice (Storer Citation1965; Storer et al. Citation1979; Carnes et al. Citation1989).
Discussion
Importance of integrating oncogenic mutation and earlier onset models
There are problems to apply either the mutation induction hypothesis or the earlier onset hypothesis to all radiation-associated malignancies. The former has its problem in explaining the parallel shift of mouse survival curves following an exposure to radiation and the decreasing trend of the RR value, which is commonly seen in both mice ( and ) and humans (e.g. of Ozasa et al. Citation2012). If one takes the RR value as an expression of induction potential of oncogenic mutations, it becomes necessary to assume that there exist individuals with different sensitivity to radiation carcinogenesis. Although one might think it possible to happen in humans since we are genetically heterogeneous, it is unlikely to occur in mice which are genetically identical (F1 hybrids of two inbred strains). On the other hand, the early onset hypothesis has its own problem in explaining some types of malignancies, especially those which occur with a short latency and express large RR values (e.g. human childhood leukemia and mouse thymic lymphoma), and they are more likely to be induced by radiation. Therefore, both mutation induction model and earlier onset model need to be integrated for our full understanding of radiation carcinogenesis.
Dose responses for the time shift
There are reports which showed a linear dose response for the life-shortening effect of radiation (all causes of death) by Storer (Citation1965: 1 to 5 Gy) and Carnes et al (Citation1989: 0.22 to over 19 Gy), and for the loss of mammary tumor-free life by Shellabarger et al. (Citation1980). Although these articles do not allow us to calculate solid tumor mortality and hence are not usable in the present study, the results are in line with the present results shown in and may support the linear response for cancer-related loss of life because most of the mice die from neoplasms. Then, the next question is what would be the possible cause of the linear response: mutagenesis or anything else? The most serious drawback of the mutagenesis model is that oncogenic mutations are assumed to affect only a fraction of the irradiated population in a dose-dependent manner, which cannot lead to a parallel shift of the survival curve (Nakamura Citation2020). In contrast, since anti-inflammatory drugs are known to mitigate carcinogenic effects of radiation or carcinogenic chemicals (see below), radiation-induced inflammation may be an attractive hypothesis to explain an earlier shift of cancer mortality (Nakamura Citation2021) and a linear dose response in radiation carcinogenesis.
Figure 4. Estimated temporal changes of solid cancer mortalities for 0, 0.2, 0.5, and 1 Gy groups of A-bomb survivors who were 10 years old in 1945. Panels A and B show the estimated cancer mortality with linear and semi-log scales, respectively, and panel C shows the dose response for the estimated years of life lost if one died from cancer.
Possible mechanisms which can explain earlier onsets of radiation carcinogenesis
Although the fractions of individuals dying from cancer were largely different between mice and humans, present results showed that the earlier onset model could describe cancer risks equally well in both mice and A-bomb survivors. Further, a recent mouse study showed most clearly that while the autopsy study showed that an irradiation caused earlier deaths from malignant lymphoma by about 100 days (Tanaka et al. Citation2007), the age-dependent appearance of malignant lymphoma cells detected by serial sacrifices of the animals was not affected by the same exposure (Tanaka et al. Citation2017). In other words, an exposure to radiation created a tissue microenvironment which favors faster growth of spontaneously arising tumors. This notion is fully compatible with the historical and general observations that an exposure to radiation would not induce new types of tumors that do not arise spontaneously but increase the frequency of ordinary ones.
There are multiple lines of evidence which indicate that an irradiation creates a microenvironment which is favorable to tumor cell growth due to inflammatory responses such as increased levels of local or systemic productions of various cytokines, chemokines, and growth factors (e.g. Fishbein et al. Citation2020a, Citation2020b). The details of the possible mechanisms on radiation-induced pro-tumorigenic microenvironments are described in a recent review (Nakamura Citation2021). Several pathways which can lead to tissue inflammation are presented here.
Irradiated stroma (Lee et al. Citation2014; Fishbein et al. Citation2020a, Citation2020b) or the co-transplantation of dead cells or even cell debris (Sulciner et al. Citation2018) may produce a microenvironment favorable for permitting transplanted tumor cells to grow better. This reminds us of the use of feeder layers in primary cell cultures in vitro.
Irradiated stroma may lead to an increased level of TGF-β, which may create a microenvironment favorable for dormant precancerous or cancerous cells to escape from immunologic surveillance by anti-tumorigenic NK and CD8+ T cells (Yang et al. Citation2010).
Radiation-induced DNA damage responses include the activation of ATM and subsequently NF-κB, a transcription factor related to pro-inflammatory responses, which may lead to increased levels of cyclooxygenase-2 (COX-2) and finally to increased levels of prostaglandin E2 (PGE2) (Hei et al. Citation2008; Nikitaki et al. Citation2016). NF-κB also activates inducible NO synthetase leading to the increased production of NO, which may promote inflammation. In addition, unrepaired DNA double-strand breaks may lead cells to progress to a senescence-associated secretory phenotype (SASP), which can help pre-malignant or malignant cells to form tumors in vivo (Krtolica et al. Citation2001). SASP may also help fibroblasts transform into cancer-associated fibroblast (CAF)-like cells which promote tumor cell growth (Legrand et al. Citation2018).
Apoptosis is managed by caspase 3, which may lead to an increased secretion of PGE2 (Huang et al. Citation2011).
Dead cell debris need to be cleared by activated macrophages, which produce inflammatory cytokines (Krall et al. Citation2018).
Radiation-induced broken chromatin or DNA in the cytoplasm mimics the conditions present in a viral infection, which is detected through the cyclic GMP-AMP synthase-stimulator of interferon genes (cGAS-STING) pathway (Emming and Schroder Citation2019) and may lead to inflammatory conditions.
There are also several lines of experimental evidence which indicate that a post-treatment of irradiated or chemically treated animals with anti-inflammatory drugs may reduce the carcinogenic effects of radiation (e.g. Inano and Onoda Citation2002, Citation2005; Ueno et al. Citation2009). Further, in a study which was aimed at mitigating carcinogenic effects of 7,12-dimethylbenz[a]anthracene (DMBA), post treatment of the animals with dietary administration of ibuprofen (an inhibitor of COX-1 and COX-2) or celecoxib (a COX-2-specific inhibitor), both are non-steroid anti-inflammatory drugs (NSAIDs) and decrease PGE2 biosynthesis, was found to decrease the mammary tumor frequency by 50% or more (Harris et al. Citation2000). In this context, it is stressed that DMBA is so potent that tumors start to appear as soon as 30 days following the treatment and the frequency reaches 100% within 100 days, whereas following an exposure to radiation it takes as long as 400 days after the exposure for the tumor mortality to increase ( and ). Thus, carcinogenic effect of radiation is relatively weak compared with potent chemical carcinogens. In other words, the anti-tumorigenic action of NSAIDs can also be expected in radiation-exposed animals, and we need to consider the possibility that local inflammation in the tumor microenvironment could play a more important role than previously thought during radiation and chemical carcinogenesis.
Mechanisms for the decreasing trend in the RR
During an early period in epidemiologic studies of A-bomb survivors when the RR for solid cancers started to increase, a question was raised if the high RR values observed among those who were exposed at young ages would persist or decrease with increasingly long follow-up periods (e.g. Preston et al. Citation2003). An accumulation of further data revealed that the RR decreased with an increase in post-exposure years, although the reasons for this have not been explained. Now semi-log plots of tumor mortality data (panels 1C, 2B, 2E, and 3C) can provide a clue to explain the decrease. Since the RR is a ratio of two mortality values, one can visually see the age-related changes of RR as the interval along the Y-axis between the two curves in a semi-log scale graph. Importantly, the semi-log plots of the mortality curves are slightly convex upward and radiation exposures shifted the curve toward the left and parallel to the control curve, which automatically gives rise to larger RR values at younger attained ages when compared with older attained ages. In short, an earlier onset of cancer and a decreasing trend in the RR are inter-related and are two faces of the same coin.
Excess risks for cancer would not mean an excess number of cancer patients
In the field of radiation protection, the somatic mutation theory appeared to be firmly established because ionizing radiation is undoubtedly a mutagen, and the theory appeared to fit the epidemiologic expression of cancer risks with the RR values. However, it is clear now that the risk can also be described by years of earlier onset. The difference between the two explanations lies solely in interpreting the shift of cancer mortality after an irradiation as a move in an upward direction (excess risk) or in a leftward direction (etiologic risk: Greenland and Robins Citation1988) as mentioned in the Introduction section, and hence the two interpretations are equally valid.
However, the somatic mutation theory has an inherent problem in dealing with the concept of a collective effective dose, which aims to describe gross estimation of radiation effects in near future in individuals who are going to be exposed to certain doses of radiation under specific situations. It has been noted that the collective dose should not be used in estimating excess risks that might have occurred in the past (ICRP Citation2007). Nevertheless, multiplication of quite small doses of radiation (e.g. radiation exposures caused by fallout from atmospheric bomb tests) by a huge number of individuals living on the earth may produce a large number (on the order of a million) of excess cancers cases (ECRR Citation2010), although this increase is not measurable. The currently presented concept of an earlier onset would help resolving the disputes: specifically, an exposure of a few mGy could lead to a few days or weeks of life lost from cancer when a linear non-threshold dose response is applied (but without taking into account the effect of the dose rate). Obviously, under this scenario, excess number of cancer patients will be close to zero (may not be zero because there might be some types of tumors that are inducible by direct exposures) than estimated previously using the relative risk model.
Radiation fingerprints
Several studies in mice showed that DNA from tumors of irradiated animals contained molecular fingerprints, that is, the Ikaros gene (Shimada et al. Citation2000) or the Pten gene (Yamaguchi et al. Citation2010) in thymic lymphoma, the wildtype allele of APC gene in mammary tumors of APCMIN mice (Imaoka et al. Citation2006), the wildtype allele of Ptch1 gene in medulloblastoma of Ptch1 heterozygous mice (Mancuso et al. Citation2008), and the wildtype allele of TSC2 gene in renal tumors of TSC2 heterozygous rats (Inoue et al. Citation2020). However, these are rodent models of childhood or young onset malignancies and hence are likely to be mechanistically different from common tumors which arise late in human life. In the present study, cancer data from mice and A-bomb survivors were scrutinized in a new way which is comfortable for biologists but is also epidemiologically sound, and the results showed that a radiation exposure (which is likely to cause alterations in a tissue microenvironment) can make it more likely that spontaneously arising transformed cells may form a tumor earlier than usual. Because this interpretation indicates that non-targeted or bystander effects from radiation occur, tumor-related gene(s) in a cancer-causing stem cell would not necessarily be mutated by a direct hit from the exposure. Hence, radiation fingerprints, such as deletions characterized by non-homologous end joining, would not be expected in DNA from common types of cancers, which occur in irradiated individuals or in an irradiated part of a body.
Conclusion
Semi-log plots of cancer mortality data from mice and A-bomb survivors indicated that radiation exposures caused an earlier increase in cancer mortality in both species, and that subsequently, the entire mortality curve was found to be shifted toward younger ages in parallel to the control curve. This parallel shift can faithfully reproduce the decreasing trend of the RR with an increase in years since an exposure.
The somatic mutation theory of radiation carcinogenesis implies that once a cancer-related gene is mutated, it is unlikely to be reversed to a normal state and hence to mitigate the occurrence of subsequent malignancies. In contrast, however, if an irradiation causes tissue inflammation, which facilitates spontaneously arising malignant cells in forming a tumor, then there would be ways to attenuate or delay the process of radiation carcinogenesis and such studies are already reported (e.g. use of NSAIDs). Thus, the new hypothesis is worth examining.
At low doses, the early onset model predicts that there would be almost no excess cancer cases although there may be exceptions depending on the type of malignancies, for example, leukemia.
Supplemental Material
Download MS Word (131.1 KB)Acknowledgment
The author is grateful to Dr. L. Kapp for his careful reading of the manuscript, Dr. H. Sugiyama for discussion, and an anonymous reviewer for helpful comments.
Disclosure statement
The author declared no potential conflict of interest.
Additional information
Funding
Notes on contributors
Nori Nakamura
Nori Nakamura, PhD, is a radiation biologist, interested in radiation carcinogenesis and radiation genetics. He is also interested in biological dosimetry using chromosome aberration frequency and electron-spin-resonance method on tooth enamel.
References
- Carnes BA, Grahn D, Thomson JF. 1989. Dose-response modeling of life shortening in a retrospective analysis of the combined data from the JANUS program at Argonne National Laboratory. Radiat Res. 119(1):39–56.
- ECRR. 2010. The 2010 Recommendations of the European Committee on Radiation Risk. In: Busby C, Bertell R, Schmitz-Feuerhake I, Cato MS, Aberystwyth AY. The Health Effects of Exposure to Low Doses of Ionizing Radiation. Slovakia: Green Audit Press. ISBN: 978-1-897761-16-8, free download available at http://euradcom.eu/wp-content/uploads/2016/04/ecrr2010.pdf. (as of April 7, 2022).
- Emming S, Schroder K. 2019. Tiered DNA sensors for escalating responses. Science. 365(6460):1375–1376.
- Fishbein A, Hammock BD, Serhan CN, Panigrahy D. 2020a. Carcinogenesis: Failure of resolution of inflammation? Pharmacol Ther. 218:107670.
- Fishbein A, Wang W, Yang H, Yang J, Hallisey VM, Deng J, Verheul SML, Hwang SH, Gartung A, Wang Y, et al. 2020b. Resolution of eicosanoid/cytokine storm prevents carcinogen and inflammation-initiated hepatocellular cancer progression. Proc Natl Acad Sci U S A. 117(35):21576–21587.
- Fry RJM. 1981. Experimental radiation carcinogenesis: What have we learned? Radiat Res. 87(2):224–239.
- Greenland S, Robins JM. 1988. Conceptual problems in the definition and interpretation of attributable fractions. Am J Epidemiol. 128(6):1185–1197.
- Harris RE, Alshafie GA, Abou-Issa H, Seibert K. 2000. Chemoprevention of breast cancer in rats by celecoxib, a cycloocygenase 2 inhibitor. Cancer Res. 60:2101–2103.
- Hei TK, Zhou H, Ivanov VN, Hong M, Lieberman HB, Brenner DJ, Amundson SA, Geard CR. 2008. Mechanism of radiation-induced bystander effects: a unifying model. J Pharm Pharmacol. 60(8):943–950.
- Huang Q, Li F, Liu X, Li W, Shi W, Liu FF, O'Sullivan B, He Z, Peng Y, Tan AC, et al. 2011. Caspase 3-mediated stimulation of tumor cell repopulation during cancer radiotherapy. Nat Med. 17(7):860–866.
- ICRP. 2007. The 2007 Recommendations of the International Commission on Radiological Protection. ICRP publication 103. Ann ICRP. 37:1–332.
- Imaoka T, Okamoto M, Nishimura M, Nishimura Y, Ootawara M, Kakinuma S, Tokairin Y, Shimada Y. 2006. Mammary tumorigenesis in ApcMin/+ mice is enhanced by X irradiation with a characteristic age dependence. Radiat Res. 165(2):165–173.
- Inano H, Onoda M. 2002. Radioprotective action of curcumin extracted from curcuma longa Line: inhibitory effect on formation of urinary 8-hydroxy-2’-deoxyguanosine, tumorigenesis, but not mortality, induced by gamma-ray irradiation. Int J Radiat Biol Phys. 53(3):735–743.
- Inano H, Onoda M. 2005. Nitric oxide produced by inducible nitric oxide synthase is associated with mammary tumorigenesis in irradiated rats. Nitric Oxide. 12(1):15–20.
- Inoue T, Kokubo T, Daino K, Yanagihara H, Watanabe F, Tsuruoka C, Amasaki Y, Morioka T, Homma-Takeda S, Kobayashi T, et al. 2020. Interstitial chromosomal deletion of the tuberous sclerosis complex 2 locus is a signature for radiation-associated renal tumors in Eker rats. Cancer Sci. 111(3):840–848.
- Krall JA, Reinhardt F, Mercury OA, Pattabiraman DR, Brooks MW, Dougan M, Lambert AW, Bierie B, Ploegh HL, Dougan SK, et al. 2018. The systemic response to surgery triggers the outgrowth of distant immune-controlled tumors in mouse models of dormancy. Sci Transl Med. 10:eaan3464.
- Krtolica A, Parrinello S, Lockett S, Desprez PY, Campisi J. 2001. Senescent fibroblasts promote epithelial cell growth and tumorigenesis: a link between cancer and aging. Proc Natl Acad Sci U S A. 98(21):12072–12077.
- Lee EJ, Park HJ, Lee IJ, Kim WW, Ha SJ, Suh YG, Seong J. 2014. Inhibition of IL-17A suppresses enhanced-tumor growth in low dose pre-irradiated tumor beds. PLoS One. 9(9):e106423.
- Legrand AJ, Poletto M, Pankova D, Clementi E, Moore J, Castro-Giner F, Ryan AJ, O'Neill E, Markkanen E, Dianov GL. 2018. Persistent DNA strand breaks induce a CAF-like phenotype in normal fibroblasts. Oncotarget. 9(17):13666–13681.
- Little JB. 2000. Radiation carcinogenesis. Carcinogenesis. 21(3):397–404.
- Mancuso M, Pasquali E, Leonardi S, Tanori M, Rebessi S, Di Majo V, Pazzaglia S, Toni MP, Pimpinella M, Covelli V, et al. 2008. Oncogenic bystander radiation effects in Patched heterozygous mouse cerebellum. Proc Natl Acad Sci U S A. 105(34):12445–12450.
- Mendelsohn ML. 1996. A simple reduction model for cancer risk in atomic bomb survivors. CR1-96, Radiation Effects Research Foundation, Hiroshima.
- Morgan WF, Day JP, Kaplan MI, McGhee EM, Limoli CL. 1996. Genomic instability induced by ionizing radiation. Radiat Res. 146(3):247–258.
- Morgan WF, Sowa MB. 2009. Non-targeted effects of ionizing radiation: implications for risk assessment and the radiation dose response profile. Health Phys. 97(5):426–432.
- Nakamura N. 2020. A hypothesis: radiation carcinogenesis may result from tissue injuries and subsequent recovery processes which can act as tumor promoters and lead to an earlier onset of cancer. Br J Radiol. 93(1115):20190843.
- Nakamura N. 2021. Reexamining the role of tissue inflammation in radiation carcinogenesis: a hypothesis to explain an earlier onset of cancer. Int J Radiat Biol. 97(10):1341–1351.
- Nikitaki Z, Mavragani IV, Laskaratou DA, Gika V, Moskvin VP, Theofilatos K, Vougas K, Stewart RD, Georgakilas AG. 2016. Systemic mechanisms and effects of ionizing radiation: A new 'old’ paradigm of how the bystanders and distant can become the players. Semin Cancer Biol. 37-38:77–95.
- Ozasa K, Shimizu Y, Suyama A, Kasagi F, Soda M, Grant EJ, Sakata R, Sugiyama H, Kodama K. 2012. Studies of the mortality of atomic bomb survivors, Report 14, 1950-2003: an overview of cancer and noncancer diseases. Radiat Res. 177(3):229–243. https://www.rerf.or.jp/en/library/data-en/lss14-en/. (as of 14 July, 2021).
- Preston DL, Shimizu Y, Pierce DA, Suyama A, Mabuchi K. 2003. Studies of mortality of atomic bomb survivors. Report 13: Solid cancer and noncancer disease mortality: 1950-1997. Radiat Res. 160(4):381–407.
- Sasaki S, Fukuda N. 2005. Temporal variation of excess mortality rate from solid tumors in mice irradiated at various ages with gamma rays. J Radiat Res. 46(1):1–19.
- Shellabarger CJ, Chmelevsky D, Kellerer AM. 1980. Induction of mammary neoplasms in the Sprague-Dawley rat by 430keV neutrons and X-rays. J Natl Cancer Inst. 64(4):821–833.
- Shimada Y, Nishimura M, Kakinuma S, Okumoto M, Shiroishi T, Clifton KH, Wakana S. 2000. Radiation-associated loss of heterozygosity at the Znfn1a1 (Ikaros) locus on chromosome 11 in murine thymic lymphomas. Radiat Res. 154(3):293–300.
- Storer JB, Serrano LJ, Darden EB Jr, Jernigan MC, Ullrich RL. 1979. Life shortening in RFM and BALB/c mice as a function of radiation quality, dose, and dose rate. Radiat Res. 78(1):122–161.
- Storer JB. 1965. Radiation resistance with age in normal and irradiated population of mice. Radiat Res. 25:435–459.
- Sulciner ML, Serhan CN, Gilligan MM, Mudge DK, Chang J, Gartung A, Lehner KA, Bielenberg DR, Schmidt B, Dalli J, et al. 2018. Resolvins suppress tumor growth and enhance cancer therapy. J Exp Med. 215(1):115–140.
- Tanaka IB III, Komura J, Tanaka S. 2017. Pathology of Serially Sacrificed Female B6C3F1 Mice Continuously Exposed to Very Low-Dose-Rate Gamma Rays. Radiat Res. 187(3):346–360.
- Tanaka IB III, Tanaka S, Ichinohe K, Matsushita S, Matsumoto T, Otsu H, Oghiso Y, Sato F. 2007. Cause of death and neoplasia in mice continuously exposed to very low dose rates of gamma rays. Radiat Res. 167(4):417–437.
- Tanaka S, Tanaka IB III, Sasagawa S, Ichinohe K, Takabatake T, Matsushita S, Matsumoto T, Otsu H, Sato F. 2003. No lengthening of life span in mice continuously exposed to gamma rays at very low dose rates. Radiat Res. 160(3):376–379.
- Ueno M, Inano H, Onoda M, Murase H, Ikota N, Kagiya TV, Anzai K. 2009. Modification of mortality and tumorigenesis by tocopherol-mono-glucoside (TMG) administered after X irradiation in mice and rats. Radiat Res. 172(4):519–524.
- UNSCEAR. 1986. 1986 Report, Genetic and somatic effects of ionizing radiation. United Nations, New York: UNSCEAR.
- Upton AC, Kimball AW, Furth J, Christenberry KW, Benedict WH. 1960. Some delayed effects of atom-bomb radiations in mice. Cancer Res. 20(Pt 2):1–60.
- Walburg HE Jr. 1975. Radiation-Induced Life-Shortening and Premature Aging. Adv Radiat Biol. 5:145–179.
- Yamaguchi Y, Takabatake T, Kakinuma S, Amasaki Y, Nishimura M, Imaoka T, Yamauchi K, Shang Y, Miyoshi-Imamura T, Nogawa H, et al. 2010. Complicated biallelic inactivation of Pten in radiation-induced mouse thymic lymphomas. Mutat Res. 686(1-2):30–38.
- Yang L, Pang Y, Moses HL. 2010. TGF-beta and immune cells: an important regulatory axis in the tumor microenvironment and progression. Trends Immunol. 31(6):220–227.