Article title: “212Pb-conjugated anti-rat HER2/neu antibody against a neu-N derived murine mammary carcinoma cell line: cell kill and RBE in vitro”
Authors: I. Liatsou, J. Yu, R. Bastiaannet, Z. Li, R. F. Hobbs, J. Torgue, and G. Sgouros
Journal: International Journal of Radiation Biology
Bibliometrics: Volume 98, Number 9, pages 1452–1461
DOI: https://doi.org/10.1080/09553002.2022.2033341
It has recently come to the authors’ attention that the final activity concentrations (kBq/ml) reported for the treatment of the cells in the proliferation and colony formation assays had not been properly updated. For those assays, the cells were first treated with unconjugated antibody (blocking) or just medium, having the final volumes/well be greater by 60 µl and 1 ml for each assay, respectively. This corresponds to actual activity concentrations of (0, 0.116, 0.231, 0.578, 1.16, 1.74, 2.31 and 4.63) kBq/ml and (0, 0.123, 0.247, 0.617, 1.23 and 2.47) kBq/ml, instead of (0, 0.185, 0.370, 0.925, 1.85, 2.78, 3.70 and 7.40) kBq/ml and (0, 0.185, 0.370, 0.925, 1.85 and 3.70) kBq/ml, for the proliferation and colony formation assays, respectively.
For the proliferation assay, this affects the Figure 2 legend. For the colony formation assay, Figure 3, as well as the curve fitting reported on pages 1456–1457, have been updated.
On p. 1457, the activity concentration of labeled construct required to reduce colony formation to 50%, was 0.388 kBq/ml; obtained by monoexponential curve fitting (κ = 1.785 ± 0.046 (kBq/ml)−1, R2 = 0.97) (Barendsen et al. 1960).
Furthermore, the absorbed doses, Figure 4 and RBE values have been updated.
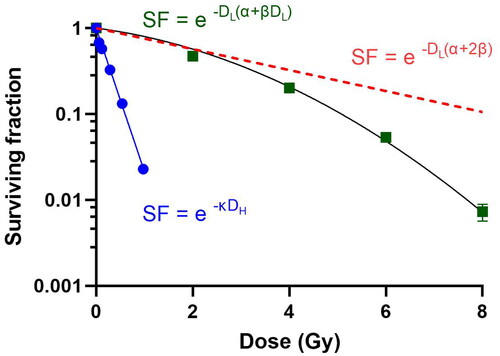
A monoexponential function was fitted through the absorbed dose-survival data (κ = 3.844 ± 0.027 Gy−1; R2 = 0.93). …. Using these two data sets, RBE2 was calculated as 13.7. The RBE at 10, 37 and 50% surviving fraction was 8.5, 11.5 and 12.9, respectively.
The above RBE2 and RBE values at 10, 37 and 50% survival have to be used and replace the previous ones in the abstract and discussion sections as well.
The conclusions in the article are not affected by the above. The authors apologize for any confusion these errors have caused.
The corrected versions of Figures 2, 3, and 4 are provided below.
Figure 2. Proliferation of NT2.5 tumor cells. (A) Absorbance, (B) relative to the non-treated controls’ absorbance of the cells and (C) absorbance post overnight incubation with 10µg/ml unlabeled antibody, as a function of incubation time for different 212Pb-conjugated anti-HER2/neu antibody activity concentrations (0-4.63 kBq/ml). (D–E) % Proliferating fraction of NT2.5 tumor cells after 5 days of incubation (D) without blocking and (E) with blocking using 10 μg/ml of cold Ab, as a function of activity concentration (0–4.63 kBq/ml); no statistically significant difference (p > 0.05) across the different activity concentrations and untreated cells was observed. At least three replications for each condition were used and the values represent the mean ± standard deviation.
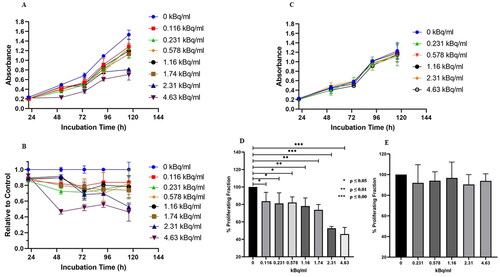
Figure 3. Colony formation assay showing the effect of high LET radiation treatment, 212Pb-TCMC-7.16.4 (0–2.47 kBq/ml), on the survival of NT2.5 tumor cells. The experiments were carried out in 6 replicates and the values represent the mean ± standard deviation. Error bars for all points on the plot except first are less than 9%.
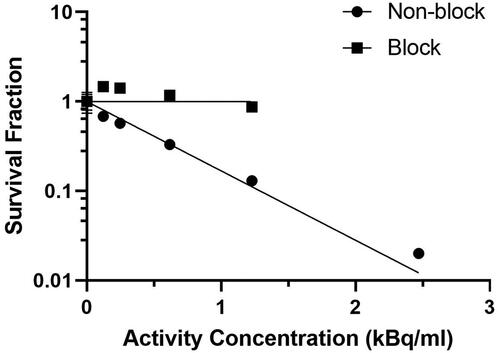
Figure 4. Absorbed dose-survival curves for current 212Pb-labeled antibody studies (blue line), reference (0.08 Gy/min) XRT (green curve) and linear-dose response to equivalent 2 Gy per fraction XRT dosing (red line). RBE2(α/β) is the ratio of κ/(α + 2β).