?Mathematical formulae have been encoded as MathML and are displayed in this HTML version using MathJax in order to improve their display. Uncheck the box to turn MathJax off. This feature requires Javascript. Click on a formula to zoom.
Abstract
Purpose
Risk analyses, based on relative biological effectiveness (RBE) estimates for neutrons relative to gammas, were performed; and the change in the curvature of the risk to dose response with increasing neutron RBE was analyzed using all solid cancer mortality data from the Radiation Effect Research Foundation (RERF). Results were compared to those based on incidence data.
Materials and methods
This analysis is based on RERF mortality data with separate neutron and gamma doses for colon doses, from which organ averaged doses could be calculated. A model for risk ratio variation with RBE was developed.
Results
The best estimate of the neutron RBE considering mortality data was 200 (95% confidence interval (CI): 50–1010) for colon dose using the weighted-dose approach and for organ averaged dose 110 (95% CI: 30–350). The ERR risk ratios for all solid cancers combined, for the best fitting neutron RBE estimate and the neutron RBE of 10 result in a ratio of 0.54 (95% CI: 0.17–0.85) for colon dose and 0.55 (95% CI: 0.18–0.87) for organ averaged dose. The risk to dose response curvature became significantly negative (concave down) with increasing RBE, at a neutron RBE of 170 using colon dose and at an RBE of 90 using organ averaged dose for males when fitting a linear-quadratic dose response. For females, the curvature decreased toward linearity with increasing neutron RBE and remained significantly positive until RBE of 80 and 40 using colon and organ averaged dose, respectively. For higher neutron RBEs, no significant conclusion could be drawn about the shape of the dose–response curve.
Conclusions
Application of neutron RBE values higher than 10 results in substantially reduced cancer mortality risk estimates and a significant reduction in curvature of the risk to dose responses for males. Using mortality data, the best fitting neutron RBE is much higher than when incidence data is used. The neutron RBE ranges covered by the overlap in the CIs from both the mortality and incidence analyses are 50–190 using colon dose and in all cases, the best fitting neutron RBE and lower 95% CI are higher than the value of 10 traditionally applied by the RERF. Therefore, it is recommended to consider uncertainties in neutron RBE values when calculating radiation risks and discussing the shape of dose responses using Japanese A-bomb survivors data.
Introduction
The Radiation Effect Research Foundation (RERF) regularly publishes datasets from the life span study (LSS) of the atomic bomb survivors from Hiroshima and Nagasaki containing different information about incidence and mortality risks of cancer sites and doses from gamma and neutron exposures. These datasets are often used in epidemiological studies for radiation-related cancer risk analyses. In the RERF mortality and incidence reports, a fixed value for the relative biological effectiveness (RBE) of neutrons relative to gammas of 10 has been used, in order to calculate total weighted organ doses so that updated reports were done in a consistent way to previous reports in this respect. However, different studies found indications that the neutron RBE for A-bomb survivors might be higher than 10 (e.g. Little Citation1997; Kellerer et al. Citation2006; Rühm and Walsh Citation2007; Walsh Citation2013; Satoh et al. Citation2018). The most recent among those studies (Cordova and Cullings Citation2019) used information on incidence of all solid cancers combined (Grant et al. Citation2017) to estimate the best fitting neutron RBE. They found that for all organs considered the resulting RBE values lie well above the traditionally used neutron RBE value of 10. In the dataset described by Grant et al. (Citation2017), however, only the total weighted doses using a RBE value of 10 were published and no separate neutron and gamma absorbed doses are publicly available. In order to analyze the impact of a higher neutron RBE on calculated cancer incidence risks, Hafner et al. (Citation2021) developed a model for cancer risk variation with RBE albeit based on a dataset with less years of follow-up (Preston et al. Citation2007), which does contain the separate neutron and gamma dose components. The model proposed by Hafner et al. (Citation2021) characterizes how the ratio of the risk coefficients per unit weighted dose using other choices of RBE to the risk coefficients per unit weighted organ averaged dose using a RBE 10 varies with RBE. Specifically, the model fits the ratio of the risks calculated at different neutron RBEs and the risk calculated at neutron RBE = 10 as a function of RBE, so that this fitted ratio model can be applied to adjust the risks obtained with the most recent data, which only cover neutron RBE = 10. Hafner et al. (Citation2021) reported that the incidence risks for all cancers combined decrease up to 50% using a neutron RBE of 80 instead of the traditionally used RBE of 10. In a following study, Hafner et al. (Citation2023) developed the model for ratio of incidence risk further by fitting more datapoints and by analyzing the model change when different organ dose types and dose ranges are used. Additionally, Hafner et al. (Citation2023) analyzed the impact of a higher neutron RBE than 10 on the shape of the dose–response curve.
The aim of the present study is to repeat the neutron RBE estimate analysis from Cordova and Cullings (Citation2019) as well as the model for risk ratio variation with RBE and curvature analysis from Hafner et al. (Citation2023) using cancer mortality data from Preston et al. (Citation2004) instead of cancer incidence data. Furthermore, the results obtained in the present study will be compared to the previous results based on incidence data and discussed with regard to future cancer risk calculations.
Materials and methods
Atomic-bomb survivors data
The present study applies the publicly available LSS epidemiological data from the RERF pertaining to all solid cancer mortality (ICD Codes 140-199) based on DS02 doses (Preston et al. Citation2004). These data have 10,085 deaths from solid cancer among 86,611 people during 50 years follow-up (1950–2000). Atomic bomb survivors with total shielded kerma doses exceeding 4 Gy and those not-in-city at the time of bombing were excluded in the present study. The numbers of subjects, solid cancer deaths and person years in total and for males and females separately for the different dose ranges considered here are listed in .
Best fitting neutron RBE estimates based on mortality data
This analysis was performed analogously to Cordova and Cullings (Citation2019) but using cancer mortality (Preston et al. Citation2004) instead of cancer incidence data. The linear excess relative risk (ERR) model for all solid cancers combined as well as the corresponding background rates were parameterized as in Preston et al. (Citation2004). The best-fitting neutron RBE was estimated using two approaches. In the ‘weighted dose approach’, a weighted dose was calculated as follows:
(1)
(1)
where different neutron RBE values in the range between 1 and 1200 were used;
denotes the absorbed gamma organ dose and
the absorbed neutron organ dose.
In the ‘separate dose approach’, separate linear terms for the gamma and neutron doses were included to the ERR models, such that (EquationEquation (2)(2)
(2) ):
(2)
(2)
The linear dose response of the ERR model could then be reparameterized as given in the following equation:
(3)
(3)
where
denotes the ratio of the neutron to the gamma dose risk effect modifier βn/βγ, which then represents the best estimate of the neutron RBE for a linear dose response. This analysis was performed using colon and organ averaged dose. Organ averaged dose was considered here because Cordova and Cullings (Citation2019) agreed with previous statements in Kellerer et al. (Citation2006) by stating that, because the colon is among the deepest of organs it may not be the best organ dose type to be used for the RBE estimations, since colon doses minimize the role of neutrons due to the high body shielding of the colon. The organ averaged dose was calculated by multiplying the colon gamma absorbed dose with a factor of 1.085 and the colon neutron absorbed dose with a factor of 2 to account for shielding by the human body (Kellerer and Walsh Citation2001).
Model for risk ratio variation with neutron RBE based on mortality data
A model for risk ratio variation with neutron RBE for all solid cancers combined based on mortality data was developed according to the method described in Hafner et al. (Citation2023). This model introduces a function that characterizes how the ratio of the excess coefficient per unit weighted organ averaged dose using other choices of RBE than 10, to the risk coefficient per unit weighted organ averaged dose for RBE 10, varies with RBE as shown in the following equation:
(4)
(4)
where
is the age at exposure,
is the attained age and
is the sex.
is the linear excess risk (either ERR or excess absolute risk (EAR)) for a neutron RBE of 10:
(5)
(5)
The subscript S denotes solid cancer, is the neutron RBE weighted organ dose,
is the linear dose effect modifier and
is the risk effect modifying function:
(6)
(6)
where – is used for males and + for females. The fit parameter in the model that is used to modify the main risk per unit dose to obtain risks for other attained ages, is referred to here as the risk effect modifier for attained age (and similarly for age at exposure). The risk effect modifiers
and
are sex-averaged and centered at an attained age
of 70 years and an age at exposure
of 30 years. The function
was fitted for ERR and EAR per unit weighted dose models for all solid cancers combined with respect to organ averaged and colon weighted doses for 120 different choices of neutron RBEs ranging from 10 to 1200. This fit was performed for both excess risks, because in lifetime risk assessments, ERR as well as EAR are included (e.g. Publication 103, ICRP Citation2007). It is therefore important to know how both excess risks vary with increasing neutron RBE. In order to model the risk ratio variation with higher neutron RBEs than the traditionally used value of 10, the range was chosen to start at an RBE value of 10 in this analysis (and not at 1 as in the previous analysis). Additionally, the range was chosen to cover the neutron 95% CI neutron RBE range shown in plus a margin including 19 more RBE values to cover the RBE range considered in the previous analysis.
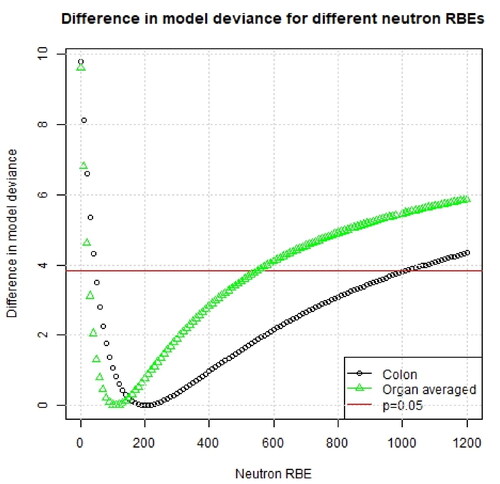
Figure 1. Difference in model deviance for a range of assumed neutron RBE values using different organ dose types. The results are shown using all dose entries (up to 4 Gy).
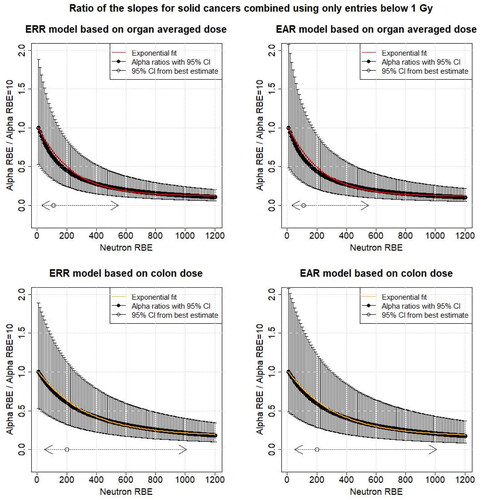
While considering the dose range up to 4 Gy is of importance for medical applications, astronaut health risk assessments or high-dose radiation protection, the dose ranges between 0 and 1 Gy are of interest in radiation protection when radiation-induced stochastic effects are considered. Therefore, additionally the impact of restricting the dose range for the different organ dose types to below 1 Gy on the model was analyzed. The dose that is considered to be <1 Gy is the RBE 10 organ weighted dose, i.e. the organ dose that is used is
Analog to the method Hafner et al. (Citation2023) applied, the risk effect modifiers of attained age, age at exposure and sex were fixed at the values for RBE = 10 and hence did not vary with increasing neutron RBE. Using this approach, the ratio of the excess risks reduces to the ratio of the linear dose effect modifiers at a certain RBE and RBE = 10:
(7)
(7)
where
is a neutron RBE between 10 and 1200. These ratios were then plotted as function of RBE. An exponential function (EquationEquation (8)
(8)
(8) ) was considered to fit these risk ratios as a function of RBE, because then for even higher RBEs the fit will remain above zero.
(8)
(8)
where
and
denote fit parameters and the subscript
denotes all solid cancers combined. The +1 term in EquationEquation (8)
(8)
(8) was added to assure that for a neutron RBE value of 10 the function
will be equal to 1.
Shape of the dose–response curve
As in Hafner et al. (Citation2023), the shape of the dose–response curve and how it changes with increasing neutron RBE was analyzed separately for both sexes. Therefore, a linear-quadratic dose model was fitted to the data, including all the dose entries (up to 4 Gy) for the different organ dose types:
(9)
(9)
where
denotes the sex-specific linear dose effect modifier,
the quadratic sex-specific dose effect modifier and
is the neutron RBE weighted organ dose. The risk effect modifiers
and
are sex-averaged. The change in the curvature:
(10)
(10)
was then analyzed as function of neutron RBE using different organ dose types. Note that a value of 0 for θ means a linear shape of the dose–response curve, while a high value indicates a significant quadratic component with dose.
Results
Best fitting neutron RBE estimates based on mortality data
In , the best-fitting estimates of the constant neutron RBE and likelihood-consistent values for each organ using a weighted-dose approach are shown, while shows the changes in model deviance for different assumed neutron RBEs for colon and organ averaged doses. For colon dose, the best estimate of the neutron RBE was 200 (95% CI: 50–1010) and for organ averaged dose 110 (95% CI: 30–350). All of these best fitting neutron RBE values lie well above the traditionally used neutron RBE value of 10. Further, the value of 10 is not included in any of the confidence intervals. shows also the results from the separate dose approach and the results are consistent with the results from the weighted dose approach.
Table 1. Best fitting and likelihood consistent neutron RBE values for different organ dose types using weighted dose and separate dose approaches for both mortality and incidence data.
Model for risk ratio variation with neutron RBE based on mortality data
shows the model for risk ratio variation with neutron RBE based on mortality data for the ERR using all dose entries (up to 4 Gy) and colon and organ averaged weighted doses. The corresponding figure for the EAR is shown in the appendix (). The ratio of the linear dose effect modifiers ( of EquationEquation (5)
(5)
(5) ) using ERR for all solid cancers combined for the best fitting neutron RBE estimate of 200 for colon dose shown in and the linear dose effect modifier at RBE = 10 is 0.54 and the ratios of the according 95% CI of 50 and 1010 are 0.85 and 0.17, respectively (). For organ averaged dose, the corresponding ratios are 0.55 for an RBE of 110 and 0.87 and 0.18 for neutron RBEs 30 and 550, respectively. Using only RBE 10 weighted dose entries below 1 Gy, the model for risk ratio variation with neutron RBE shows a similar behavior to the full dose range and is shown in the Appendix (). The ERR fit parameters (
and
from EquationEquation (8)
(8)
(8) ) are shown in for both dose ranges considered in this analysis. The according EAR fit parameters are shown in the Appendix ().
Figure 2. The black points show the ratio of the different linear dose effect modifiers ( of EquationEquations (5)
(5)
(5) and Equation(7)
(7)
(7) ) for mortality from all solid cancers combined for different neutron RBEs (10–1200) and the linear dose effect modifier at RBE = 10 as function of the neutron RBE fitted using all dose entries (up to 4 Gy) with respect to organ averaged weighted dose and colon weighted dose. The uncertainties (95% confidence interval (CI)) were calculated using Fieller’s method (Fieller Citation1940). Additionally, the 95% CI for the neutron RBE for the different organ doses is shown (). The solid line shows the exponential fit (EquationEquation (8)
(8)
(8) ). All other risk effect modifiers were assumed to be constant. ERR: excess relative risk.
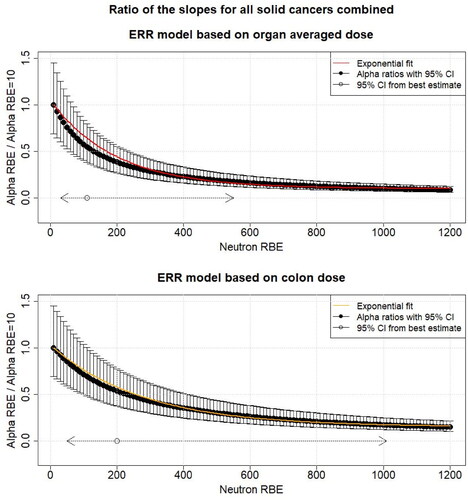
Table 2. ERR fit parameters and
and their standard error resulting from fitting an exponential model for risk ratio variation with RBE for mortality from all solid cancers, i.e. the model for the ratio of the risk to dose response fit parameters and the risk to dose response fit parameter for neutron RBE = 10 with respect to different organ doses (EquationEquation (8)
(8)
(8) ).
Change in the dose–response curve
The change in the curvature with increasing neutron RBE, when fitting a linear-quadratic dose response, is shown in using colon and organ averaged doses for males and females separately and using all doses up to 4 Gy. It is shown that for males the curvature becomes significantly negative (i.e. concave down) at a neutron RBE of 170 using colon dose and at a neutron RBE of 90 using organ averaged dose. For females, the curvature also decreases with increasing neutron RBE but remains significantly positive until neutron RBE of 80 and 40 using colon and organ averaged dose, respectively. For higher neutron RBEs, no firm conclusion can be drawn about the shape of the dose–response curve for females. These results indicate that using a higher neutron RBE than the traditionally used RBE of 10 changes the shape of the dose–response curve toward linear or even negative curvature.
Figure 3. The black points show the curvature (ratio of the quadratic dose effect modifier and the linear dose effect modifier [EquationEquation (10)(10)
(10) ]) as function of neutron RBE for both sexes separately, when a linear quadratic dose model was fitted with respect to different organ doses for mortality from all solid cancers combined using the all dose entries (up to 4 Gy). The 95% confidence intervals (CIs) are calculated using Fieller’s method. Additionally, the 95% CI for the neutron RBE for the different organ doses is shown (). Note that the RBE values from were deduced assuming a linear dose dependence for gammas and neutrons.
![Figure 3. The black points show the curvature (ratio of the quadratic dose effect modifier and the linear dose effect modifier [EquationEquation (10)(10) θ= βsq,sαlin,s(10) ]) as function of neutron RBE for both sexes separately, when a linear quadratic dose model was fitted with respect to different organ doses for mortality from all solid cancers combined using the all dose entries (up to 4 Gy). The 95% confidence intervals (CIs) are calculated using Fieller’s method. Additionally, the 95% CI for the neutron RBE for the different organ doses is shown (Table 1). Note that the RBE values from Table 1 were deduced assuming a linear dose dependence for gammas and neutrons.](/cms/asset/c77ca972-ce2e-45ca-9d7d-eb977b7991aa/irab_a_2245463_f0003_b.jpg)
Discussion
Best fitting neutron RBE estimates
Cordova and Cullings (Citation2019) analyzed incidence data on all solid cancer combined (Grant et al. Citation2017) to estimate the best fitting neutron RBE. This analysis was repeated in the present study using the all solid cancer combined mortality risks (Preston et al. Citation2004). Comparing the results, it can be observed that the best fitting neutron RBE is much higher for mortality than for incidence (e.g. for colon dose (95% CI): 200 (50–1010) using mortality and 80 (20–190) using incidence data). Nevertheless, because of the large CIs, a certain neutron RBE range is covered by both analyses; 50–190 using colon dose and the best fitting neutron RBE is higher than the traditionally used value of 10. This should be considered in future studies based on the LSS datasets. However, the factor of 2 or more difference in best estimates raises reliability issues if RBE is independent of the outcome type (i.e. cancer incidence or mortality).
Model for risk ratio variation with neutron RBE
The model for risk ratio variation with increasing neutron RBE using cancer incidence data introduced by Hafner et al. (Citation2021), was further investigated by Hafner et al. (Citation2023). For both excess risks (ERR and EAR) and using organ averaged dose, a reduction of 50% in the risk coefficient per weighted dose was found when a neutron RBE of 110 is used instead of 10. Similarly, for colon dose a risk decrease of 50% was found with a neutron RBE of 190 for both excess risks. In the present study, the model for risk ratio variation with increasing neutron RBE was investigated using mortality data instead of incidence data. The ratio of the linear dose effect modifiers ( of EquationEquations (5)
(5)
(5) and Equation(7)
(7)
(7) ) using ERR for all solid cancers combined for the best fitting neutron RBE estimate of 200 for colon dose and the linear dose effect modifier at an RBE of 10 is 0.54 and the ratios of the corresponding 95% CI bounds of 50 and 1010 are 0.85 and 0.17, respectively (). For organ averaged dose, the corresponding ratios are 0.55 for an RBE of 110 and 0.87 and 0.18 for neutron RBEs 30 and 550, respectively. This large decrease is similar to what has been found by Hafner et al. (Citation2023) using incidence data. It is concluded that this shows the importance of considering the possibility of higher neutron RBEs in cancer risk estimates and of including the uncertainty in neutron RBE values in uncertainty and sensitivity analyses of cancer risks based on LSS data. The model introduced by Hafner et al. (Citation2021) and used in Hafner et al. (Citation2023) and in the present study provides a method to calculate the cancer risks at a higher RBE than 10, in particular when only the total neutron RBE = 10 weighted absorbed doses are available. Nevertheless, it is emphasized again that, ideally, separate neutron and gamma absorbed doses for a selection of organs should be included in the data made publicly available by the RERF.
Shape of the dose–response curve
LSS studies considering curvature
Several studies that described analysis of LSS data have investigated the shape of the dose–response curve. Preston et al. (Citation2007) analyzed LSS all solid cancer incidence data and found linear dose responses for both sexes, while Grant et al. (Citation2017), with an extended follow-up, found a significant upward curvature for males and only little indication of nonlinearity for females. Ozasa et al. (Citation2012) analyzed LSS mortality data and found evidence of curvature in the ERR dose response for all solid cancer combined over the dose range from 0 to 2 Gy for both sexes combined, but over the full dose range this was not evident. By analyzing the LSS incidence dataset with follow-up until 1987, Little and Muirhead (Citation2000) found a curvature of 0.06 Sv−1 (95% CI −0.22, 0.67) for all solid cancers combined using the adjusted Hiroshima DS86 dose estimates. Little et al. (Citation2020) then analyzed the most recent published RERF data (follow-up from 1950 through 2003) with mortality risks and found substantial evidence of curvature for solid cancer using the latest dosimetry system DS02R1 (Cullings et al. Citation2017). Brenner et al. (Citation2022) conducted dose–response analyses for all solid cancer mortality and incidence using the dataset from Grant et al. (Citation2017) and found for the solid cancer mortality dose–response a borderline significant upward curvature among males and significant upward curvature among females; for solid cancer incidence a significant upward curvature among males but not among females was found over the entire range of doses.
Curvature in the present study
Hafner et al. (Citation2023) analyzed how the curvature changes with increasing neutron RBE using the dataset for solid cancer incidence from Preston et al. (Citation2007) and found that for an RBE of 140 for colon dose, 100 for liver dose, and 80 for organ averaged dose, the use of the linear quadratic dose model results in a significantly negative curvature (i.e. concave down) for males. For females, this was the case at an RBE of 110, 80 and 60, respectively. In the present study, the latter analysis was repeated using mortality data instead of incidence data. shows that with increasing neutron RBE, the curvature and thus the shape of the dose–response curve changes. For males, a negative curvature (i.e. concave down) resulting from fitting the linear quadratic dose model becomes significant at an RBE of 170 for colon dose and at a neutron RBE of 90 for organ averaged dose. For both organ dose types, these RBEs lie within the 95% CI of the best fitting neutron RBE shown in . For females, the positive curvature also decreases with increasing neutron RBE and remains significantly positive until neutron RBE of 80 and 40 for colon and organ averaged dose, respectively. For higher neutron RBEs, however, no significant conclusion can be drawn about the shape of the dose–response curve. It is noteworthy that for females the quadratic dose risk effect modifier became highly insignificant when fitting higher neutron RBEs. As reported by Hafner et al. (Citation2023), a negative curvature will lead to a decrease of the cancer risks at high doses, which indicates that the excess risks typically calculated by the RERF using an RBE value of 10 are overestimating the risk. These results suggest that higher neutron RBEs than 10 should be considered when analyzing the dose–response curve with the most recent RERF data based on separate gamma and neutron doses, which is currently only available to RERF scientists.
Comparison of the results for curvature from mortality and incidence data
The results of the shape of the dose response analysis using incidence and mortality data imply that for males, the dose response becomes significantly negative (i.e. concave down) when higher neutron RBEs are used, and the corresponding RBE values are similar (colon: 170 using mortality and 140 using incidence, organ averaged dose: 80 using mortality and 90 using incidence data). Consequently, if a higher neutron RBE than 10 is applied to the LSS cancer data and all the dose entries (up to 4 Gy) are considered, a linear-quadratic dose–response curve (that allows for a negative curvature) should be considered for males. For females, no firm conclusion can be drawn based on the analysis presented here. Using incidence data, a significant negative curvature with increasing neutron RBE was found (Hafner et al. Citation2021), while using mortality data the curvature was significantly positive until a certain RBE and then the results were inconclusive, as described above. Brenner et al. (Citation2022) found evidence that the curvature appears to depend on the composition of sites comprising all solid cancers and age at exposure or time. Detailed dose–response analysis including higher neutron RBE values and individual cancer sites are therefore recommended for future studies.
Differences between the mortality and incidence datasets
One possible explanation for the differences in the RBE estimates from mortality and incidence data may partially be related to differences in the dosimetry. The analysis of Cordova and Cullings (Citation2019) is based on the DS02R1 while the present analysis on the DS02 dosimetry system with the dataset used in Preston et al. (Citation2004). The DS02R1 estimates are more accurate in terms of survivor locations, and terrain shielding. Further, errors and inaccuracies in the dose estimates have been removed (Cullings et al. Citation2017). The improved shielding data will have an impact of the estimated neutron doses making analysis based on the DS02R1 dosimetry system more reliable. However, to what extent, such differences in dosimetry may affect curvature in dose response was not investigated here.
Another point to mention is the difference between the incidence and the mortality dataset. Cordova and Cullings (Citation2019) analyzed 79,954 subjects with a follow-up from 1958 to 2009 while in the present study 86,294 subjects were included with a follow-up from 1950 to 2000. Additionally, a main difference concerns the composition of cases due to the variation in cancer-specific survival (Brenner et al. Citation2022). Brenner et al. (Citation2022) point out that thyroid cancer, benign brain/CNS tumor as well as sex specific cancers have lower frequency in all solid cancer mortality data, because of the good survival. Since these organs are located near the body surface, their neutron organ dose contribution to the total weighted organ dose will be higher than that of other cancers. This implies that any change in neutron RBE for those cancer sites near the body surface will have greater impact on analyses with the incidence data than with the mortality data, when the corresponding organ doses are used. For the all solid cancer group, the same effect is expected, because the number of cases coming from those cancer sites near the body surface is higher in the incidence dataset than in the mortality dataset. However, the effect is expected to be less prominent, because the analysis was performed with respect to colon (or organ averaged) dose and not with respect to the specific organ dose. Excluding breast and thyroid cancer cases from the all solid cancer group in the incidence data analyzed by Hafner et al. (Citation2023) led to an increase of 20 in the best fitting neutron RBE.
Further, Griffin et al. (Citation2022) evaluated potential dosimetry improvements for organ doses using the new J45 phantom series developed by Griffin et al. (Citation2019), which are anatomically more realistic, sex specific and have a better age resolution and organ dose availability. The neutron component has been shown to drastically change in some organs due to the phantom update, but its effect on the total dose difference was found to be minimal because of the small contribution to the total absorbed dose. However, Griffin et al. (Citation2022) point out, that for studies considering higher neutron RBEs (e.g. 80 from Cordova and Cullings Citation2019), the neutron dosimetry improvements from the J45 series are more significant. Therefore, such an update of the dosimetry system could improve LSS studies related with higher neutron RBEs in the future.
Biological plausibility of high neutron RBEs
As Cordova and Cullings (Citation2019) describe, the magnitude of neutron RBE found in their study, and also that obtained in the present study, is higher than the RBE estimates reported in most of the previously published studies, on animals, plants and cells (see e.g. ICRP Citation2003, 92). In publication 92, ICRP (Citation2003), the different results from animal studies considering neutron radiation are summarized and the maximum neutron RBE at minimal doses reported from animal studies is 100 for the pooled data for solid cancers. However, it is very complex to provide an overall RBE estimate for solid cancer incidence from animal studies, because the experimental results of these studies depend on many factors as for example animal type (rat or mice) and strain, outcome, sex or neutron energy. Further, certain criteria need to be fulfilled by animal studies in order to provide reliable estimates of the neutron RBE for solid cancer induction. For example, in mice studies greater weight should be given to data obtained at low dose rates than to data obtained at high dose rates, only data for relevant organs and tissues should be considered, data for lethal and non-lethal tumors in a specific organ or tissue should not be pooled, and data for lethal tumors should be adjusted for competing risks (ICRP Citation2003). This makes the number of suitable studies very limited. Currently, ICRP Task Group 118 on RBE, quality factor and radiation weighting factor is reviewing the literature since the early 2000s on RBE and will provide an update on the information given in ICRP publication 92. In radiation protection, tissue weighting factors for neutrons, which reflect the RBE following external exposure, published in publication 103 ICRP (Citation2007), are currently used. The biological effectiveness of neutrons incident on the human body is strongly dependent on neutron energy. Therefore, the radiation weighting factor for neutrons is described by three continuous functions depending on neutron energy. These functions have been chosen as an empirical approach describing the weighting of neutrons over more than 10 decades of neutron energy. Further, it is pointed out in ICRP (Citation2007) 103 that these detailed functions should not be misinterpreted to reflect precisely available biological data, which suggest a broad range of RBE values depending on neutron dose, neutron dose rate and biological endpoint considered. In conclusion, it is unclear whether such high RBEs as found in the present study are biologically plausible.
Confounding factors
The neutron absorbed doses in the LSS population are small compared to the gamma absorbed doses and the estimation of the neutron RBE could be impacted by unobserved confounders. For example, Cordova and Cullings (Citation2019) suspected that the neutron RBE could be influenced by some confounding factors associated with city. Specifically, they analyzed the correlation between gamma and neutron absorbed dose estimates and found the correlation to range from 0.833 to 0.848 across the organs examined, from 0.929 to 0.943 for Hiroshima and from 0.933 to 0.956 in Nagasaki if the data are stratified by city.
Conclusions
Using the weighted-dose approach, the best estimate of the neutron RBE considering mortality data was 200 (95% CI: 50–1010) for colon dose and for organ averaged dose 110 (95% CI: 30–350). A model for risk ratio variation with increasing RBE based on mortality data has been developed in the present study. The ERR risk ratios for all solid cancers combined for the best fitting neutron RBE estimate and the neutron RBE of 10 result in a ratio of 0.54 (95% CI: 0.17–0.85) for colon dose and 0.55 (95% CI: 0.18–0.87) for organ averaged dose. When allowing for a linear-quadratic dose response, the curvature becomes significantly negative (i.e. concave downward) at a neutron RBE of 170 using colon dose and at a neutron RBE of 90 using organ averaged dose for males. For females, the positive curvature also decreases with increasing neutron RBE and remains significantly positive until neutron RBE of 80 and 40 using colon and organ averaged dose, respectively. For higher neutron RBEs, no firm conclusion can be drawn about the shape of the dose–response curve for females, because of the uncertainties involved. In order to perform more detailed analyses of the impact of neutron RBE, it is emphasized that, ideally, separate neutron and gamma absorbed doses for a selection of organs should be included in the data made publicly available by the RERF. The best fitting neutron RBE is higher when mortality data are used compared to using incidence data. Consequently, since the RBE could be independent of the outcome (i.e. cancer incidence or mortality) the numerical values deduced for the RBE should be interpreted with care. Furthermore, the biological plausibility of such high neutron RBEs for the outcome of cancer in humans is currently unsupported in the literature. Interestingly, because of the large CIs involved, a certain neutron RBE range is covered by all analyses; 50–190 using colon dose where this range excludes the traditionally used value of 10. This shows the importance of considering neutron RBEs and the associated uncertainties in future studies of cancer risk based on the LSS datasets.
Acknowledgements
We would like to thank the Swiss Federal Nuclear Energy Inspectorate (ENSI) for financial support. This work was enhanced by discussions within ICRP Task Group 91 on ‘Radiation Risk Inference at Low-dose and Low-dose Rate Exposure for Radiological Protection Purposes’ and ICRP Task Group 118 on ‘Relative Biological Effectiveness (RBE), Quality Factor (Q), and Radiation Weighting Factor (wR)’. This work makes use of the data obtained from the Radiation Effects Research Foundation (RERF) in Hiroshima, Japan. RERF is a private foundation funded equally by the Japanese Ministry of Health and Welfare and the US Department of Energy through the US National Academy of Sciences. The conclusions in this work are those of the authors and do not necessarily reflect the scientific judgment of RERF or its funding agencies.
Disclosure statement
The authors report no conflicts of interest.
Additional information
Notes on contributors
Luana Hafner
Luana Hafner is a physicist and holds a MSc in physics from ETH Zurich. Since April 2020, she is working at the Swiss Federal Nuclear Safety Inspectorate ENSI in the section of occupational radiation protection, where her main tasks are in the field of dosimetry and epidemiology. Dosimetry includes mainly supervisory activities while in epidemiology she is doing research in the field of radiation detriment calculation. In October 2020, she started her doctorate at the Medical Faculty of the University of Munich as well as an internship at the scientific secretariat of ICRP.
Linda Walsh
Linda Walsh, BSc, MSc, PhD, DSc. Research Fellow, University of Zurich and Freelance Consultant. She is a specialist in radiation epidemiology and holds a higher doctorate (DSc – 2012, based on 50 publications) in radiation epidemiology and a doctorate (PhD – 1985) in physics from the University of Manchester, UK. Some highlights of her research include analyses of data on: the LSS cohort of Japanese survivors of the World War II atomic-bomb attacks; thyroid cancer in areas affected by the 1986 Chernobyl accident; and the mortality follow-up of German ‘Wismut’ uranium miners. She is and has been involved in several EU-projects and national and international committees, including for WHO, UNSCEAR, ICRP, NCRP, SSK and ESA, and currently holds several consultancy contracts.
Werner Rühm
Werner Rühm lead the Medical and Environmental Dosimetry Group at the Helmholtz Center Munich, Germany. In 2023 he joined the Federal Office for Radiation Protection, Germany, and is currently acting as the Head of the Staff Unit “Future of Radiation Protection.” In addition, he is professor at the Medical Faculty of the University of Munich. In 2005, he joined Committee 1 (C1) on ‘Radiation Risk’ of the International Commission on Radiological Protection (ICRP), served as C1 Secretary from 2012 to 2016, and continued as C1 Chair from 2016 to 2021. In 2021, he was elected Chair of ICRP. From 2014 to 2020, he served as Chair of the European Radiation Dosimetry Group (EURADOS), and has been elected as Chair of the German Radiation Protection Commission (SSK) in 2020. Since 2005, Werner Rühm is one of the Editors-in-Chief of the Radiation and Environmental Biophysics Journal. Werner Rühm has published on various topics including quantification of neutron exposure of atomic-bomb survivors, cosmic-ray exposure of air crew, the role of neutrons in risk assessment of atomic-bomb survivors, risks from low-dose-rate exposures, behavior of radionuclides in the environment, internal exposures from incorporated radionuclides, and radiation measurement techniques.
References
- Brenner AV, Preston DL, Sakata R, Cologne J, Sugiyama H, Utada M, Cahoon EK, Grant E, Mabuchi K, Ozasa K. 2022. Comparison of all solid cancer mortality and incidence dose–response in the life span study of atomic bomb survivors, 1958–2009. Radiat Res. 197(5):491–508. doi:10.1667/RADE-21-00059.1
- Cordova KA, Cullings HM. 2019. Assessing the relative biological effectiveness of neutrons across organs of varying depth among the atomic bomb survivors. Radiat Res. 192(4):380–387. doi:10.1667/RR15391.1
- Cullings HM, Grant EJ, Egbert SD, Watanabe T, Oda T, Nakamura F, Yamashita T, Fuchi H, Funamoto S, Marumo K, et al. 2017. DS02R1: improvements to atomic bomb survivors’ input data and implementation of dosimetry system 2002 (DS02) and resulting changes in estimated doses. Health Phys. 112(1):56–97. doi:10.1097/HP.0000000000000598
- Fieller EC. 1940. The biological standardization of insulin. Suppl J R Stat Soc. 7(1):1–64. doi:10.2307/2983630
- Grant EJ, Brenner A, Sugiyama H, Sakata R, Sadakane A, Utada M, Cahoon EK, Milder CM, Soda M, Cullings HM, et al. 2017. Solid cancer incidence among the life span study of atomic bomb survivors: 1958–2009. Radiat Res. 188(3):370–371. doi:10.1667/RR14492.1
- Griffin K, Paulbeck C, Bolch W, Cullings H, Egbert S, Funamoto S, Sato T, Endo A, Hertel N, Lee C. 2019. Dosimetric impact of a new computational voxel phantom series for the Japanese atomic bomb survivors: children and adults. Radiat Res. 191(4):369–379. doi:10.1667/RR15267.1
- Griffin KT, Sato T, Funamoto S, Chizhov K, Domal S, Paulbeck C, Bolch W, Cullings HM, Egbert S, Endo A, et al. 2022. Japanese pediatric and adult atomic bomb survivor dosimetry: potential improvements using the J45 phantom series and modern Monte Carlo transport. Radiat Environ Biophys. 61(1):73–86. doi:10.1007/s00411-021-00946-2
- Hafner L, Walsh L, Rühm W. 2023. Assessing the impact of different neutron RBEs on the all solid cancer radiation risks obtained from the Japanese A-bomb survivors data. Int J Radiat Biol. 99(4):629–643. doi:10.1080/09553002.2022.2117871
- Hafner L, Walsh L, Schneider U. 2021. Cancer incidence risks above and below 1 Gy for radiation protection in space. Life Sci Space Res. 28:41–56. doi:10.1016/j.lssr.2020.09.001
- ICRP. 2003. Relative biological effectiveness (RBE), quality factor (Q), and radiation weighting factor (wR). ICRP Publication 92. Ann ICRP 33.
- ICRP. 2007. ICRP recommendations of the international commission on radiological protection. ICRP Publication 103. Ann ICRP 37.
- Kellerer AM, Rühm W, Walsh L. 2006. Indications of the neutron effect contribution in the solid cancer data of the A-bomb survivors. Health Phys. 90(6):554–564. doi:10.1097/01.HP.0000184917.94232.cd
- Kellerer AM, Walsh L. 2001. Risk estimating for fast neutrons with regard to solid cancer. Radiat Res. 156(6):708–717. doi:10.1667/0033-7587(2001)156[0708:reffnw[PMC]2.0.co;2]
- Little MP, Muirhead CR. 2000. Derivation of low-dose extrapolation factors from analysis of curvature in the cancer incidence dose response in Japanese atomic bomb survivors. Int J Radiat Biol. 76(7):939–953. doi:10.1080/09553000050050954
- Little MP, Pawel D, Misumi M, Hamada N, Cullings HM, Wakeford R, Ozasa K. 2020. Lifetime mortality risk from cancer and circulatory disease predicted from the Japanese atomic bomb survivor life span study data taking account of dose measurement error. Radiat Res. 194(3):259–276. doi:10.1667/RR15571.1
- Little MP. 1997. Estimates of neutron relative biological effectiveness derived from the Japanese atomic bomb survivors. Int J Radiat Biol. 72(6):715–726. doi:10.1080/095530097142870
- Ozasa K, Shimizu Y, Suyama A, Kasagi F, Soda M, Grant EJ, Sakata R, Sugiyama H, Kodama K. 2012. Studies of the mortality of atomic bomb survivors, report 14, 1950–2003: an overview of cancer and noncancer disease. Radiat Res. 177(3):229–243. doi:10.1667/rr2629.1
- Preston DL, Pierce DA, Shimizu Y, Cullings HM, Fujita S, Funamoto S, Kodama K. 2004. Effect of recent changes in atomic bomb survivor dosimetry on cancer mortality risk estimates. Radiat Res. 162(4):377–389. doi:10.1667/rr3232
- Preston DL, Ron E, Tokuoka S, Funamoto S, Nishi N, Soda M, Mabuchi K, Kodama K. 2007. Solid cancer incidence in atomic bomb survivors: 1958–1998. Radiat Res. 168(1):1–64. doi:10.1667/RR0763.1
- Rühm W, Walsh L. 2007. Current risk estimates based on the A-bomb survivors data—a discussion in terms of the ICRP recommendations on the neutron weighting factor. Radiat Prot Dosimetry. 126(1–4):423–431. doi:10.1093/rpd/ncm087
- Satoh K, Yasuda H, Kawakami H, Tashiro S. 2018. Relative biological effectiveness of neutrons derived from the excess relative risk model with the atomic bomb survivors data managed by Hiroshima University. Radiat Prot Dosimetry. 180(1–4):346–350. doi:10.1093/rpd/ncx173
- Walsh L. 2013. Neutron relative biological effectiveness for solid cancer incidence in the Japanese A-bomb survivors: an analysis considering the degree of independent effects from gamma-ray and neutron absorbed doses with hierarchical partitioning. Radiat Environ Biophys. 52(1):29–36. doi:10.1007/s00411-012-0445-6
Appendix A
Information about the atomic bomb survivors dataset
Table A1. Number of subjects, solid cancer deaths and person years in total and for males and females separately based on the DS02can.dat dataset (https://www.rerf.or.jp/en/library/data-en/ds02/, accessed 11 May 2023) for the different dose ranges used in the present analysis.
Excess absolute risk results
Figure A1. The black points show the ratio of the different linear dose effect modifiers ( of EquationEquations (5)
(5)
(5) and Equation(7)
(7)
(7) ) for mortality from all solid cancers combined for different neutron RBEs (10–1200) and the linear dose effect modifier at RBE = 10 as function of the neutron RBE fitted using all dose entries (up to 4 Gy) with respect to organ averaged weighted dose and colon weighted dose. The uncertainties (95% CI) were calculated using Fieller’s method (Fieller Citation1940). Additionally, the 95% confidence interval (CI) for the neutron RBE for the different organ doses is shown (). The solid line shows the exponential fit (EquationEquation (8)
(8)
(8) ). All other risk effect modifiers were assumed to be constant. EAR: excess absolute risk.
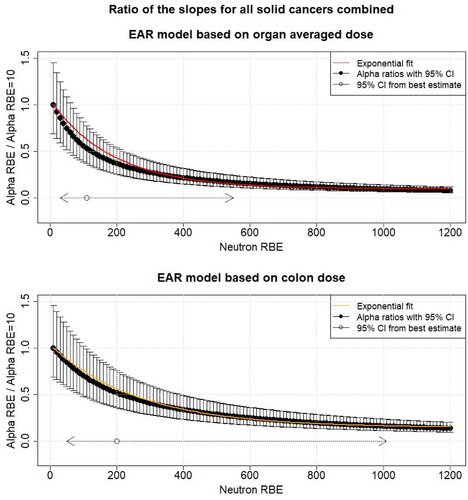
Table A2. EAR fit parameters and
and their standard error resulting from fitting an exponential model for risk ratio variation with RBE for mortality from all solid cancers, i.e. the model for the ratio of the risk to dose response fit parameters and the risk to dose response fit parameter for neutron RBE = 10 with respect to different organ doses (EquationEquation (8)
(8)
(8) ). The results are shown using all dose entries (up to 4 Gy) and for the case when doses were below 1 Gy.
Results considering RBE 10 weighted dose entries below 1 Gy
Figure A2. The black points show the ratio of the different linear dose effect modifiers ( of EquationEquations (5)
(5)
(5) and Equation(7)
(7)
(7) ) for mortality from all solid cancers combined for different neutron RBEs (10–1200) and the linear dose effect modifier at RBE = 10 as function of the neutron RBE fitted using RBE = 10 weighted dose entries below 1 Gy with respect to organ averaged weighted dose and colon weighted dose. The uncertainties (95% CI) were calculated using Fieller’s method (Fieller Citation1940). Additionally, the 95% CI for the neutron RBE for the different organ doses from is shown. The solid line shows the exponential fit. All other risk effect modifiers were assumed to be constant. ERR: excess relative risk; EAR: excess absolute risk.