
ABSTRACT
The recently formalized concept of ‘Vineyard Geological Identity’ (VGI) was applied to two vineyards in the Champlain Valley of Vermont, USA. The vineyards studied, LP and SV, both produce the hybrid grape known as ‘Marquette’, are at equivalent elevations, have a similar macroclimate, and were inundated by proglacial Lake Vermont during the last deglaciation. In contrast, the bedrock differs beneath the two sites, and SV was under shallow marine water immediately after Lake Vermont drained. The hypothesis tested was that despite their similar physical settings, the VGI of the two vineyards would vary as a result of differences in their late-Quaternary histories. Samples of soil and sediment were evaluated for grain size distribution, thermogravimetric analysis, mineralogy, major element chemistry, and standard soil fertility assessments, and a map of soil conductivity was made for each site. Results reveal that base cations and silt are significantly more abundant at LP. Conversely, at SV, Na is significantly more abundant, samples are coarser and soil conductivity is higher. These results illuminate the utility of VGI for defining the fingerprint of individual vineyards, and establish a physical foundation for future work evaluating the role of physical setting in controlling aspects of Marquette wines.
1. Introduction
One of the most persistent concepts in winemaking is the belief that the flavors of wine can, at least to some degree, be traced back to the physical properties of the vineyard in which the grapes were grown (van Leeuwen & Seguin, Citation2006). This idea has long been embodied in the concept of terroir and remains a point of active research and often spirited debate (Wilson, Citation2001). The idea of terroir has an appealing simplicity, and because the geographic origin of wine is celebrated rather than devalued in the pursuit of uniformity, it is not surprising that terroir has found favor far beyond the European vineyards where it was originally developed. Certainly not everyone is convinced that the concept of terroir is valid. For instance, some studies have concluded that the effects of soil properties on wine chemistry are minimal and unlikely to be perceptible as differences in flavor (Maltman, Citation2008). Others have suggested that terroir is nothing more than a clever marketing tool (Schaller, Citation2017). Yet at the same time, carefully designed research has demonstrated that some aspects of wine chemistry are controlled by the local geologic setting (Burns, Citation2012; Huggett, Citation2006; Roullier-Gall et al., Citation2014) and soil composition (Ubalde et al., Citation2010; van Leeuwen et al., Citation2018), including trace element concentrations (Greenough et al., Citation2005) and strontium isotope ratios (Braschi et al., Citation2018; Tescione et al., Citation2015; Victor et al., Citation2015; Vinciguerra et al., Citation2016). The success of those investigations, coupled with long-standing observations from established wine-growing regions (e.g. Lemaire & Kasserman, Citation2012; Swinchatt et al., Citation2018), keep the idea of terroir alive and continue to motivate investigation into possible links between the physical setting of vineyards and the wine they produce (e.g. Haynes, Citation2000; van Leeuwen et al., Citation2004).
One challenge inherent in exploring terroir is the reality that a wide range of physical and environmental factors play a role in controlling the health and physiology of grapevines, and possibly the qualities of the fruit they yield. Grapevines are deep-rooted, thus the properties of shallow soil horizons typically considered in agronomic studies may be less important than the properties of deeper sediments and regolith beneath modern soil profiles (Haynes, Citation1999). As a result, a soil map alone may be insufficient for predicting the properties of much of the material with which vine roots are in contact. Variations in sediment properties reflecting contrasting layers in a stratigraphic sequence, or arising from lateral facies changes, can greatly impact water availability and drought susceptibility, with corresponding effects on vine vigor and fruit production (van Leeuwen & de Rességuier, Citation2018). Similarly, aspect, elevation, slope shape, and local wind regime all contribute to the microclimatic effects that play a role in determining fruit production and timing and rate of ripening (Haynes, Citation2000). Putting all this together, it is clear that an investigation of physical aspects of terroir needs to consider multiple factors simultaneously (van Leeuwen, Citation2010; White, Citation2020).
In recognition of this complicated reality, the concept of ‘Vineyard Geological Identity’ (VGI) was introduced as a framework for holistic examination of the geologic history, growing conditions, and soil properties in vineyards of interest (Ferretti, Citation2019). The VGI concept was first applied to a suite of vineyards in northern Italy where Gewürztraminer has been produced for generations. Through collective consideration of bedrock geology, surficial geology and geomorphology, along with soil and sediment properties, the study by Ferretti (Citation2019) serves as a blueprint outlining the field and laboratory measurements necessary to define the pedogeologic identity of a vineyard (). It is important to emphasize that in isolation the concept of the VGI does not aim to test or prove terroir, nor does it take into account the many decisions made by winemakers that also influence the properties of wine. However, by standardizing an approach for integrated description of geologic history and modern soil properties, VGI provides a foundation upon which further investigations of terroir in a given region could be based.
Table 1. Construction of the Vineyard Geologic Identity (VGI).
This study focused on two vineyards in Vermont, in the northeastern part of the United States (). Although the climate of this region, with cold winters and cool summers, traditionally limited wine production, the development of cold-hardy hybrid grape varieties in the past few decades has catalysed a burgeoning wine industry. Total production remains modest, yet Vermont is in the top 10 of US states ranked by annual wine production (Wine Production by State, Citation2020, Citation2020), and the number of vineyards quadrupled from 10 in 1998, to 41 in 2015 (Wine | Agricultural Marketing Resource Center, Citation2020). One of the most commonly planted grapes is a hybrid cultivar known as Marquette (Hemstad & Luby, Citation2008). Developed by the University of Minnesota, Marquette (MN 1211) is a descendent of Pinot Noir crossed with a variety of North American Vitis species (Gerrath et al., Citation2015), that is extremely cold tolerant and capable of generating fruit with high concentrations of tannins (Rice et al., Citation2017). However, despite the success of Marquette and other cold-climate cultivars, little is known about how aspects of vineyard physical setting might translate into flavor profiles of Marquette wines.
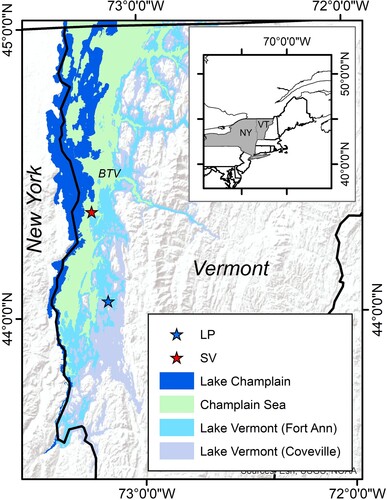
Figure 1. Location map of the study area. Inset shows the states of Vermont (VT) and New York (NY) in the northeastern United States. Larger figure presents the locations of the LP and SV study sites (stars) in the Champlain Valley. Color shading represents the mapped extent of proglacial Lake Vermont at its highest (Coveville) level, and its lowest (Fort Ann) level, as well as the extent of the Champlain Sea marine incursion. Note that both sites were submerged by Lake Vermont at the Coveville level, but only the SV site was submerged by the Fort Ann Lake Vermont and the Champlain Sea. Blue denotes the extent of modern Lake Champlain. ‘BTV’ is the Burlington International Airport where the local climate record was collected.
The two vineyards selected in this study both produce Marquette grapes, are located in a similar physical setting, and have equivalent climatic conditions. An expanded version () of the VGI formulated by Ferretti (Citation2019) was used as a framework for testing the hypothesis that, despite these overarching similarities, physical and chemical characteristics of the soils and surficial sediments in these vineyards would vary as a result of differences in their geologic history. The focus was not on properties of the grapes themselves, or wines produced from them. Rather, this study is the first to employ the formalized VGI approach outside of Europe, and is the first attempt to develop a standardized geopedological context for North American vineyards producing Marquette grapes. As such, this work is a useful evaluation of the applicability of the VGI concept in other wine-growing regions.
2. Study area
2.1. Physiography and geologic history
The Champlain Valley is a broad (5–25 km wide), low elevation (∼30–200 m above sea level) north-draining lowland underlain by Paleozoic sedimentary rocks positioned between the Green Mountains in Vermont in the Adirondack Mountains in New York (). Maximum elevations in this region exceed 1500 m, thus local relief is ∼1.5 km. The lowest parts of the Champlain Valley are occupied by Lake Champlain (), which has a north-south extent of ∼200 km, is as wide as 20 km, has a maximum depth of ∼120 m (Manley et al., Citation2012) and drains northward into the St. Lawrence River. The rocks underlying the Champlain Valley were deposited as siliciclastic shoreline sediments and nearshore carbonate bank sediments on a passive margin during the closing of the Iapetus Ocean (Dix et al., Citation2013; Landing, Citation2012). These rocks were deformed and faulted during the Taconic orogeny in the Ordovician, and to a lesser extent by other mountain-building events later in the Paleozoic (Rodgers, Citation1971; Rowley & Kidd, Citation1981).
The landscape of this region owes its character to repeated glaciation during the Quaternary. In response to orbitally driven climatic changes, extensive ice sheets formed numerous times in eastern Canada and advanced over the northeastern United States. Erosion by this ice exploited fundamental differences in rock hardness, preferentially removing the softer carbonate rocks in the Champlain Valley and enhancing topographic relief as the harder rocks underlying the mountain uplands were correspondingly less eroded. The most recent of these glacial advances, by the Laurentide Ice Sheet, submerged even the highest summits in the Green and Adirondack Mountains beneath the ice surface and reached as far south as the location of modern New York City around 25,000 years ago (Bierman et al., Citation2015; Corbett et al., Citation2017, Citation2019).
During deglaciation, the margin of the northward-retreating Laurentide Ice Sheet blocked the drainage of meltwater, causing the formation of proglacial Lake Vermont, which flooded the Champlain Valley below an elevation of ∼200 m (). This inundation produced wave-cut shoreline features, as well as deposition of lacustrine sediments above the basal till emplaced by the glacier (Stewart & MacClintock, Citation1970). On the basis of available evidence, it appears that Lake Vermont was present ∼14,000 years ago and that the lake dropped to progressively lower elevations as different outlets became available for draining water to the south (Rayburn et al., Citation2005). Approximately 13,000 years ago, when the southern margin of the Laurentide ice sheet retreated north of the St. Lawrence River, Lake Vermont emptied and ocean water entered the isostatically depressed Champlain Valley forming a marine embayment known as the Champlain Sea (Cronin et al., Citation2008; Parent & Occhietti, Citation1988; Richard & Occhietti, Citation2005). As with the more extensive Lake Vermont, the Champlain Sea () is recorded by fine-grained water-lain sediments and shorelines (Stewart & MacClintock, Citation1970). Isostatic uplift in the early Holocene lifted the bedrock threshold at the northern end of the valley above sea level (Parent & Occhietti, Citation1988), leading to the formation of the freshwater Lake Champlain. Today Lake Champlain is flanked, particularly on the Vermont side, by a broad lowland with generally low slopes underlain by glacial till and finer water-lain sediments with thickness varying from 0 to >10 m.
The two vineyards selected for this study, designated ‘LP’ and ‘SV’, are located ∼30 km apart from one another in the Champlain Valley (). With an area of ∼6.8 ha, LP is slightly higher, at an elevation of 130 m, compared with 80 m for SV, which covers ∼2 ha (). LP extends across a broad, nearly flat upland (mean slope of 0.5°), whereas SV is located on a westward-sloping (mean slope of 5.2°) landform incised by a Holocene stream erosion (). LP is underlain at depth by the Beldens Member of the Ordovician-age Chipman Formation, a light-grey, fine-grained limestone mixed with dolostone and hematite-streaked marble. In contrast, the SV site is underlain by Cambrian-age Monkton Quartzite, which contains reddish-brown sandstone and dolomitic quartzite (Ratcliffe et al., Citation2011). Natural exposures in a gully forming the northern border of the SV vineyard reveal ∼10 m of Quaternary sediment overlying the quartzite bedrock (). Bedrock is exposed at the surface within ∼350 m of the LP vineyard, but water well data closer to the site indicate a depth to bedrock in excess of 10 m. Thus, the bedrock here, as in other parts of the Champlain Valley, has a complex local topography that is partially obscured by Quaternary sediments. Both vineyards are underlain at least in part by till from the last glaciation, which contains exotic clasts of igneous and metamorphic lithologies derived from the Precambrian Canadian Shield. This till is exposed in the gully at the SV site, whereas the surficial sediment at LP is mapped as glacial till (Stewart & MacClintock, Citation1970) in recognition of these erratics. Both sites were submerged when Lake Vermont stood at its highest level, however the LP site was emergent during later, lower phases of Lake Vermont (). Wave action over the LP site during this interval of falling water likely produced the planed off, gentle slope of this local landscape (). The LP site was not impacted by the later Champlain Sea marine incursion, but the SV site was located under shallow marine water at this time ().
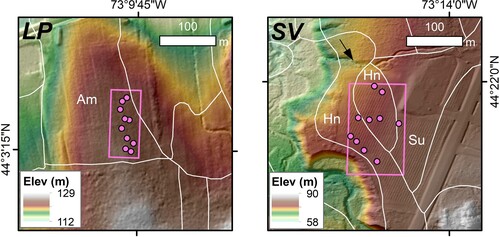
Figure 2. Maps of the LP (left) and SV (right) study sites. Background is a 0.7-m lidar dataset hillshaded and colored to enhance topography. Note that the range of elevations is different for the two sites. White lines delineate mapped soil series downloaded from the Web Soil Survey (https://websoilsurvey.sc.egov.usda.gov). Am is the Amenia series, Hn the Hinesburg, and Su the Stockbridge (see Table S1). Pink boxes outline the study sites in the Marquette block at each vineyard. Pink dots are the locations of the 20 auger holes (10 per site) where samples were collected. Arrow points to the natural gully at the north end of the SV site where additional samples from deeper sediment were obtained.
2.2. Climate
Although specific climatic data are not available for LP and SV, their proximity suggests that their climates should be similar. As represented by the National Weather Service recording site at the Burlington International Airport (BTV) ∼13 km north of SV, the Champlain Valley has a warm summer continental climate (Köppen, Dfb). On the basis of climatic normals for 1981–2010, the mean annual temperature is 7.7°C with mean annual precipitation of 935 mm (Figure S1, where ‘S’ designates supplementary material accompanying this article online). Winters are cold and snowy, with a mean December/January/February temperature of −5.5°C and average precipitation of 155 mm water equivalent. Summers are relatively cool and wet, with average June/July/August temperature of 20.2°C and precipitation of 295 mm. Growing degree days (base of 10°C) average 1230°C, May 1 through September 30. The Champlain Valley classifies in USDA plant hardiness zone 4b, with an average annual extreme minimum temperature between −31.7 and −28.9°C (USDA Plant Hardiness Zone Map, Citation2020). From a viticultural perspective, the region falls in the Zone I of the Winkler classification (Winkler et al., Citation1974).
2.3. Soils
Existing mapping reveals that LP and SV are underlain by soils featuring weak development in disparate parent materials. The entirety of the Marquette block at LP is mapped as the Amenia series (), a coarse-loamy, mixed, active, mesic Aquic Eutrudept in USDA soil taxonomy. Amenia soils are formed on glacial till and are common along the north-south axis of the Champlain and Hudson Valleys in the northeastern United States. Amenia profiles exhibit relatively weak horizonation, typically with one or more Bw horizons underlying an Ap horizon testifying to past or current agricultural use. A notable feature of Amenia soils is the presence of distinct, dark yellowish brown (10YR 4/4), masses of iron accumulation in the subsoil. Depth to bedrock of Amenia profiles is commonly in excess of 150 cm. A standard profile description of the Amenia soil is provided in Table S1.
The SV site is mapped as the Hinesburg series, a sandy over loamy, mixed, active, nonacid, mesic Typic Udorthent in USDA soil taxonomy (). In contrast to the glacial origin of the Amenia soil parent material, Hinesburg soils form in sandy material deposited in shallow water and delta environments. Hinesburg soils are found throughout the northern part of the Champlain Valley, as well as in parts of coastal Massachusetts to the southeast. Like the Amenia, Hinesburg soils exhibit minimal development, typically featuring just a thin Bw horizon beneath an Ap. Typical solum thickness is 40–80 cm, and depth to bedrock is again >150 cm. A standard profile description of the Hinesburg soil is provided in Table S1.
Upper parts of the SV site, immediately bordering the area sampled in this study, are mapped as the Stockbridge series, a coarse-loamy, mixed, semiactive, mesic Dystric Eutrudept developed in calcareous glacial till (). Because lateral transitions between soil series are often gradual, it is likely that the soils sampled at the SV site represent a blend between the Hinesburg and Stockbridge end members. Like the other series, Stockbridge soil profiles have a simple horizon sequence of Bw beneath Ap. However, they tend to contain more coarse fragments than Hinesburg soil, and lack the iron accumulations typical at depth in Amenia profiles. A standard profile description of the Stockbridge soil is provided in Table S1.
3. Methods
3.1. Field methods
Samples of soil and surficial sediments were collected at depths of 25, 50, 75, and 100 cm (designated ‘a’ through ‘d’) from the LP and SV sites in December, 2020 using a motorized auger. The high stone content of these soils and sediments precluded penetration to greater depths. However, based on visual monitoring of progress of the soil auger, as well as information available from soil surveys, it is clear that in all cases the 100-cm sample, and often the 75-cm sample, represented unaltered parent material. Samples were collected from 10 locations in each vineyard, yielding a total of 40 samples per site (). At SV, samples were also collected from the three stratigraphic units exposed above the bedrock in the natural gully.
A map of soil conductivity was made at each site using a GSSI EMP-400 profiler. The sites were profiled just three days apart from one another, and no rain fell in the interim. The device was transported in GPS-enabled ‘freeway’ mode following the rows within the Marquette blocks. Conductivity, in mS/m, was determined from data collected at 15 Hz after field calibration at a carry height of 20 cm above the ground surface. Time between measurements was 0.5 s. A total of 1587 measurements were collected over 1061 m at the LP site, and 1439 measurements over 953 m at the SV site.
3.2. Laboratory methods
The samples collected from the LP and SV sites were subjected to a range of analyses to characterize their physical and chemical properties, as described in the supplementary materials. Briefly, subsamples were subjected to standard soil fertility analyses including measurement of pH, organic matter content, and abundance of base cations. The soil textural class was determined following the hydrometer method (Bouyoucos, Citation1936, Citation1962). Quantitative assessment of the fine fraction of each sample was also made using a laser diffraction particle size analyser. Thermogravimetric analysis was conducted over a temperature ramp from 25 to 1000°C to provide information about sample composition. For the 20 deepest ‘d’ samples, along with those collected from the gully at SV, mineralogy was assessed using X-ray diffraction and geochemistry was evaluated through X-ray fluorescence. Conductivity data were gridded using a kriging function to produce a map of each study area. Non-parametric statistics were utilized to assess the significance of contrasts between samples from different depths and from different sites, and a principal component analysis was conducted to evaluate relationships within results of the soil fertility analyses.
4. Results
4.1. Soil and sediment properties with depth
The fertility and grain size analyses conducted on these soil and sediment samples yielded a range of values (Table S2). The pH of most samples is near neutral, with an overall average of 6.7. Soil organic matter averages 1.8%. Ca is the most abundant extractable cation, followed by Mg and K. Extractable Al is also fairly high, averaging 37.3 ppm. Overall effective cation exchange capacity (eCEC) averages 8.5 cmol(+)/kg, with a range from 3.9 to 23.0. Ca base saturation averages 79.2%, with a range from 59.4 to 87.4%. Principal component analysis loads values of extractable Ca, Mg, and Fe on the first principal component (PC-1), Na strongly on PC-2, and values of extractable P, K, and Al evenly split between the two components.
The mean grain size of all samples, determined by laser scattering, is 50.5 um (coarse silt), whereas the median is finer on average (19.8 um, medium silt). The most abundant grain size class overall is very fine silt (25.4% by volume). Results of the hydrometer analysis reinforce the abundance of silt in these samples, with an overall average of 61.6%. Clay (<2 um) and sand (>63 um) are present in roughly equal abundance on a mass basis, ∼20%. During field sampling, larger granules and gravel were intentionally avoided, however, the analyzed soil and sediment samples nonetheless contain an average of 18.5% material >2 mm (by mass).
Several of the measured fertility and grain size metrics exhibit notable differences with depth (Tables S3 and S4). For instance, at both the LP and SV sites, pH is lowest in the sample from 25 cm and increases significantly at deeper levels. Abundance of material >2 mm also increases significantly in deeper samples. In contrast, organic matter content and exchangeable acidity exhibit the opposite trend, with the highest values in the shallowest sample.
The gully at the north end of the SV site provided access to material that was beyond the reach of the soil auger operated from the surface. The uppermost sample from this exposure, SV-A, was taken from a ∼15-cm thick layer with fine-to-medium granular structure. The intermediate sample (SV-B) was from a ∼120-cm thick layer with seemingly greater clay content. The lowest sample, SV-Till, was collected from a dense clay-rich diamicton forming the floor of the stream channel at a depth >135 cm below the surface. It is important to note that the top of this exposure is a few meters lower than the ground surface in the vineyard. On the basis of natural exposures farther downstream, the basal till layer is ∼2 m thick over Monkton Quartzite bedrock.
Analysis of the samples from this gully yielded values for some metrics that were similar to those measured for the samples from auger holes at the SV site, and some values that were notably different (). For instance, the pH of 4.8 and Ca base saturation of 21.3% in the SV-A sample are the lowest measured in this study, and values of extractable Al and Fe (169 and 55 ppm, respectively) are much higher than those measured from the auger holes. Most other values are consistent with the range measured for the other samples, and typically there is a progression of increasing values with depth (for instance pH, clay content, extractable Na, and Mg base saturation), or decreasing values with depth (organic content, sand content, and extractable Al and Fe). For some metrics, like extractable P, K, and Mg, the values for the SV-B and SV-Till sample were nearly identical, and different than the SV-A (). Samples SV-A and SV-B classify as Loams, whereas SV-Till classifies as a Clay Loam with 34% clay.
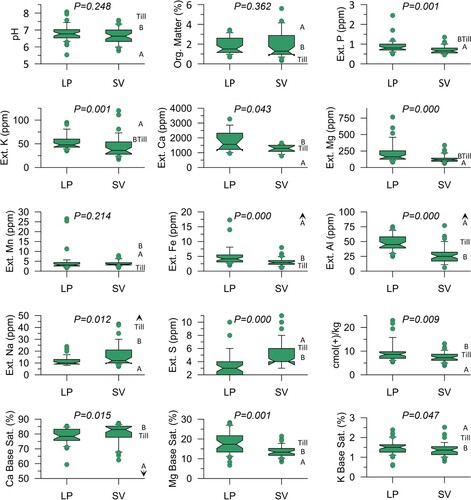
Figure 3. Boxplots of measured soil fertility data grouped by study site. P-values for differences were determined with a non-parametric Mann-Whitney U-test. ‘A’, ‘B’, and ‘Till’ denote the values measured for the three deep samples collected from the gully at the SV site ().
4.2. Soil and sediment properties compared between sites
Application of a Mann-Whitney U-test reveals that extractable P, K, Ca, Mg, Fe, and Al are all significantly more abundant at the LP site (, Table S2). In contrast, extractable Na and S are more abundant at SV. Overall eCEC is correspondingly higher at LP, along with Mg and K base saturation. Although the difference in mean values is small, the Ca base saturation measurements made at the SV are significantly greater than values measured at the LP.
Principal component analysis applied to extractable P, K, Ca, Mg, Fe, al, and Na, partitioned by site, reveals further distinctions. Extractable Ca and Fe both load heavily on PC-1 (0.926 and 0.826, respectively) at LP, in contrast to SV where Ca aligns with PC-1 (0.875) and Fe with PC-2 (0.906). These and other differences are presented graphically in Figure S2, where vectors closer together indicate greater similarity, and more orthogonal vectors correspond to greater dissimilarity.
Mean grain size determined by laser scattering is significantly greater at SV (73.4 vs. 27.6 um), although the median grain sizes of samples from these sites are not significantly different (9.5 um at LP vs. 30.2 um at SV, p = 0.290). Coarse, medium, and fine sand are all significantly more abundant at SV, whereas very fine sand, coarse silt, medium silt and fine silt are significantly more abundant at LP (Table S2, Figure S3). Hydrometer analysis reveals that sand is more abundant (on a mass basis) at SV, whereas silt and clay are more abundant at LP. As a result, the majority of samples from LP fall in the Loam textural class (34 out of 40, 85%), in contrast with the SV site where only 17 samples classify as Loam (43%), and 15 samples (38%) are Sandy Loams (Figure S4).
On a per site basis, extractable Mg and Al, along with base saturation of Mg, are all notably greater in deeper horizons at LP (Table S3). Extractable Mn is also much higher in the deepest sample at this site (average of 8.2 vs. 3.4 in the upper three sampled depths). At the SV site, extractable K and Mn are notably high in surface horizons, whereas base saturation of Ca and Mg, as well as coarse fraction abundance, all increase significantly with depth (Table S4).
Geochemical results from XRF reveal a general similarity between the deeper sediments at the two study sites. The overall average abundance of SiO2 is 73%, followed by Al2O3 at 10.9% and Fe2O3 at 4.7% (Table S5). The most abundant trace elements are Ba (average of 695 ppm), Zr (410 ppm), and Sr (159 ppm). Comparison between sites reveals that abundances of TiO2, Fe2O3, Rb, and Sr are significantly greater at SV. These values also increase with depth to the SV-Till sample collected from the base of the gully. Plotting of the results from the auger holes on a ternary diagram with axes CaO, Fe2O3 + MgO, and NaO + K2O reveals that four samples from the LP site (LP-1, 3, 5, and 9) can be distinguished from the others by their notably higher CaO content (Figure S5).
X-ray diffraction demonstrates that the suite of detectable minerals present in the 100-cm samples is consistent between the LP and SV sites (Figure S6). Similar patterns were also noted for the gully samples from SV. In diffraction patterns for all bulk samples, diagnostic peaks for quartz and feldspar are present, along with subtle peaks for the iron oxide goethite. Peaks representative of carbonate minerals were not detected in these analyses. Ratios of the magnitude of the main quartz peak (20° 2Θ) to the sum of the K-feldspar and plagioclase peaks average 7, with no significant difference between the two sites. In scans of oriented powders made from the <2-um fraction of all samples, quartz and feldspar peaks are again visible, along with peaks for vermiculite (sharp 001 at 6.5° 2Θ), K-mica (001, 8.8° 2Θ and 002, 17.8° 2Θ), and chlorite (002, 12.5° 2Θ, 003, 18.8° 2Θ, and 004, 25° 2Θ). Ratios of the magnitude of the main quartz peak to the chlorite 001 average 3.6 and are higher in the samples from SV. This ratio is also greater in the three deeper samples collected from the gully at the SV site, with an overall maximum value of 12.1 in the deepest sample.
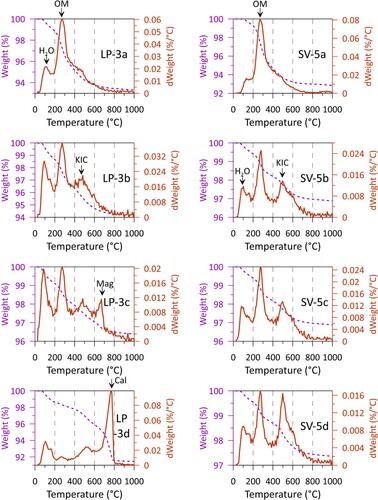
Thermogravimetric analysis applied to the full suite of samples reveals further similarities and differences between the study sites ( and Table S6). All samples have prominent peaks of mass loss at ∼100°C (water) and 250°C (organic matter). Numerous samples from LP, along with all samples from 75 and 100 cm at SV, display a peak at 500°C, corresponding to the clay minerals kaolinite, illite, and chlorite (). These three peaks are also apparent in the gully samples from SV. In contrast, several deeper samples at the LP site also exhibit a peak at 650°C, which is not seen in any samples from SV (, Table S6). The identity of this peak is unclear; however, it may reflect magnesite (650°C) (Cuthbert & Richard, Citation1947). In addition, the 100-cm (d) samples from LP-1, 3, 5, 7, and 9 (most of which plotted with higher CaO in Figure S4) exhibit a major peak at 800°C that is not seen in the SV samples (). Previous study has demonstrated that weathered, less crystalline calcite loses mass at ∼800°C (Földvári, Citation2011), thus it is possible that some deep samples from LP contain weathered calcite that is present in sufficient quantities to be detectable by TGA, but lacks the crystallinity necessary for detection by XRD.
Figure 4. Representative results from thermogravimetric analysis (25–1000°C) for samples LP-3 and SV-5 at four different depths. Dashed line displays mass loss, whereas solid orange line displays the first derivative of mass (dWeight). The major peaks identified include H2O-water, OM-organic matter, KIC-kaolinite/illite/chlorite, Mag-magnesite, Cal-calcite.
4.3. Spatial variability of soil and sediment properties
Values of soil fertility measurements and grain size results were averaged for each auger hole and plotted in a GIS to evaluate spatial patterns within the sampled area of each vineyard. At LP, few clear patterns emerge; the variation in most values is distributed fairly evenly across the study site. The exception is values of extractable P, K, Fe, Al, Na, eCEC, and Mg base saturation, all of which tend to be higher in the southern part of the Marquette block. Clearer spatial patterns are present at SV where extractable Mn, Fe, and Al, exchangeable acidity, Mg base saturation, mean grain size, abundance of sand and clay, and the abundance of MgO and Fe2O3 are all distinctly higher in the western part of the Marquette block. Conversely, pH, organic content, extractable B, Ca base saturation, and silt abundance are all lower to the west. Because the study area at SV slopes gently westward (), these differences in measured properties appear to follow topographic position.
4.4. Soil conductivity
Data collected with the EMP-400 reveal contrasts in soil conductivity within and between the two study sites. Measured values are significantly higher at SV, with a mean of 4.2 vs. 3.4 mS/m at LP (Figure S7). At LP, measured and gridded values () are generally lower along the central north-south axis of the Marquette block (∼1–3 mS/m), are particularly low across the northern extent of the measured area, and are notably higher to the east and west (values to 6 mS/m). In contrast, at SV values are generally low to the east (∼2–6 mS/m) and rise in the lower elevation areas to the west, reaching maxima >10 mS/m.
Figure 5. Conductivity maps of the LP and SV sites (UTM Zone 18N). Data were collected along transects shown by the dotted gray lines. Labeled white circles are the locations of the auger holes where soil samples were collected. The color scale in the background represents conductivity values across each study interpolated by a kriging function. Note the greater scale range at the SV site.
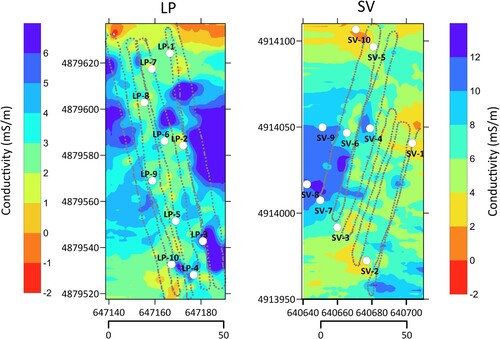
Conductivity values at the locations where auger holes were drilled at LP and SV exhibit a significant correlation with several grain size metrics; no correlations were noted between conductivity and measured soil fertility values. In the results from laser scattering, coarser mean grain size, and greater abundances of coarse, medium, and fine sand exhibit a significant positive correlation with conductivity. Conversely, abundances of very fine sand, along with coarse, medium, and fine silt, are negatively correlated with conductivity. Clay content determined by laser scattering is not significantly correlated to conductivity; however, there is a strong positive correlation between conductivity and clay content measured on a volume basis with the hydrometer method. Overall, conductivity is higher in soils with greater amounts of both coarse and fine material; conductivity is suppressed in areas where soils and surficial sediments contain a higher abundance of silt. The maps of soil conductivity (), therefore, can be considered a proxy for spatial variations in grain size distribution at each study site.
5. Discussion
5.1. Soil development
The properties of the soil and sediment samples observed in the field and measured in the laboratory are typical for soils and surficial sediments in the Champlain Valley. For instance, the brownish (∼10YR 4/3) colors reported for the B horizons of Amenia and Hinesburg soil profiles (Table S1) match the colors observed during field sampling. Similarly, the reported textures of Silt Loam to Loam for the Amenia, and Loamy Sand for the Hinesburg are corroborated by the hydrometer analysis in this study. The yellowish-brown masses of iron accumulation that are characteristic of the Amenia soil series were noted during the auguring effort at the LP site, but were not seen at SV. Furthermore, the deeper parts of the reference profile of the Hinesburg soil are described as having thin strata of very fine sand that control parting planes. This observation matches the presence of water-lain sediment at the SV site inferred from the stratigraphy in the gully and mapping of the former extents of Lake Vermont and the Champlain Sea. Therefore, although full soil profiles were not described at LP and SV, a correspondence between the existing soil mapping and the properties of the soils sampled in the field is obvious.
The extent of pedogenesis in these soil profiles is primarily limited to the formation of Bw horizons with colors that diverge slightly from the underlying parent material (Table S1). In the Amenia soil, weak to moderate, granular to subangular blocky structures have developed; the coarser Hinesburg soil, in contrast, exhibits a single-grain structure. The reference profiles of both soil series exhibit slight reactions with acid in their deeper levels. This observation implies the presence of carbonate minerals that have not been fully leached by infiltrating water. This observation supports the interpretation that deep samples from LP, which exhibited strong mass loss ∼800°C (), may contain residual, heavily weathered calcite.
Consideration of the factorial model for soil formation (Jenny, Citation1983) provides further insights. Given their proximity, climatic conditions are likely similar at the two sites. As noted previously, the LP site is nearly flat, whereas SV slopes gently to the west (). However, this subtle difference is unlikely to have exerted a major influence on soil development. In terms of vegetation, both sites were presumably vegetated by native clayplain forest for most of the Holocene (Murray, Citation2017) before being cleared for agriculture following European settlement in the 1800s (McGrory Klyza & Trombulak, Citation2015). In the decades immediately before planting of the Marquette vines, both sites were used for growing hay. Thus, it is unlikely that differences in soils between the sites can be traced back to the presence of contrasting vegetation communities. Finally, although the LP site emerged above the proglacial waters of Lake Vermont a few thousand years before the marine incursion withdrew from SV, soils at both locations are essentially of Holocene age. Overall, in terms of soil-forming factors, the main variable governing pedogenesis at these two sites is the parent material, which in turn is controlled by the similarities and differences in their geologic history.
5.2. Vineyard fingerprint and overall connections to geologic setting
The major motivation for this investigation was the desire to test whether VGI could identify a contrast between sites exhibiting considerable similarity in physical setting and soil-forming factors. Indeed the LP and SV vineyards share a common landscape position and appear very similar to the casual observer, and have grown many of the same grape varieties for the past ∼20 years. Yet the VGI of the two sites is not identical because of aspects of their geologic history over different time scales.
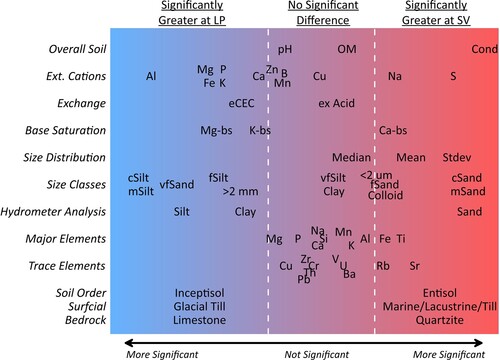
presents the metrics quantified for the samples from the two sites, along with fundamental information about the geology of the two vineyards. Metrics are grouped by broad types, listed at the left, and arranged horizontally along a scale where increasing distance from the center represents greater statistical significance. Values that are greater at LP are on the left side, those greater at SV are on the right, and everything in the middle exhibits non-significant differences (p > 0.05) between the two locations. This visual representation of the VGI can be considered as the fingerprint of the two sites, highlighting similarities and differences in a way that can be traced back to geology. At the bottom, the fundamental contrast between bedrock lithology and late-Quaternary sediments is presented. The LP site features a simple stratigraphy of glacial till overlying carbonate bedrock. This location was submerged briefly by the highest level of Lake Vermont (), but the land surface here was reworked by waves as the water level fell, removing any obvious accumulations of lacustrine sediment. Thus, the Amenia soil at LP (Inceptisol order) has formed primarily in till containing abundant fragments of underlying carbonate rock. This history is reflected both in the stoniness of the site, which challenged soil augering, and in the presence of carbonate minerals suggested by thermogravimetric analysis.
Figure 6. Visual representation of the VGI ‘fingerprint’ distinguishing the LP and SV sites. Basic site characteristics are presented at the bottom, and groups of measured geochemical, grain size, and soil fertility metrics are presented above. The two dashed white lines represent the significance threshold (p = 0.050); metric plotted to the left of the left line are significantly greater at LP, whereas those to the right of the right of the right line are significantly greater at SV. Metrics plotted between the two dashed lines exhibit no significant difference between the two sites.
In contrast, the SV site is underlain by quartzite bedrock, as confirmed in the gully north of the vineyard (). This bedrock is mantled by a more complicated stratigraphy that could include as many as three units, each with a contrasting geologic history. Dense basal till containing abundant quartzite fragments is exposed in the stream bed in the gully, and the Stockbridge soil series, which is mapped upslope from the Marquette block () is typically developed directly in till. Stratigraphically above the till are water-lain sediments representing Lake Vermont, which is consistent with the submergence of this site for longer, and under deeper water, than LP where analogous sediments were not observed (). These sediments at SV are perhaps unexpectedly stony for a lacustrine deposit; however, bio- and cryotubation could bring coarse material up from the deeper till, slope processes could transport coarse fragments downslope from positions where till is at the surface, and the sediments of glacial Lake Vermont are known to contain coarse fragments deposited as ice-rafted debris (Stewart & MacClintock, Citation1970). Finally, the SV site is located at the mapped edge of the Champlain Sea excursion (), meaning that nearshore marine sediments were likely deposited here and reworked as the littoral zone descended downslope to the west.
With this geologic framework as a starting point, the fingerprint of the soils and sediments at both sites can be considered in relation to bedrock and Quaternary history. At LP, for instance, the sampled soils and sediments are significantly finer, with greater abundance of clay (by the hydrometer method), more abundant silt, and a lower conductivity. At the same time, the abundance of granules in the soil and sediment samples (material >2 mm, but smaller than the gravel fragments avoided during sampling) is higher. Both of these observations are consistent with clast-rich glacial till as the soil parent material at this site. In contrast, at SV, the abundance of sand and sand size classes is significantly greater, as is the overall mean grain size. Coarser material here reflects proximity to the former Champlain Sea shoreline, where wave action winnowed out the silt fraction. The spatial pattern of higher sand content downslope to the west, which is strongly correlated with higher soil conductivity values (), provides additional support for the interpretation that soils in this section of the Marquette block at SV are distinct from those farther upslope and from those at LP.
In terms of geochemistry, abundances of most major and trace elements are not significantly different between the two sites. A similar result is revealed by consideration of the equivalent assemblages of minerals at the two sites detectable by XRD analysis. Together, this consistency reflects the tendency of glacial processes to homogenize material during transport and deposition. Nonetheless, the higher abundance of both Fe and Ti at SV may reflect an input from the underlying iron-rich bedrock, the influence of which is clearly seen in the greater abundance of quartzite clasts in these sediments. The greater abundance of Rb and Sr at the SV could also reflect aspects of the underlying rock, or the properties of the Champlain Sea sediments that were not deposited at LP.
Many soil fertility results can also be interpreted as extensions of the underlying geology. For instance, the significantly higher abundance of many extractable cations at LP is consistent with both the greater solubility of the carbonate in the sediments at this site, and the significantly greater effective cation exchange capacity matches the higher clay content of the soil. The only extractable cations that were significantly more abundant at SV are Na and S, which might relate back to the former submergence of this site under marine water.
Lastly, with respect to overall soil properties, the significant tendency for measured conductivity values at SV to be higher than LP (Figure S7) ties into the greater water content of the soils there, particularly at lower elevations in the downslope western part of the vineyard. Although it cannot be proven from the available data, if the salt content of ground and soil water at this site is slightly higher, reflecting the former marine submergence and perhaps signalled by the greater extractable Na content, then that would further explain the higher conductivity values. In contrast, the lack of a significant difference in pH or organic matter content between the sites reflects the similarity of the climate, mineralogy, and vegetation/land-use history of the two locations.
The interpretation that differences in soil and sediment properties of LP and SV can be traced back to late-Quaternary history is supported by work in other winemaking regions, which concluded that landscape history determines soil functional character (e.g. Costantini et al., Citation2012). For instance, in the Niagara Region of Ontario, it was proposed that distinct sub-appellations be established following not just climatic zones, but distinctions in Quaternary sediment types (Haynes, Citation2000). In Oregon, the Willamette Valley American Viticultural Area (AVA) was similarly subdivided based on contrasting soils and sediment types (Burns, Citation2012). In the Napa Valley of California, the role of residual, alluvial, and fluvial sediments in controlling the water-holding ability of soil, with corresponding impacts on grape quality and character, has been extensively explored (Swinchatt et al., Citation2006). And in northern Italy, geology and geomorphology are included in a comprehensive database established to aid identification of which cultivars are likely to perform best in certain locations (Ferretti, Citation2020). The connection between geologic history and vineyard soil properties highlighted in this study, therefore, adds to a considerable literature that has approached this issue from a range of perspectives.
5.3. Implications for terroir
The idea of terroir has a long history of connection with physical setting (Unwin, Citation2012). Indeed, the persistent belief that one can sense unique aspects of a site in the wine that it produces is central to the concept that sensory aspects of fine wine are fundamentally linked to geology, soils, mineralogy and geochemistry (Haynes, Citation1999). Although modern wine production involves a multitude of steps that could divorce the resulting wine from any place-based ancestry, numerous investigations have demonstrated that aspects of physical setting, not to mention climatic conditions and management decisions made in the vineyard, do carry over into quantifiable properties of the resulting wine (e.g. Burns, Citation2012; Huggett, Citation2006; van Leeuwen et al., Citation2018). With this in mind, it is appropriate, therefore, to consider the results of this application of the VGI approach to these young vineyards in the Champlain Valley.
The array of similarities between the LP and SV sites makes it unsurprising that quality Marquette grapes can be grown at both of them. Even putting aside management strategies that might differ between the two vineyards, it is clear that the climate and overall soil properties in the Champlain Valley are conducive to the growth of this varietal. Yet despite this similarity, the differences in the VGI of the two sites, emphasized in , suggest that grapes and possibly wine from the two sites may not be identical. Differences in wine properties, even if wine-making techniques were held constant, might be expected if differences in water content (revealed by the soil conductivity mapping), moisture holding capacity (implied by the textural differences), and overall nutrient status (demonstrated by eCEC, base saturation, and the abundance of various extractable cations) led to contrasts in vine health and vigor (e.g. van Leeuwen et al., Citation2004). Direct chemical and sensory analysis of Marquette wines from LP and SV is beyond the scope of this study. However, the VGI determined for these two vineyards, highlighting similarities and distinction in their physical setting and soil properties, could be employed as foundation for controlled comparison of their wines. This exercise would be helpful in understanding the scientific underpinnings of terroir, and could further development of the burgeoning wine scene in colder parts of North America driven by the release of varietals like Marquette.
Supplemental Material
Download Zip (1.9 MB)Acknowledgments
The author thanks winemakers Chris Granstrom and Ethan Joseph for supporting this study and permitting sampling at their vineyards. Dan Needham at the Agricultural and Environmental Testing Lab of the University of Vermont efficiently completed the contracted soil fertility analyses. Eamon McMahon at Middlebury College Science and Technical Support Services assisted in constructing the sampling equipment.
Disclosure statement
No potential conflict of interest was reported by the authors.
Data availability statement
The samples analyzed in this study were collected from private vineyards with the understanding that the raw data not be published. Contact the author for details.
Additional information
Funding
References
- Bierman, P. R., Davis, P. T., Corbett, L. B., Lifton, N. A., & Finkel, R. C. (2015). Cold-based Laurentide ice covered New England’s highest summits during the Last Glacial Maximum. Geology, 43(12), 1059–1062. https://doi.org/10.1130/G37225.1.
- Bouyoucos, G. J. (1936). Directions for making mechanical analyses of soils by the hydrometer method. Soil Science, 42(3), 225–230. https://doi.org/10.1097/00010694-193609000-00007
- Bouyoucos, G. J. (1962). Hydrometer method improved for making particle size analyses of soils. Agronomy Journal, 54(5), 464–465. https://doi.org/10.2134/agronj1962.00021962005400050028x
- Braschi, E., Marchionni, S., Priori, S., Casalini, M., Tommasini, S., Natarelli, L., Buccianti, A., Bucelli, P., Costantini, E. A., & Conticelli, S. (2018). Tracing the 87Sr/86Sr from rocks and soils to vine and wine: An experimental study on geologic and pedologic characterisation of vineyards using radiogenic isotope of heavy elements. Science of the Total Environment, 628-629, 1317–1327. https://doi.org/10.1016/j.scitotenv.2018.02.069
- Burns, S. (2012). The importance of soil and geology in tasting terroir with a case history from the Willamette Valley, Oregon. In Percy H. Dougherty (Ed.), The geography of wine (pp. 95–108). Springer.
- Corbett, L. B., Bierman, P. R., Stone, B. D., Caffee, M. W., & Larsen, P. L. (2017). Cosmogenic nuclide age estimate for Laurentide Ice Sheet recession from the terminal moraine, New Jersey, USA, and constraints on latest Pleistocene ice sheet history. Quaternary Research, 87(3), 482–498. https://doi.org/10.1017/qua.2017.11
- Corbett, L. B., Bierman, P. R., Wright, S. F., Shakun, J. D., Davis, P. T., Goehring, B. M., Halsted, C. T., Koester, A. J., Caffee, M. W., & Zimmerman, S. R. (2019). Analysis of multiple cosmogenic nuclides constrains Laurentide Ice Sheet history and process on Mt. Mansfield, Vermont’s highest peak. Quaternary Science Reviews, 205, 234–246. https://doi.org/10.1016/j.quascirev.2018.12.014
- Costantini, E. A., Bucelli, P., & Priori, S. (2012). Quaternary landscape history determines the soil functional characters of terroir. Quaternary International, 265, 63–73. https://doi.org/10.1016/j.quaint.2011.08.021
- Cronin, T. M., Manley, P. L., Brachfeld, S., Manley, T. O., Willard, D. A., Guilbault, J.-P., Rayburn, J. A., Thunell, R., & Berke, M. (2008). Impacts of post-glacial lake drainage events and revised chronology of the Champlain Sea episode 13–9 ka. Palaeogeography, Palaeoclimatology, Palaeoecology, 262(1-2), 46–60. https://doi.org/10.1016/j.palaeo.2008.02.001
- Cuthbert, F. L., & Richard, A. R. (1947). Differential thermal analysis of some carbonate minerals. American Mineralogist: Journal of Earth and Planetary Minerals, 32(3-4), 111–116.
- Dix, G. R., Nehza, O., & Okon, I. (2013). Tectonostratigraphy of the Chazyan (Late Middle–Early Late Ordovician) Mixed Siliciclastic–Carbonate Platform, Quebec Embayment. Journal of Sedimentary Research, 83(6), 451–474. https://doi.org/10.2110/jsr.2013.39
- Ferretti, C. G. (2019). Relationship between the geology, soil assessment, and terroir of Gewürtztraminer vineyards: A case study in the Dolomites of northern Italy. Catena, 179, 74–84. https://doi.org/10.1016/j.catena.2019.03.044
- Ferretti, C. G. (2020). A new geographical classification for vineyards tested in the South Tyrol wine region, northern Italy, on Pinot Noir and Sauvignon Blanc wines. Ecological Indicators, 108, 105737. https://doi.org/10.1016/j.ecolind.2019.105737
- Földvári, M. (2011). Handbook of thermogravimetric system of minerals and its use in geological practice (Vol. 213). Geological Institute of Hungary Budapest.
- Gerrath, J., Posluszny, U., & Melville, L. (2015). Identification of common cold-climate grapes in North America. In J. Gerrath, U. Posluszny, & L. Melville (Eds.), Taming the wild grape: Botany and horticulture in the Vitaceae (pp. 115–169). Springer International Publishing.
- Greenough, J. D., Mallory-Greenough, L. M., & Fryer, B. J. (2005). Geology and wine 9: Regional trace element fingerprinting of Canadian wines. Geoscience Canada, 32(3), 129–137.
- Haynes, S. J. (1999). Geology and wine 1. Concept of terroir and the role of geology. Geoscience Canada, 26(4), 190–194.
- Haynes, S. J. (2000). Geology and wine 2. A geological foundation for terroirs and potential sub-appellations of Niagara Peninsula wines. Geoscience Canada, 27(2), 67–87.
- Hemstad, P., & Luby, J. (2008). Grapevine plant named ‘Marquette.’ Google Patents.
- Huggett, J. M. (2006). Geology and wine: A review. Proceedings of the Geologists’ Association, 117(2), 239–247. doi:10.1016/S0016-7878(06)80012-X
- Jenny, H. (1983). Factors of soil formation: A system of quantitative pedology. McGraw-Hill New York.
- Landing, E. (2012). The great American carbonate bank in eastern Laurentia: Its births, deaths, and linkage to paleooceanic oxygenation (Early Cambrian–Late Ordovician). In J. R. Derby, R. D. Fritz, S. A. Longacre, W. A. Morgan, & C. A. Sternbach (Eds.), The great American carbonate bank: The geology and economic resources of the Cambrian – Ordovician Sauk megasequence of Laurentia (pp. 451–492).
- Lemaire, D., & Kasserman, D. (2012). Bordeaux and burgundy: A comparison of Two French wine regions in transition. In Percy H. Dougherty (Ed.), The geography of wine (pp. 61–80). Springer.
- Maltman, A. (2008). The role of vineyard geology in wine typicity. Journal of Wine Research, 19(1), 1–17. https://doi.org/10.1080/09571260802163998
- Manley, P. L., Manley, T. O., Hayo, K., & Cronin, T. (2012). Small-scale lacustrine drifts in Lake Champlain, Vermont. Journal of Great Lakes Research, 38, 88–100. https://doi.org/10.1016/j.jglr.2011.05.004
- McGrory Klyza, C., & Trombulak, S. C. (2015). The story of Vermont: A natural and cultural history. University Press of New England.
- Murray, H. F. (2017). Stand Dynamics and Disturbance History of Champlain Valley Clayplain Forests. UVM Honors College Senior Theses. 162. https://scholarworks.uvm.edu/hcoltheses/162
- Parent, M., & Occhietti, S. (1988). Late Wisconsinan deglaciation and Champlain sea invasion in the St. Lawrence valley, Québec. Géographie Physique et Quaternaire, 42(3), 215–246. doi:10.7202/032734ar
- Ratcliffe, N. M., Stanley, R. S., Gale, M. H., Thompson, P. J., & Walsh, G. J. (2011). Bedrock Geologic Map of Vermont. U.S. Geological Survey Scientific Investigations Map 3184, 3 Sheets, Scale 1:100,000. U.S. Geological Survey.
- Rayburn, J. A., Knuepfer, P. L., & Franzi, D. A. (2005). A series of large, late wisconsinan meltwater floods through the champlain and hudson valleys, New York state, USA, New York State, USA. Quaternary Science Reviews, 24(22), 2410–2419. https://doi.org/10.1016/j.quascirev.2005.02.010
- Rice, S., Koziel, J. A., Dharmadhikari, M., & Fennell, A. (2017). Evaluation of tannins and anthocyanins in marquette, frontenac, and St. Croix cold-hardy grape cultivars. Fermentation, 3(3), 47. https://doi.org/10.3390/fermentation3030047
- Richard, P. J. H., & Occhietti, S. (2005). 14C chronology for ice retreat and inception of Champlain Sea in the St. Lawrence Lowlands, Canada. Quaternary Research, 63(3), 353–358. https://doi.org/10.1016/j.yqres.2005.02.003
- Rodgers, J. (1971). The taconic orogeny. Geological Society of America Bulletin, 82(5), 1141–1178. https://doi.org/10.1130/0016-7606(1971)82[1141:TTO]2.0.CO;2
- Roullier-Gall, C., Lucio, M., Noret, L., Schmitt-Kopplin, P., & Gougeon, R. D. (2014). How subtle is the “terroir” effect? Chemistry-related signatures of two “climats de Bourgogne”. PLoS One, 9(5), e97615. https://doi.org/10.1371/journal.pone.0097615
- Rowley, D. B., & Kidd, W. S. F. (1981). Stratigraphic relationships and detrital composition of the medial Ordovician flysch of western New England: Implications for the tectonic evolution of the Taconic orogeny. The Journal of Geology, 89(2), 199–218. https://doi.org/10.1086/628580
- Schaller, K. (2017). Terroir-Myth and/or Reality-Outstanding Marketing Idea? A Review. Notulae Botanicae Horti Agrobotanici Cluj-Napoca, 45(2), 332–342. https://doi.org/10.15835/nbha45210898
- Stewart, D. P., & MacClintock, P. (1970). Surficial Geologic Map of Vermont: Vermont Geological Survey, scale1:250,000.
- Swinchatt, J. P., Howell, D. G., & MacDonald, S. L. (2018). The scale dependence of wine and Terroir: Examples from coastal California and the Napa Valley (USA). Elements: An International Magazine of Mineralogy, Geochemistry, and Petrology, 14(3), 179–184. https://doi.org/10.2138/gselements.14.3.179.
- Swinchatt, J. P., Howell, D. G., Silacci, M., Macqueen, R. W., & Meinert, L. D. (2006). A review of napa valley, California, terroir. Geoscience Canada Reprint Series, 9, 217–231.
- Tescione, I., Marchionni, S., Mattei, M., Tassi, F., Romano, C., & Conticelli, S. (2015). A comparative 87Sr/86Sr study in Red and White wines to validate its use as geochemical tracer for the geographical origin of wine. Procedia Earth and Planetary Science, 13, 169–172. https://doi.org/10.1016/j.proeps.2015.07.039
- Ubalde, J. M., Sort, X., Zayas, A., & Poch, R. M. (2010). Effects of soil and climatic conditions on grape ripening and wine quality of cabernet sauvignon. Journal of Wine Research, 21(1), 1–17. https://doi.org/10.1080/09571264.2010.495851
- Unwin, T. (2012). Terroir: At the heart of geography. In Percy H. Dougherty (Ed.), The geography of wine (pp. 37–48). Springer.
- USDA Plant Hardiness Zone Map. (2020). https://planthardiness.ars.usda.gov/PHZMWeb/.
- van Leeuwen, C. (2010). Terroir: The effect of the physical environment on vine growth, grape ripening and wine sensory attributes. In A. G. Reynolds (Ed.), Managing wine quality (pp. 273–315). Woodhead Publishing.
- van Leeuwen, C., & de Rességuier, L. (2018). Major soil-related factors in terroir expression and vineyard siting. Elements, 14(3), 159–165. https://doi.org/10.2138/gselements.14.3.159
- van Leeuwen, C., Friant, P., Chone, X., Tregoat, O., Koundouras, S., & Dubourdieu, D. (2004). Influence of climate, soil, and cultivar on terroir. American Journal of Enology and Viticulture, 55(3), 207–217. https://doi.org/10.5344/ajev.2004.55.3.207
- van Leeuwen, C., Roby, J.-P., & de Rességuier, L. (2018). Soil-related terroir factors: A review. Oeno One, 52(2), 173–188. https://doi.org/10.20870/oeno-one.2018.52.2.2208
- van Leeuwen, C., & Seguin, G. (2006). The concept of terroir in viticulture. Journal of Wine Research, 17(1), 1–10. https://doi.org/10.1080/09571260600633135
- Victor, V., Ross, S., Karine, P., André, P., Jean-François, H., & David, W. (2015). Strontium isotope characterization of wines from the Quebec (Canada) terroir. Procedia Earth and Planetary Science, 13, 252–255. https://doi.org/10.1016/j.proeps.2015.07.059
- Vinciguerra, V., Stevenson, R., Pedneault, K., Poirier, A., Hélie, J.-F., & Widory, D. (2016). Strontium isotope characterization of wines from Quebec, Canada. Food Chemistry, 210, 121–128. https://doi.org/10.1016/j.foodchem.2016.04.017
- White, R. E. (2020). The value of soil knowledge in understanding wine terroir. Frontiers in Environmental Science, 8, https://doi.org/10.3389/fenvs.2020.00012
- Wilson, J. E. (2001). Geology and wine 4. The origin and odyssey of terroir. Geoscience Canada, 28, 139–141.
- Wine | Agricultural Marketing Resource Center. (2020). https://www.agmrc.org/commodities-products/fruits/wine.
- Wine Production by State 2020. (2020). https://worldpopulationreview.com/state-rankings/wine-production-by-state.
- Winkler, A. J., Cook, J. H., Kliewer, W. M., & Lider, L. A. (1974). General viticulture (Vol. 10, pp. 00010694–197512000). University of California Press.