
ABSTRACT
The health and ecological harms created and spread by firms active in many unhealthy commodity industries (UCIs) have received considerable attention from the public health community. However, less focus has been paid to analysing the distribution of wealth and income – important social and economic determinants of health – by these industries. This study aimed to examine long-term trends in wealth and income distribution by publicly listed corporations active in four UCIs: fossil fuels; tobacco; ultra-processed foods; and alcohol. Quantitative analysis of a range of data was conducted for firms listed on stock exchanges in the United States (US). Wealth and income distribution metrics were analysed at the industry level, including effective corporate tax rates and shareholder value ratios. The equity ownership structures and investor location of 20 of the largest firms were also explored. Since the 1980s, US-listed firms in the examined UCIs have distributed much less of their wealth and income to governments and much more to shareholders and investors mostly based in high-income countries. The study provides evidence that firms active in UCIs create a ‘double burden of maldistribution’: their externalised social and ecological harms disproportionately affect disadvantaged population groups and governments in low- and middle-income countries; whilst, simultaneously, they are increasingly transferring wealth and income to a group over-represented by a small and privileged elite. The identified distributive injustice warrants increased policy attention.
Introduction
In recent years, the activities of firms active in numerous unhealthy commodity industries (UCIs) have come under increasing levels of public health scrutiny (Freudenberg & Galea, Citation2008; Millar, Citation2013; Moodie et al., Citation2013). This reflects growing recognition that a considerable proportion of the global burden of disease can be attributed to powerful firms with vested interests in maximising profits without sufficient concern for adverse human and planetary health consequences (Chan, Citation2013; West & Marteau, Citation2013). Indeed, every year, poor diets, tobacco, air pollution, and alcohol are associated with a conservatively estimated 11 million, 8 million, 7 million, and 3 million deaths, respectively, worldwide (GBD 2017 Diet Collaborators, Citation2019; World Health Organization, Citation2018, World Health Organization, Citation2020; World Health Organization, Citation2021). These risk factors directly relate to the commodities produced and marketed by the ultra-processed food (UPF), tobacco, fossil fuel, and alcohol industries. The social and economic burden of illness attributable to these risk factors disproportionately affects disadvantaged population groups and the governments of low and middle-income countries (LMICs), thereby acting as a major barrier to health equity, poverty reduction, and sustainable and inclusive development (Collin & Hill, Citation2015; UN Interagency Task Force on NCDs, Citation2019).
Although the creation and distribution of harms by firms active in UCIs have received considerable public heath attention, less focus has been paid to analysing the distribution of the wealth and income produced by firms in the same industries. Yet, the way in which corporations, and especially publicly listed corporations, distribute wealth and income (hereinafter, corporate wealth and income distribution), is likely to impact health equity, both by reinforcing the maldistribution of harms (e.g. increased allocation of corporate resources to political activities to influence regulation), as well as by shaping important structural determinants of ill-health (Commission on Social Determinants of Health, Citation2008; Ottersen et al., Citation2014; Wood, Baker et al., Citation2021). Indeed, corporate wealth and income distribution is known to be a major driver of widening wealth inequality both between and within countries, and is often structured to further increase the power of large corporations that already have extensive political and economic influence (Clarke, Citation2020; Fuchs & Glaab, Citation2010; Stiglitz, Citation2012; Wood, Williams et al., Citation2021). Despite these negative impacts on health equity, corporations in UCIs often use arguments related to the ways in which they create and distribute wealth to highlight their economic ‘value’, especially as part of their efforts to influence public policy intended to address the maldistribution of harms they perpetuate (Mialon et al., Citation2015; Savell et al., Citation2016; Ulucanlar et al., Citation2016). Such arguments warrant analytical scrutiny from the public health community.
Given the abovementioned considerations, this study aimed to examine trends in corporate wealth and income distribution in four key UCIs: UPF, tobacco, fossil fuel, and alcohol industries. The goal of doing so was to outline a broad public health approach to the analysis of UCIs, complementing analyses of their creation and distribution of harms by also considering the way in which they distribute wealth and income. The findings were used to inform discussion on how unequal corporate wealth and income distribution compounds the distributive injustice currently evidenced in relation to UCIs.
Methods
The paper focuses on wealth and income distribution by publicly listed corporations in four UCIs responsible for a considerable proportion of the global burden of disease – UPF, tobacco, fossil fuel, and alcohol. To analyse corporate wealth and income distribution, a descriptive analysis of company, market, and ownership data was conducted. The database used to source company data, Compustat North America, had data for firms listed on stock exchanges in North America, including those headquartered outside of North America (Refinitiv, Citation2021b). To avoid issues with using historical currency exchange rates, we focussed solely on firms listed on United States (US) stock exchanges. As of January 2021, US stock markets accounted for nearly 56% of the total global equity market value, more than 80% of which was captured by the world’s two largest stock exchanges – the New York Stock Exchange and Nasdaq (Ali, Citation2020; Statista Research Department, Citation2021).
Industry and firm selection
The Global Industry Classification Standard (GICS) was used to disaggregate company data at the following industry and sub-industry levels: oil, gas and consumable fuels; brewers, distillers and vintners; and tobacco. To isolate firms primarily active in UPF sub-industries, we cross-referenced the GICS sub-industries ‘soft drinks’ and ‘packaged foods and meats’ with the Standard Industrial Classification (SIC) grouping at the 4-digit level. We then excluded firms primarily active in agricultural production; fishing, hunting, and trapping; meat processing and packing; and dairy processing. describes the four industries selected for analysis.
Table 1. Size, number of active US-listed firms, and countries represented in the four unhealthy commodity industries selected for analysis, 2019.
In order to identify a purposive sample of firms from across these four UCIs, we identified the top five publicly listed corporations within each industry based on 2019 sales revenue. We then focused on these 20 firms in examining patterns of corporate ownership, wealth, and income distribution (see Supplementary File 1 for an overview of the sales revenue, industry share, and profits of the 20 firms selected).
Metrics and data sources
Various metrics and data sources (detailed below) were used to explore wealth and income distribution between firms and governments, and among market stakeholders. Where relevant, values were adjusted to the 2015 USD value using the World Bank’s GDP deflator dataset (World Bank, Citation2021).
Wealth distribution between firms and governments
Trends in the effective corporate tax rates aggregated at the industry level were calculated by dividing the total income taxes (domestic and foreign) by total pre-tax income (domestic and foreign). Time periods for analysis were determined by available company and inflation data.
Corporate wealth and income distribution: from consumers to shareholders
Several indicators were used to examine how the firms active in the four industries distribute wealth and income among their key market stakeholders. Sourcing data from Euromonitor International’s Passport database (Euromonitor International, Citation2021), we analysed trends in the distribution of consumption, using total sales revenue as a proxy. Specifically, we looked at total sales revenue for the UPF (packaged foods minus edible oils and dairy products, and soft drinks minus bottled water), tobacco, and alcohol industries from formal retail channels between 2007 (earliest data available) and 2019. For UPF products, data were available for 209 countries and territories (76 of which were considered HICs). For tobacco and alcohol products, data were available for 99 countries and territories (43 of which were considered HICs). Data were aggregated according to World Bank’s country classification by income level (World Bank, Citation2020c). No fossil fuel-related consumer data were available on Passport, and thus the fossil fuel industry was excluded from consumption analysis.
Second, we calculated the values of dividends and share repurchases aggregated at the industry level. Share repurchases refer to the situation when a firm buys back its own shares. This practice, which was illegal in the US up until 1982, has been described as a means of transferring wealth from corporations (income or debt) to shareholders and company executives by raising share prices and dividends per share, and manipulating firm performance metrics often linked to executive pay compensation (Lazonick, Citation2008; Lazonick et al., Citation2020). Drawing from Hager and Baines (Citation2020), we analysed aggregate shareholder value ratios – the total combined value of dividends and share repurchases relative to firm revenue (Hager & Baines, Citation2020). This ratio captures broad trends in corporate wealth and income distribution to shareholders relative to other avenues (e.g. long-term investment that benefits workers and society in general).
Third, we explored the ownership structures and investor location of the 20 selected firms. The analysis of ownership structure involved examining the percentage and value of shares held in these 20 firms by the world’s 10 largest institutional investors, by assets under management as of March 2021 (ADV Ratings, Citation2021). Investor location data were aggregated according to the World Bank’s country income status groupings. Ownership data were sourced from Orbis and Eikon databases (Bureau, Citation2021; Refinitiv, Citation2021a). The periods for analysis were determined by available data.
Results
Wealth and income distribution between firms and governments
Effective corporate tax rates
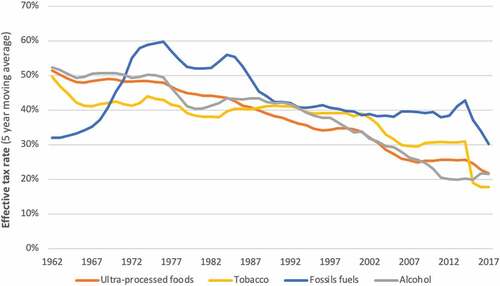
Overall, the average effective tax rate (ETR) of public US-listed corporations in the four UCIs decreased considerably from the early 1970s to 2019 (see ). Over the 5-year period between 1973 and 1978, the aggregate ETRs of corporations active in the UPF, tobacco, fossil fuel, and tobacco industries were 48.1%, 43.3%, 59.3%, and 50.1%, respectively. Between 2015 and 2019, these dropped to 21.7%, 17.8%, 30.2%, and 21.5%, respectively.
Figure 1. Aggregated effective tax rates for public US-listed corporations in four unhealthy commodity industries, 1960 to 2019.
Corporate wealth and income distribution: from consumers to shareholders
Distribution of consumption
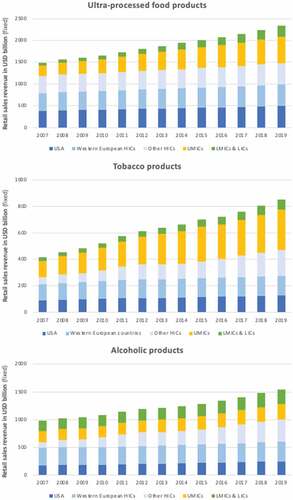
From 2007 to 2019, the percentage of global sales revenue generated in the LMICs with available data increased by 16% (20.5% to 36.5%) for UPF products and 8.6% (35.9% to 44.5%) for tobacco products (). Over the same period, this percentage decreased for alcoholic products by 3.9% (38.9% to 35.0%), although, the percentage of global sales revenue from alcoholic products generated in LMICs increased as a percentage of that generated in the US and Western Europe (76.4% to 89.3%).
Figure 2. Distribution of consumption according to total retail sales revenue (real values) generated from ultra-processed foods, alcohol, and tobacco products, 2007–2019.
Wealth transfers to shareholders
The combined value of dividends paid and share repurchases by public US-listed corporations active in the four UCIs increased dramatically from 1960 (US$12.6 billion in real terms) to the late 2000s (peak of US$305.5 billion in real terms in 2007), remaining relatively high after this (see , panel A). By 2019, the total adjusted values of dividends and share repurchases were US$49.4 billion for the UPF industry, US$20.2 billion for the tobacco industry, US$173.4 billion for the fossil fuel industry, and US$12.2 billion for the alcohol industry.
Figure 3. Wealth transfers to shareholders (adjusted values) and the shareholder value ratios of public US-listed corporations active in the four unhealthy commodity industries, 1960–2019.
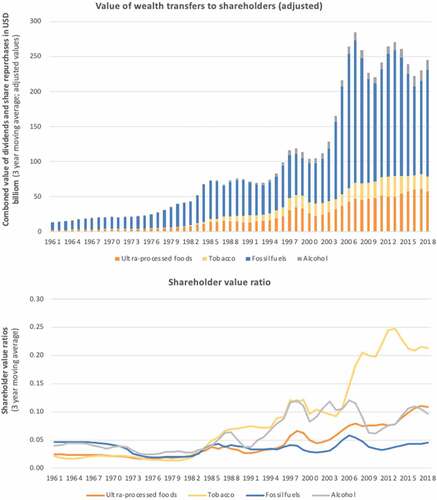
From the mid-1970s, the average shareholder value ratio increased in the four UCIs, signifying that these industries have distributed greater shares of their wealth and income to shareholders as opposed to other stakeholders (e.g. workers via reinvestment) (, panel B). This increase in average shareholder value ratio has been particularly marked in the tobacco industry, increasing nearly 15-fold since the late 1970s. The shareholder value ratio of the UPF industry has more than doubled since 2000.
Common ownership by institutional investors
As of March 2021, the world’s two largest institutional investors, US-based Blackrock and Vanguard, held more than 10% of shares in nine of the 20 corporations selected for analysis. The world’s ten largest institutional investors held more than 10% of shares in 15 and more than 20% of shares in 11 of the 20 corporations (see Supplementary File 2 for more information on the ownership of shares held by the world’s 10 largest institutional investors).
Combined, 88.7% of the value of traded shares in the 20 corporations analysed were held by shareholders and investors based in HICs (see ). 56.0% and 27.6% of traded share value was held by shareholders and investors in the US and Western Europe, respectively. 10.0% of traded share value was held in China, largely due to the ownership structures of China Petroleum and PetroChina corporations. Only 1.3% of the total traded share value was held by shareholders and investors based in LMICs, excluding China, despite the main stock exchanges of two of the 20 listed corporations analysed – Fomento Economico Mexicano and Ambev – being in Mexico and Brazil, respectively. Only four lower MICs (Indonesia, India, Morocco, and Bolivia) were represented, whereas no low-income countries were represented.
Table 2. Traded share ownership of the top five firms in each industry, disaggregated by investor country of origin, 2021.
Discussion
The UPF, tobacco, fossil fuel, and alcohol industries appear to create and reinforce a ‘double burden of maldistribution’. It is well recognised that the considerable burden of social and ecological harms generated by these four industries disproportionately affects disadvantaged social groups, governments of LMICs, and, indeed, future generations (UN Interagency Task Force on NCDs, Citation2019; Moodie et al., Citation2013). What this paper has shown is that an increasing proportion of the wealth and income produced by publicly listed corporations active in these UCIs is being transferred to largely HIC-based shareholders and investors, a group over-represented by a small and privileged elite (Carlson, Citation2020; Gebeloff, Citation2021; Ireland, Citation2005; Lazonick, Citation2008). Such wealth is generated not only from the consumers burdened by many consumption-related harms, but also from forms of value extraction, such as share repurchases and corporate welfare in the form of tax incentives.
Although the corporate maldistribution of wealth and income is essentially a structural feature of modern capitalism, it represents a broad economic pathway by which UCIs impact on health inequalities. Moreover, the pattern of corporate wealth and income maldistribution in UCIs undermines, at least to some extent, commonly-used corporate and industry claims (e.g. as part of their corporate sustainability reporting and their efforts to oppose public policies intended to promote health and reduce health inequalities) that they create economic ‘value’ for society (Swinburn et al., Citation2019; Ulucanlar et al., Citation2016).
Since the 1980s, an increasing proportion of the revenue generated in the examined UCIs has been transferred to firm shareholders, a finding consistent with the shareholder primacy model of corporate governance (Clarke, Citation2020). Shareholder primacy is an important driver of increasing within-country wealth inequality in many advanced economies as it drives the systematic and continuous transfer of corporate wealth into the pockets of the very wealthy (Clarke et al., Citation2019). Global corporations that adhere to shareholder primacy also facilitate increasing flows of wealth from LMICs to HICs, thereby contributing to between-country wealth inequality (Stiglitz, Citation2017). This is consistent with our findings, which revealed that a considerable proportion of wealth generated by large firms in the UPF, alcohol, and tobacco industries flows out of emerging markets to shareholders based in HICs.
Our findings demonstrate that a considerable proportion of the shares of the largest firms are held by a small handful of the world’s largest institutional investors – a phenomenon often captured by the term ‘common ownership’ (OECD, Citation2017). Most of the wealth managed by these large institutional investors, often in the form of novel financial investment vehicles, are held by the wealthiest echelon of society, mostly in HICs (Chalabi, Citation2021; Gebeloff, Citation2021). Common ownership, recognised as a symptom of the increasing financialization of the global economy, is an important driver of publicly-listed corporations seeking to continuously pursue the maximisation of shareholder value over other economic values and uses (e.g. innovation, job creation) (Clarke, Citation2020; Froud et al., Citation2000).
Related to and compounding the distributive concerns of shareholder primacy, this paper shows that a decreasing proportion of income generated by these UCIs is being transferred via corporate income tax payments to governments, that, concurrently, are having to spend increasing amounts of public revenue on the negative health, social and ecological-related costs related to UCI operations and activities (Vital Strategies, Citation2021; World Bank, Citation2020b; World Health Organization, Citation2010). There are several potential reasons as to why corporate income tax obligations, as a percentage of pre-tax corporate income, are decreasing. Firstly, since 1980, statutory corporate tax rates have fallen in every single region of the world, a phenomenon in part shaped by the corporate capture of tax regimes and the ‘race to the bottom’ in statutory corporate tax rates set by governments to attract corporate location and investment (Farnsworth & Fooks, Citation2015). In 1980, the average corporate tax rate around the world, weighted by GDP, was 46.5%, whereas in 2020 this rate was 25.9% (Asen, Citation2020; OECD, Citation2020).
Secondly, global corporations have become increasingly savvy at structuring their organisations and activities to take advantage of widespread yet uneven financial deregulation across the world (Sikka & Willmott, Citation2010; Wiist, Citation2018). Some of the strategies that global tobacco corporations use to minimise their tax, many of which are permitted under current tax policy frameworks, are well described (Tax Justice Network, Citation2019; Tobacco Tactics from the University of Bath, Citation2021). These strategies, amongst others, include cross-border royalty payments and loans between subsidiaries in the same corporate group to take advantage of jurisdictions with lower tax rates and corporate friendly tax arrangements. Again, this calls into question the economic ‘value’ of these global corporations, especially for those countries exploited by current global tax systems – systems that costs LMICs many billions of dollars, every year, in lost government revenues (Jones, Citation2015). Furthermore, the legal boundaries of tax minimisation are sometimes pushed to extremes by global corporations. Many of the firms analysed in this paper have at some stage been subjected to court proceedings related to illegal tax evasion (Barusch, Citation2014; Ha, Citation2020; Ker, Citation2018; Maheshwari, Citation2013; McClure, Citation2020; Newton, Citation1992; Zakharova, Citation2020).
Although the relative flows of corporate income to governments are decreasing, evidence suggests that firms active in the four industries continue to receive a considerable amount of corporate welfare in the form of large tax incentives. The global value of fossil fuel subsidies in 2020, for instance, was estimated at US$5.9 trillion, representing 6.8% of global GDP (Parry et al., Citation2021). In certain contexts, the production of tobacco and commodity crops used as inputs for the manufacture of UPFs, such as corn and soy, have long been heavily subsidised (EPHA, Citation2014; EWG, Citation2021; McEldowney, Citation2020). It has also been highlighted that a number of governments, mostly in HICs, continue to disburse tax incentives of the magnitude of many billions of USD to global alcohol corporations seeking to expand their operations in LMICs (Vital Strategies, Citation2021). Such tax policy appears to be in direct conflict with public health interests given the direct health-harming impacts of the production and consumption of the respective unhealthy commodities, and also acts as an avenue by which global corporations in UCIs can grow and consolidate their power (Farnsworth & Fooks, Citation2015).
The drivers of wealth and income inequalities are complex, diverse, and systemic in nature (Chancel et al., Citation2021). As such, it is difficult to attribute particular inequality-related outcomes with specific casual factors. Nevertheless, when interpreted alongside existing evidence that demonstrates the inequality-driving role of corporate efforts to maximise shareholder value in the context of skewed distribution of consumption and corporate equity ownership (Clarke, Citation2020; Lazonick, Citation2008; Lazonick et al., Citation2020; Stiglitz, Citation2012), our findings suggest that is likely that the ways in which the four examined UCIs distribute wealth and income are contributing to, and in some cases perpetuating, existing wealth and income inequalities both within and between countries. These inequalities, which exacerbate and are exacerbated by the creation and maldistribution of harms, are important structural determinants of health and health equity (Commission on Social Determinants of Health, Citation2008; Ottersen et al., Citation2014). Wealth and income inequalities within societies is directly associated with a large range of adverse health outcomes – people with less wealth have less to spend on the necessities of living, and are also less likely to live in safer homes and neighbourhoods, find adequate time for physical activity, and are more likely to experience considerable stress (Braveman et al., Citation2011; Chokshi, Citation2018; Pickett & Wilkinson, Citation2015; Truesdale & Jencks, Citation2016). Wealth and income inequalities within societies also indirectly impacts health and health equity, such as by shaping culture, norms of behaviour, and social cohesion; decreasing civic engagement and generalised trust; and driving and reinforcing gender, racial, and intergenerational inequality (Bartels, Citation2008; Oxfam International, Citation2020; Pickett & Wilkinson, Citation2015; Truesdale & Jencks, Citation2016). In terms of wealth inequality between countries, the way in which many global corporations extract and distribute wealth likely deprives LMICs of much needed wealth and resources that could be used to fight poverty and pursue sustainable economic development (Stiglitz, Citation2017). Concerningly, global poverty reduction has slowed in recent years, and around half of the world’s population continue to live on less than US$5.50 a day (World Bank, Citation2020a).
There is substantial evidence highlighting the active role that corporations play in contributing to the abovementioned social and economic inequalities. Corporations active in UCIs, for instance, directly contribute to health inequalities by targeting disadvantaged social groups that tend to be more vulnerable to marketing and pricing tactics, and less able to exercise choice in what they can afford or access (Collin & Hill, Citation2015). With respect to inequalities between countries, corporations in UCIs play a role in actively shaping trade and investment policies to aggressively expand their markets (Hawkes, Citation2006; Jernigan & Babor, Citation2015; Shaffer et al., Citation2005). This includes exercising their power to obstruct regulation of their activities and products (Less et al., Citation2012; Milsom et al., Citation2020).
Although deep-rooted structural changes (including ideological changes) will likely be needed to comprehensively address the distributive injustice that manifests from the ‘double burden of maldistribution’, we argue the public health community could join forces with broader justice-orientated coalitions to advocate for feasible but important changes in the short-term. One such change could be to stop firms active in UCIs from being able to access government tax incentives, including reforming tax policy in many jurisdictions so that the marketing of unhealthy commodities would no longer be considered a tax-deductible business expense. By questioning the unfairness of government tax regimes collecting smaller percentages of the income of corporations that create considerable social, ecological and population health harms, (Duckett & Swerissen, Citation2016; World Bank, Citation2020b) the public health community could also lend its weight behind efforts to establish a global tax regime that would be fairer to all countries.
This paper has several strengths and limitations. A strength of this paper is that it involved the analysis of vast amounts of data covering many decades. A limitation of this paper is that it only focused on data from US-listed firms. However, given many large global firms are listed on US stock exchanges, it is likely that the analysis covered a considerable proportion of the relevant firms worldwide. Nevertheless, future work could explore data pertaining to firms listed on other stock exchanges. Finally, we acknowledge that this study used a broad-brush approach that serves as a point of departure rather than a finalised approach. In this respect, future work could examine other UCIs, as well as other mechanisms of corporate wealth and income maldistribution (e.g. wage dispersion, misuse of corporate welfare).
Supplemental Material
Download PDF (155.8 KB)Supplemental Material
Download PDF (169.1 KB)Acknowledgements
We would like to thank the anonymous reviewers for their very helpful comments.
Disclosure statement
No potential conflict of interest was reported by the author(s).
Supplementary Material:
Supplemental data for this article can be accessed here.
Additional information
Funding
References
- ADV Ratings. (2021). World’s Top Asset Management Firms. Retrieved 26 October 2021 from https://www.advratings.com/top-asset-management-firms
- Afshin, A., Sur, P. J., Fay, K. A., Cornaby, L., Ferrara, G., Salama, J. S., Mullany, E. C., Abate, K. H., Abbafati, C., Abebe, Z., Afarideh, M., Aggarwal, A., Agrawal, S., Akinyemiju, T., Alahdab, F., Bacha, U., Bachman, V. F., Badali, H., Badawi, A., Bensenor, I. M., & Murray, C. J. L., & GBD 2017 Diet Collaborators. (2019). Health effects of dietary risks in 195 countries, 1990–2017: A systematic analysis for the Global Burden of Disease Study 2017. The Lancet, 393(10184), 1958–1972. https://doi.org/10.1016/s0140-6736(19)30041-8
- Ali, A. (2020). The world’s 10 largest stock markets. Visual Capitalist. Retrieved 26 March 2021 from https://www.visualcapitalist.com/the-worlds-10-largest-stock-markets/
- Asen, E. (2020). Corporate tax rates around the world, 2020. Tax Foundation. Retrieved 30 March 2021 from https://taxfoundation.org/publications/corporate-tax-rates-around-the-world/#:~:text=In%201980%2C%20corporate%20tax%20rates,stands%20at%20about%2023%20percent
- Bartels, L. M. (2008). Unequal Democracy: The Political Economy of the New Gilded Age. Russell Sage Foundation and Princeton University Press.
- Barusch, R. (2014). Dealpolitik: Beer deal could change focus of inversion debate. The Wall Street Journal. Retrieved 13 October 2021 from https://www.wsj.com/articles/BL-MBB-27119
- Braveman, P., Egerter, S., & Barclay, C. (2011). Income, wealth and health. Exploring the Social Determinants of Health. Robert Wood Johnson Foundation.
- Bureau, V. D. (2021). Orbis Bureau Van Dijk. Retrieved 7 April 2021 from https://www.bvdinfo.com/en-gb/our-products/data/international/orbis
- Carlson, B. (2020). The rich own stocks, the middle class own homes. How betting it all on real estate is a wealth gap problem. Fortune Fortune Media. Retrieved 11 January 2021 from https://fortune.com/2020/02/05/stock-home-ownership-debt-wealth-gap/
- Chalabi, M. (2021). Who really owns the largest slice of wall street? Guardian News & Media. Retrieved 10 May 2021 from https://www.theguardian.com/business/2021/feb/16/who-really-owns-the-largest-slice-of-wall-street
- Chan, M. (2013). WHO director-general addresses health promotion conference. Opening address at the 8th global conference of health promotion. Finland. Retrieved 16 May 2019. https://www.who.int/dg/speeches/2013/health_promotion_20130610/en/
- Chancel, L., Piketty, T., Saez, E., & Zucman, G. (2021). World inequality report 2022. World Inequality Lab.
- Chokshi, D. (2018). Income, poverty, and health inequality. JAMA, 319(13), 1312–1313. https://doi.org/10.1001/jama.2018.2521
- Clarke, T., Jarvis, W., & Gholamshahi, S. (2019). The impact of corporate governance on compounding inequality: Maximising shareholder value and inflating executive pay. Critical Perspectives on Accounting, 63 (2019), 102049. https://doi.org/10.1016/j.cpa.2018.06.002
- Clarke, T. (2020). The contest on corporate purpose: Why Lynn Stout was right and milton friedman was wrong. Accounting, Economics, and Law: A Convivium, 10 (3), 20200145. https://doi.org/10.1515/ael-2020-0145
- Collin, J., & Hill, S. (2015). Industrial epidemics and inequalities: The commercial sector as a structural driver of inequalities in non-communicable diseases. In K. Smith, C. Bambra, & S. Hill (Eds.), Health inequalities: Critical perspectives. Oxford University Press.
- Commission on Social Determinants of Health. (2008). Closing the gap in a generation: Health equity though action on the social determinants of health. Final report of the commission on the social determinants of health. World Health Organization.
- Duckett, S., & Swerissen, H. (2016). A sugary drinks tax: Recovering the community costs of obesity. Grattan Institute.
- EPHA. (2014). Hypocritical spending: European Parliament again votes to continue subsidies for tobacco growing. European Public Health Alliance. Retrieved 7 December 2021. https://epha.org/hypocritical-spending-european-parliament-again-votes-to-continue-subsidies-for-tobacco-growing/
- Euromonitor International. (2021). About Us. Retrieved 1 April 2021 from https://www.euromonitor.com/about-us-page
- EWG. (2021). Farm subsidy database. EWG. Retrieved 7 December 2021 from https://farm.ewg.org/index.php
- Farnsworth, K., & Fooks, G. (2015). Corporate taxation, corporate power, and corporate harm. The Howard Journal of Criminal Justice, 54(1), 25–41. https://doi.org/10.1111/hojo.12112
- Freudenberg, N., & Galea, S. (2008). The impact of corporate practices on health: Implications for health policy. Journal of Public Health Policy, 29(1), 86–104. https://doi.org/10.1057/palgrave.jphp.3200158
- Froud, J., Haslam, C., Johal, S., & Williams, K. (2000). Shareholder value and financialization: Consultancy promises, management moves. Economy and Society, 29(1), 80–110. https://doi.org/10.1080/030851400360578
- Fuchs, D., & Glaab, K. (2010). Material power or normative conflict: Determinants of the interaction between global and local agrifood governance. Universität Münster.
- GBD 2017 Diet Collaborators. (2019). Health effects of dietary risks in 195 countries, 1990–2017: a systematic analysis for the Global Burden of Disease Study 2017. The Lancet, 393(10184), 1958–1972. doi:10.1016/s0140-6736(19)30041-8
- Gebeloff, R. (2021). Who owns stocks? Explaining the rise in inequality during the pandemic. The New York Times. Retrieved 19 February 2021 from https://www.nytimes.com/2021/01/26/upshot/stocks-pandemic-inequality.html
- Ha, N. (2020). Heinken Vietnam pays $39.7 mln in back taxes, fines. VN Express. Retrieved 30 March 2021 from https://e.vnexpress.net/news/business/companies/heineken-Vietnam-pays-39-7-mln-in-back-taxes-fines-4041449.html#:~:text=Heineken%20Vietnam%20Brewery%20has%20paid,deal%20valued%20at%20over%20VND4
- Hager, S. B., & Baines, J. (2020). The tax advantage of big business: how the structure of corporate taxation fuels concentration and inequality. Politics & Society, 48(2), 275–305. https://doi.org/10.1177/0032329220911778
- Hawkes, C. (2006). Uneven dietary development: Linking the policies and processes of globalization with the nutrition transition, obesity and diet-related chronic diseases. Globalization and Health, 2(1), 4. https://doi.org/10.1186/1744-8603-2-4
- Ireland, P. (2005). Shareholder primacy and the distribution of wealth. Modern Law Review, 68(1), 49–81. https://doi.org/10.1111/j.1468-2230.2005.00528.x
- Jernigan, D. H., & Babor, T. F. (2015). The concentration of the global alcohol industry and its penetration in the African region. Addiction, 110(4), 551–560. https://doi.org/10.1111/add.12468
- Jones, S. (2015). Tax dodging by big firms ‘robs poor countries of billions of dollars a year’. The Guardian News & Media. Retrieved 10 May 2021 from https://www.theguardian.com/global-development/2015/jun/02/tax-dodging-big-companies-costs-poor-countries-billions-dollars
- Ker, P. (2018). ATO hits Exxon Mobil with tax claim over loans. The Australian Financial Review. Retrieved 30 March 2021 from https://www.afr.com/companies/energy/ato-hits-exxonmobil-with-tax-claim-over-loans-20180426-h0za2v
- Lazonick, W., Sakinç, M., & Hopkins, M. (2020). Why stock buybacks are dangerous for the economy. Harvard Business Publishing. Retrieved 7 January 2021 from https://hbr.org/2020/01/why-stock-buybacks-are-dangerous-for-the-economy#:~:text=When%20companies%20do%20these%20buybacks,2017%2C%20according%20to%20JPMorgan%20Chase
- Lazonick, W. (2008). The quest for shareholder value: Stock repurchases in the US economy. Louvain Economic Review, 74 (4) , 479–540 https://www.jstor.org/stable/40724543.
- Less, S., Ling, P., & Glantz, S. (2012). The vector of the tobacco epidemic: Tobacco industry practices in low and middle-income countries. Cancer Causes and Control, 23(S1), 117–129. https://doi.org/10.1007/s10552-012-9914-0
- Maheshwari, A. 2013). Shell India moves dispute resolution panel against Rs 15,000 crore IT notice. NDTV Convergence Ltd. Retrieved 13 October 2021. https://www.ndtv.com/business/shell-India-moves-dispute-resolution-panel-against-rs-15-000-crore-it-notice-321394
- McClure, H. 2020). US IRS prevails in Coca-Cola transfer pricing dispute over intercompany royalties. Multinational Group Tax & Transfer Pricing News. Retrieved 12 January 2021. https://mnetax.com/us-irs-prevails-in-coca-cola-transfer-pricing-dispute-over-intercompany-royalties-41461
- McEldowney, J. (2020). EU agricultural policy and health: Some historical and contemporary issues European Parliamentary Research Service . ( PE 659.302).
- Mialon, M., Swinburn, B., & Sacks, G. (2015). A proposed approach to systematically identify and monitor the corporate political activity of the food industry with respect to public health using publicly available information. Obesity Reviews: An Official Journal of the International Association for the Study of Obesity, 16(7), 519–530. https://doi.org/10.1111/obr.12289
- Millar, J. (2013). The corporate determinants of health: How big business affects our health, and the need for government action! The Canadian Journal of Public Health, 104(4), 327–329. https://doi.org/10.17269/cjph.104.3849
- Milsom, P., Smith, R., Baker, P., & Walls, H. (2020). Corporate power and the international trade regime preventing progressive policy action on non-communicable diseases: A realist review. Health Policy and Planning 36 (5) 820 doi:10.1093/heapol/czab013 3 June 2021 .
- Moodie, R., Stuckler, D., Monteiro, C., Sheron, N., Neal, B., Thamarangsi, T., Lincoln, P., & Casswell, S. (2013). Profits and pandemics: Prevention of harmful effects of tobacco, alcohol, and ultra-processed food and drink industries. The Lancet, 381(9867), 670–679. https://doi.org/10.1016/S0140-6736(12)62089-3
- Newton, R. (1992). Nestle fights off $8.8bn US “transfer pricing” dispute. Accountancy Age.
- OECD. (2017). Common ownership by institutional investors and its impact on competition. (DAF/COMP(2017)10). Organisation for Economic Co-operation and Development.
- OECD. (2020). Corporate tax statistics (Second ed.). Organisation for Economic Co-operation and Development.
- Ottersen, O. P., Dasgupta, J., Blouin, C., Buss, P., Chongsuvivatwong, V., Frenk, J., Fukuda-Parr, S., Gawanas, B. P., Giacaman, R., Gyapong, J., Leaning, J., Marmot, M., McNeill, D., Mongella, G. I., Moyo, N., Møgedal, S., Ntsaluba, A., Ooms, G., Bjertness, E., Lie, A. L., … Scheel, I. B. (2014). The political origins of health inequity: Prospects for change. The Lancet, 383(9917), 630–667. https://doi.org/10.1016/S0140-6736(13)62407-1
- Oxfam International. (2020). Time to care: Unpaid and underpaid work and the global inequality crisis.
- Parry, I., Black, S., & Vermon, N. (2021). Still not getting energy prices right: A global country update of fossil fuel subsidies. IMF Working Paper, (WP/21/236).
- Pickett, K. E., & Wilkinson, R. G. (2015). Income inequality and health: A causal review. Soc Sci Med, 128, 316–326 March. https://doi.org/10.1016/j.socscimed.2014.12.031 Epub 2014 Dec 30
- Refinitiv. (2021a). Refinitiv Eikon. Retrieved 7 April 2021 from https://www.refinitiv.com/en/products/eikon-trading-software
- Refinitiv. (2021b). S&P compustat fundamentals. Retrieved 7 April 2021 from https://www.refinitiv.com/en/financial-data/company-data/fundamentals-data/standardized-fundamentals/sp-compustat-database
- Savell, E., Fooks, G., & Gilmore, A. B. (2016). How does the alcohol industry attempt to influence marketing regulations? A systematic review. Addiction, 111(1), 18–32. https://doi.org/10.1111/add.13048
- Shaffer, E. R., Brenner, J. E., & Houston, T. P. (2005). International trade agreements: A threat to tobacco control policy. Tobacco Control, 14(Suppl 2), ii19–25. https://doi.org/10.1136/tc.2004.007930
- Sikka, P., & Willmott, H. (2010). The dark side of transfer pricing: Its role in tax avoidance and wealth relativeness 21 (4) 342–356 April .
- Statista Research Department. (2021). Countries with largest stock markets globally 2021. Statista. Retrieved 26 March 2021 from https://www.statista.com/statistics/710680/global-stock-markets-by-country/
- Stiglitz, J. (2012). The price of inequality: How today’s divided society endangers our future. W.W. Norton & Co.
- Stiglitz, J. (2017) Tembinkosi, Bonakele, Eleanor, Fox, and Liberty, Mncube(eds.). Competition Policy for the New Era: Insights from the BRICS Countries. Oxford: Oxford University Press. 4–21 November https://doi.org/10.7916/d8-ztw4-qf76 (Lecture presented to the 4th BRICS International Competition Conference in Durban, November 2015.) .
- Swinburn, B. A., Kraak, V. I., Allender, S., Atkins, V. J., Baker, P. I., Bogard, J. R., Brinsden, H., Calvillo, A., De Schutter, O., Devarajan, R., Ezzati, M., Friel, S., Goenka, S., Hammond, R. A., Hastings, G., Hawkes, C., Herrero, M., Hovmand, P. S., Howden, M., Jaacks, L. M., Dietz, W. H. (2019). The global syndemic of obesity, undernutrition, and climate change: The lancet commission report. The Lancet, 393(10173), 791–846. https://doi.org/10.1016/s0140-6736(18)32822-8
- Tax Justice Network. (2019). Ashes to ashes: How British American Tobacco avoids taxes in low and middle income countries. Tax Justice Network.
- Tobacco Tactics from the University of Bath. (2021). British American Tobacco. Retrieved 30 March 2021 from https://tobaccotactics.org/wiki/british-american-tobacco/
- Truesdale, B. C., & Jencks, C. (2016). The health effects of income inequality: Averages and disparities. Annual Review of Public Health, 37(1), 413–430. https://doi.org/10.1146/annurev-publhealth-032315-021606
- Ulucanlar, S., Fooks, G. J., & Gilmore, A. B. (2016). The policy dystopia model: An interpretive analysis of tobacco industry political activity. PLoS Medicine, 13(9), e1002125. https://doi.org/10.1371/journal.pmed.1002125
- UN Interagency Task Force on NCDs. (2019). Responding to the challenge of non-communicable diseases. United Nations Agency Briefs.
- Vital Strategies. (2021). The sobering truth: Incentivizing alcohol death and disability, an NCD policy report. Vital Strategies.
- West, R., & Marteau, T. (2013). Commentary on Casswell (2013): The commercial determinants of health. Addiction, 108(4), 686–687. https://doi.org/10.1111/add.12118
- Wiist, W. H. (2018). public health and corporate avoidance of U.S. Federal income tax. World Medical & Health Policy, 10(3), 272–300. https://doi.org/10.1002/wmh3.274
- Wood, B., Baker, P., Scrinis, G., McCoy, D., Williams, O., & Sacks, G. (2021). Maximising the wealth of few at the expense of the health of many: A public health analysis of market power and corporate wealth and income distribution in the global soft drink market. Globalization and Health, 17(1), 1. https://doi.org/10.1186/s12992-021-00781-6
- Wood, B., Williams, O., Nagarajan, V., & Sacks, G. (2021). Market strategies used by processed manufacturers to increase and consolidate their power: A systematic review and document analysis. Globalization and Health, 17(1), 17. https://doi.org/10.1186/s12992-021-00667-7
- World Bank. (2020a). Reversal of fortune: Poverty and shared prosperity.
- World Bank. (2020b). Taxes on sugar-sweetened beverages: International evidence and experiences. In Health, nutrition, and population.
- World Bank. (2020c). World bank country and lending groups. Retrieved 30 September 2021 from https://datahelpdesk.worldbank.org/knowledgebase/articles/906519-world-bank-country-and-lending-groups
- World Bank. (2021). Inflation, consumer prices (annual %) - United States.https://data.worldbank.org/indicator/FP.CPI.TOTL.ZG?locations=US
- World Health Organization. (2010). Taxation and the economics of tobacco control (Gender, Women, and the Tobacco Epidemic (pp. 207–229). WHO.
- World Health Organization. (2018). Alcohol. Retrieved 29 March 2021 from https://www.who.int/news-room/fact-sheets/detail/alcohol
- World Health Organization. (2020). Tobacco. Retrieved 29 March 2021 from https://www.who.int/news-room/fact-sheets/detail/tobacco
- World Health Organization. (2021). Air pollution. Retrieved 29 March 2021 from https://www.who.int/health-topics/air-pollution#tab=tab_1
- Zakharova, A. (2020). State tax service fines Philip Morris Ukraine for UAH 123.4 mIllion according to results of check of transfer pricing, company sued. Ukrainian News Agency.