
ABSTRACT
Phosphorus (P) is a building block for life in which the human body requires 0.55 g of per day. In some cases, this requirement is exceeded by 2 g per day, with P additives contributing to half of this exceedance. The use of P has become prominent as demand for processed convenience foods has increased. P can cause significant eutrophication once discharged to the environment. As of October 2019, 55% of assessed rivers and 73% of assessed lakes in England failed the current water quality standards. A survey was conducted to calculate the average P consumption of individuals who identify as meat eaters, flexitarians, vegetarians and vegans based on stated eating habits and reported P levels in foods, revealing an estimated P consumption of 1715, 1664, 1244, 1125 mg P/day respectively. It was estimated that current diets contribute 45% of the P load to UK wastewater treatment works (WwTW). If the UK population were to all convert to veganism this would decrease by 54% reducing the load to WwTW by over 15,000 tonnes of P per year, or 9000 tonnes of P per year if there was a move towards a 50% vegetarian or vegan population. Finally, the population needs to be better informed on what is in their food and the associated environmental impacts.
GRAPHICAL ABSTRACT
1. Introduction
Phosphorus (P) is a building block for life, being essential in the structure of RNA and DNA, making it a necessary component of any diet. The human body requires approximately 0.55 g of P/capita/day to carry out essential functions (Table S1 in the Electronic Supporting Information), however this intake is often exceeded [Citation1], with an estimated 1 g P/capita/day contributed by food additives alone, up 50% from the estimated 0.5 g in 1990 [Citation2]. Food containing additives also comprises 70% more P than those without additives [Citation3]. Diet therefore contributes significantly to the estimated total of 2.3 g P/capita/day (including other sources such as dosed tapwater, detergents, food scraps etc) discharged to wastewater treatment works (WwTW) [Citation4].
Phosphorus is a known concern regarding eutrophication across the globe [Citation5]. Water bodies within the UK are governed by the Water Framework Directive (WFD, Directive 2000/60/EC) Urban Wastewater Treatment Directive (UWWTD, 91/27/EEC) and the Habitats Directive (Directives 92/43/EEC). The WFD has the aim of improving the chemical and ecological quality of the UK’s water bodies. Eutrophication associated with P fluxes to surface waters has been recognised as a significant concern by the Environment Agency [Citation6]. 5164 km of rivers, 96 lakes and reservoirs in England are formally recognised as being affected by eutrophication caused by wastewater effluents and diffuse agricultural runoff [Citation7,Citation8]. Phosphorus is present in many different forms in sewage and can become bioavailable during wastewater treatment prior to discharge to receiving waters [Citation9,Citation10]. Even though chemical dosing for P reduction is undertaken at around 700 WwTW in the UK (approximately 10% of all WwTW), responsible for the processing wastewater for around 24 million people, there is still a significant P discharge from WwTW effluent (typically 1–2 mg-P/l, although stricter permits as low as 0.1 mg-P/l are being introduced). This makes WwTW effluent along with agricultural runoff the most significant sources of P to the aquatic environment [Citation11].
The process of managing and reducing inputs of P to waterbodies requires modelling to predict the efficacy of any mitigation methodologies. In order to complete the modelling accurately it is necessary to fully understand the sources of P to WwTW. With phosphorus in foodstuffs a key domestic source and significant contributor to the overall load to sewer, it is timely to assess the contribution of diet to P loads entering WwTW. The P consumed is found in 3 dietary sources: foods that contain P naturally (organic), food processed with P (inorganic) and dietary supplements containing P [Citation12]. Around 60–70% of consumed P is absorbed in adults to maintain a healthy body [Citation13]. Organic P found in meat is relatively easily digested by the gastrointestinal tract and around 40–60% is passed in the urine, whilst P found in plants, in the form of phytic acid (Figure S1), forms complex structures, which cannot be hydrolysed by the majority of organisms. Less than 50% of the total plant P is absorbed through digestion and is excreted in faeces rather than urine [Citation14,Citation15]. Phosphorus used in additives, including that in cola-based drinks, is almost completely absorbed and excreted in urine [Citation3,Citation12].
Around 60% of P consumption in a normal diet can be attributed to milk, meat, fish and eggs; because sources of protein are typically sources of P (Figure S2) [Citation16,Citation17]. A total of 20% of P can be found in cereals and legumes, less than 10% from fruits and 10% from P additives. Other constituents of diet such as tea, coffee, oils and spices only supply minimal amount of P [Citation12]. Multivitamins and supplements also present a significant contribution to P consumption levels [Citation18].
A key factor relating to the ingestion and excretion of phosphorus is the amount of P in protein and how much protein is consumed in different diets. The assumptions associated with these variables has a major bearing on the estimates of P loads to WwTW. On a weight by weight basis, it has been reported that plant protein contains approximately twice as much P than animal protein [Citation19]. It has been suggested that a plant based diet can increase the quantity of P excreted by up to 8% based on an Australian study, above current levels of P ingestion of 1.8 g/capita/day [Citation20]. Other reported P excretion rates range from 0.5 to 2.0 g/capita/day [Citation21] and more recently a range of 1.03–1.56 g/capita/day [Citation22].
A recent UK study reported current excretion rates of 1.4 g/capita/day [Citation23] and based on simply replacing animal based proteins with plant based ones suggested excretion rates could increase with a shift towards vegetarian and/or vegan diets. The study, however, based the P budget calculations on the substitution of all non-plant based protein with protein from legumes and beans. However, there is a flaw in this assumption because although there is more P in plant proteins on a gram per gram basis; vegans and vegetarians do not eat the same quantity of protein as omnivores. Typically meat eater consume 100 g of protein a day compared with only around 50 g per day for vegans based on available reported data [Citation24–26]. Consequently, in order to derive accurate estimates of P loads to WwTW, there are significant benefits in undertaking more empirical diet-based assessment of P ingestion and excretion and calculating P loads based on reported food consumed.
There is also a significant difference between the P content of processed foods compared with more natural diets. Phosphate salt additives are for flavour appeal, freshness and safety, where they act as an emulsion stabiliser to maintain the ‘juiciness’ of the product by retention of moisture and avoidance of oxidation of metals within the meat (Table S2). The use of P has become more prominent as demand for processed convenience foods has increased. Foods that are processed conventionally contain more P. The same food stuffs can contain significantly more P if processed (Table S3), With processed ham containing 65% more P mg/ kg than carved ham [Citation27]. Leon et al. [Citation28] found that 44% of best-selling grocery items in the US contained P additives (Table S4) and that these foodstuffs were typically cheaper and as such it is expected that lower income households (often less well educated) consume more P than the average. Reported data supports these assumptions [Citation29] where 8 healthy student’s urinary P levels were tested after 1 month of low P consumption (0.98 g P/day) followed by a month of high P (2.1 g P/day) diets. The difference in the P levels were made by food additives in meats, cheese, breads, soft drinks, pies and some other foods. The urinary P was 0.43 g/ day under the low P diet and 1.01 g/ day for the high P diet. It was estimated that 51% of the P was absorbed from the gastrointestinal tract.
The number of vegans in the UK quadrupled between 2014 and 2019, from 150,000 to 600,000 [Citation30]. The vegetarian population of the UK is also significant with 1.2 million people following a vegetarian diet (The vegetarian Society, 2020). Studies have suggested that vegetarian diets contain significantly less P than omnivorous diets [Citation23] (Table S5). Experiments where groups of people have consumed the same quantity of P but in differing forms have shown that consuming a vegetarian diet over the week resulted in significantly lower serum P levels compared with the individuals who consumed the meat-based diet ([Citation31] – Table S6). This demonstrates the higher bioavailability of P found in meat sources, which may also have implications during the wastewater treatment process via its distribution between the effluent and sludge phases, and so has commensurate impacts for the environment.
A more recent phenomena, at least in the UK, is the increase in the takeaway food market, which has continuously grown since 2009 with an increase of 3.5 billion GBP 2009–2020 to 10 billion GBP in 2017 [Citation32]. The market is utilised predominantly by young people driven by technological advances in online food ordering [Citation33]. The COVID-19 pandemic has only served to increase the demand in takeaway food by up to 24% in people of the age 55 and over for example [Citation34]. Diet is not the only source of P to WwTW, particularly in the UK. Other sources to WwTW include tap water dosing where typically between 1 and 2 mg-TP/l as orthophosphoric acid or sodium phosphate is added to meet WHO drinking water standards for lead (10 μg-Pb/l). It has been estimated there are 2709 tonnes of P discharges to UK sewers annually from this source [Citation4] which is a common practise globally [Citation35]. When urine and faeces are added with food additives, 69% of total load can be apportioned to dietary factors [Citation4]. However, the sources and their magnitude do vary considerable over time reflecting changes in policy. For example other sources such as detergents contribute to the load, although P in phosphates (now replaced at least in part by phosphonates) was limited to less than 0.3g-P per standard dosage from laundry detergents in the UK in 2013 and in automatic dishwasher products in 2017.
This study for the first time quantifies the significance of P in additives and different forms of diet based on reported dietary intake rather than assumed simple replacement of protein sources of P which may over estimate actual P loads to WwTW. This approach allows the extent to which P consumption within diets, changing patterns of food consumption and subsequent excretion contributes to the P load to WwTW with commensurate impacts on discharges to surface waters.
2. Methodology
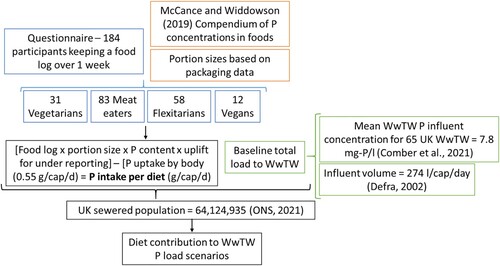
This study brought together datasets generated via an extensive diet questionnaire, a database for P in foods [Citation36] combined with reported data for P loads to UK WwTW ().
Figure 1. Schematic of the methodology used to calculate loads of P from diet and its contribution to WwTW influent loads.
2.1. Questionnaire production and distribution
A Google Surveys questionnaire was designed to gather basic demographic data including the 1st two letters of postcode, qualifications, occupation, gender, diet choice, as well as the types of food consumed for breakfast, lunch and dinner, including food journals monitoring eating habits over the course of one week (providing brands and amounts) (see Electronic Supporting Information, S1). Ethical considerations were made before questionnaires were distributed to participants, including the use of consent form detailing storage and use of data. Ethical approval was sought from the University of Plymouth Faculty of Science and Engineering, Research Ethics Committee, and was granted on the 24th April 2020, via a pdf letter signed by the secretary to the Faculty Research Ethics Committee. The questionnaire was shared on Social Media platforms including Linked In to draw as wide and representative demographic as possible. The questionnaire returned 273 responses, however only 184 provided sufficient detail (named brands and quantities consumed) for which a food diary could be constructed to generate P quantities consumed on a daily basis ().
2.2. P in foods
All data for concentrations of P in food were abstracted from McCance and Widdowson [Citation36]. The compendium provides a variety of composition data including P for over 1,200 foods consumed in the UK. All methods, by all laboratories used to determine concentrations were UKAS accredited [Citation37]. This dataset is the basis for the daily P intakes calculated in conjunction with the questionnaires and food diaries. The reported data doesn’t take into consideration the bioavailability of P in each item, only listing the P concentration in the food and not how it would be absorbed, utilised and excreted.
2.3. Questionnaire analysis
The purpose of the questionnaire was to generate some representative P intake loadings for a representative number of people across a wide demographic. The resultant data could then be used in combination with concentrations in food and drink to generate a base load of P to WwTW as well as provide predictions relating to possible changes in eating habits. In total 184 participants responded () (83 meat eaters – 45%, 58 flexitarians – 32%, 31 vegetarians – 17% and 12 vegans – 6.5%), roughly mirroring the wider UK population’s preferences (Meat eaters 51%; flexitarian 46%; vegetarian 2.2% and vegan 1.1%) (Table 3). Vegetarians and vegans were slightly over represented in this survey, but given the objective was to quantify P consumption across different dietary groups, more data for non meat eaters was considered advantageous in terms of accurately scaling up P loads to WwTW. Females also dominated the survey results () which also reflected to a degree, the dominance of female vegetarians and vegans [Citation38]. However, it was considered that male and female diets are not significantly different in overall consumption composition (with respect to types of food consumed) and so there was not any bias anticipated when P uptake and excretion was scaled up to the wider population using average portion sizes. Approximately 35% of UK adults have a degree or higher, and so the questionnaire respondents in this study tended towards having a higher level of education. However, sufficient representation was available across all education classes to ensure at least 20 datasets for diets, with which to calculate P loads consumed and excreted.
Table 1. Demographic breakdown of questionnaire participants.
Individuals provided food diaries over 1 week for all food consumed which could be compared with demographic data on age, gender, diet type and education. The four dietary classification were used to quantify P load from WwTW’s these can be defined as follows:
Meat eater: Having no awareness of meat consumption and eating meat accordingly.
Flexitarian: Having an awareness of how much meat is consumed and making choices to avoid it at times.
Vegetarian: only consuming meat free products but still consuming animal products.
Vegan: not consuming any form of animal product.
For every participant and every type of food consumed, recommended serving sizes taken from packaging were used unless otherwise stated by the participant. Totals were compiled and used to assess total loads of P to WwTW, calculated using the average P consumption for each dietary classification determined through the questionnaire responses, as well as the proportion of individuals in each classification for each scenario ().
Under reporting of food consumption is widely recognised in dietary surveys undertaken globally. This was been taken into account when calculating the P consumption. Participants often change their eating behaviours or omit items [Citation39]. The ‘double labelled water’ (DLW) technique is widely accepted as the most accurate way to estimate food consumption. The NDNS report of 2016 aimed to ascertain the difference between actual calorie consumption and reported calorie consumption. Estimates taken from self-reporting of energy intake (SREI) were found to be, on average, 32% lower than DLW measures of energy expenditure (EE). There was no difference between males (mean = 31%, standard deviation = 16%) and females (mean = 33%, standard deviation = 17%). Although it is recognised that calorie intake and P intake are not directly correlated as high calorie foods are not always high in P, an increase in calorie consumption in the majority of cases will result in an increase in P consumption. Owing to this issue, the values produced for daily P consumption reported for this study were multiplied by 32% to compensate for under reporting in the questionnaires and food diaries.
To calculate the baseline load contribution of P in WwTW influent, the percentage of the population in each dietary classification needed to be determined. This was achieved using data on current dietary choices [Citation38] who reported 1.1% vegan, 2.2% vegetarian, 46% flexitarian and 51% meat eater (see below).
2.4. WwTW influent concentrations
The Chemical investigation programme (CIP) in the UK was driven by the requirements of the WFD [Citation40]. The programme was designed to inform on the sources, removal and discharges of chemicals including P to the aquatic environment. Data was used to calculate loads of P to WwTW using flow and P influent (crude sewage) concentration from 65 WwTW [Citation40]. Samples were collected on up to 28 separate occasions across a one year period. The samples were collected in stainless steel samplers, stored in glass containers and transported at 4° C to the analytical laboratories. Analytical work was commissioned from contracted laboratories, who used their own in-house analytical methodologies, which were not standardised but had to meet a minimum and exacting performance criteria. Samples were determined using Inductively Coupled Plasma – Mass Spectrometry. To ensure analytical quality, the laboratories had to meet specific criteria. These included ISO17025 accreditation, the requirement to undertake tests of analytical performance to demonstrate that they met the stated programme requirements for limit of detection (LOD), precision and recovery in relevant sample matrices at relevant concentrations that is, proof of performance was required, rather that methods being stipulated. Further details are available elsewhere [Citation41].
3. Results and discussion
3.1. Questionnaire survey results
Combining the questionnaire data with concentrations of P in food stuffs and recommended portion sizes (allowing for under reporting) provided a mean total load of P consumed per day for each type of diet.
(Table S7 and S8) shows that individuals who eat less meat/animal products consume (and therefore will ultimately excrete) less P. Statistically significant differences (95% confidence level) were apparent between vegetarian and vegan versus meat and flexitarian diets (P < 0.05), although there were no differences between vegan and vegetarian P consumption. This difference is contrary to the data reported by Forber et al. [Citation23] who suggested vegan and vegetarian diets could result in greater P consumption, owing to the way in which they substituted protein consumption between meat eaters and other diets purely on a like for like basis. The fact that bring that there is almost twice the P content in plant-based proteins biased the estimate for P excretion compared with meat eaters. However, the data presented here, supported by statistics that show that vegans, in particular, tend to consume only half the protein of meat eaters [Citation24–26] meaning vegans excrete reduced P loads and in a less bioavailable form than meat eaters.
Figure 2. Comparison of total P consumption vs diet from the questionnaire data (brackets denote 95% confidence intervals). No of individuals responding to the questionnaire were 83, 58, 31, 12 for meat eaters, flexitarians, vegetarians and vegans respectively.
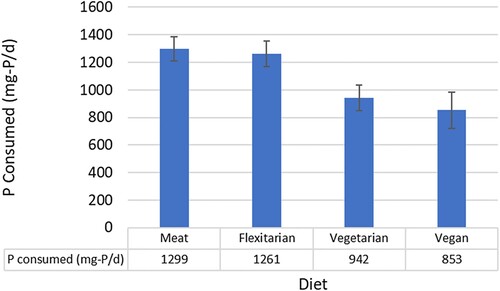
The average age of vegans was the lowest in the survey (although not statistically significant at 95% confidence) reflecting reported data for the UK and may reflect both education and the influence of social media [Citation42,Citation43].
3.3. Calculated load of P to WwTW under different diet scenarios
Mean influent concentrations for P were available for a total of 65 WwTW influent crude wastewater from across England, Scotland and Wales [Citation44]. The 65 WwTW serve populations from 190 to 1,500,000, with a mean of 107,977 which was considered an appropriate representation of wastewater treatment in the UK. Concentrations of total P in the influent wastewater ranged from 2 to 16 mg/l with a mean of 8.0 mg/l (95% confidence interval of 0.7 mg/l) (A) were typical of previously reported data [Citation4,Citation45]. To scale up predicted P loads to the UK as a whole, a per capita volume of water use per day was generated based on dividing the consented flows from WwTW by the population served for 5771 WwTW across England, Wales and Scotland and taking the median value (274 l/cap/day). This was combined with population data using the sewerage network (96% – [Citation11]) and the population of the UK (66,796,807 – [Citation39]) generating a sewered population of 64,124,935 people and a total UK volume to WwTW of 17.5 bn litres/day. From this data a baseline current load of P to UK WwTW could be generated by multiplying the volume by the calculated mean WwTW influent concentration of 8 mg-P/l (A). Using this approach provided a total influent load of 51,100 tonnes of P per annum, which was slightly greater than the 45,000 tonnes per annum reported previously [Citation4], mostly reflecting the increasing population in the UK, as the mean influent concentration of total P was the same (8 mg/l). With a total load to WwTW calculated it was possible to determine the contribution from diet for a number of scenarios ().
Figure 3. Histograms of the 65 WwTW for which P data were available (mean of 28 samples) for (A) distribution of influent P concentrations (B) % contribution of baseline diet to the total influent load to WwTW.
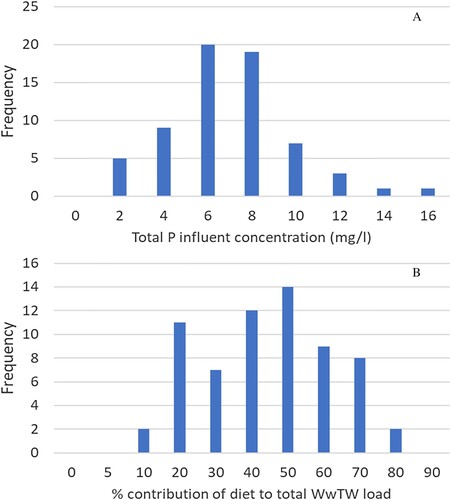
Table 2. Percentage of the total population categorised into the dietary classifications and the consequential contribution of diet to P loads in WwTW.
Baseline diet P contributions to WwTW loads were calculated by multiplying the per capita excretion of P of 1.13 g-P/capita/d by the population served by each individual WwTW. The 1.13 g-P/capita/d load from diet was based on a combination of the mean P consumed per day for each diet group (from the questionnaire survey) taking account of the current breakdown of % of population meat eaters, flexitarian, vegetarian and vegan ([Citation38]; Table 3). Consequently, the contribution of diet to the influent P load could be calculated for the 65 WwTW for which influent total P concentrations were available. The load that diet contributed showed a broad spread of values with a mean of 44%, median of 45% and standard deviation of 21% (Figure 3B). It could therefore be concluded that these influent concentrations and flows could be used to derive a robust influent P load with which to compare dietary loads, scaled up to the whole of the UK.
Dietary contributions (meat eating, flexitarian, vegetarian and vegan diets) to the loads of P to UK WwTW () were calculated based on the results of the survey data for P consumption with an additional 32% contribution added to account for underreporting of food consumption in the questionnaires conducted within this study. Then 550 mg/d of P was deducted to allow for P utilised by the human body for essential functions (Table S7). The baseline per capita P consumption loads were in line with those previously reported [Citation20–22] with vegan consumption of P being 34% lower than meat eaters (). Allowing for the daily requirement for P, meant the reduction in excreted P was predicted to half for vegans compared with meat eaters.
Table 3. Percentage of the total population categorised into the dietary classifications and the consequential contribution of diet to P loads in WwTWTable Footnote1.
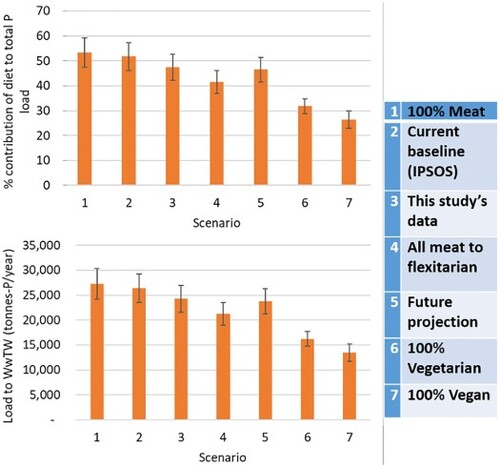
Based on the available data, it was possible to run a number of scenarios regarding diet and impacts on loads to WwTW. For this study, seven scenarios were explored ( and ):
Scenario 1 – Worst case of 100% of the population being meat eaters
Scenario 2 – Loads based on diet data generated from IPSOS data (considered the most accurate current situation)
Scenario 3 – Loads based on diet data generated from this study’s questionnaire
Scenario 4 – Loads based on a best estimate of future eating habits
Scenario 5 – Loads based on a switch from meat to flexitarian diet
Scenario 6 – Loads based on a 100% switch to vegetarian diet
Scenario 6 – Best case of 100% of the population switching to veganism
Figure 4. Predicted dietary contribution of P loads to WwTW (A) and overall loads of P to WwTW from diet (B) (error bars denote 95% confidence intervals).
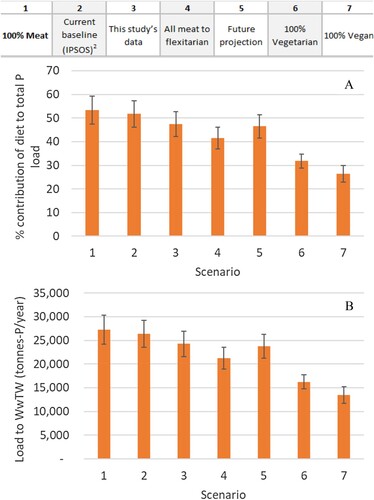
The current ‘baseline’ contribution of P from food was therefore calculated to be in the region of 27,000 tonnes per annum (B), amounting to 53% of the total P load; the proportion from food increasing over the past few years owing to the removal of phosphates from household detergents. The loads derived from the questionnaire undertaken for this study, align well with the national survey, generating an estimated 24,000 tonnes per annum, slightly lower than the calculated baseline, reflecting the slightly higher proportion of vegetarians and vegans in the present survey used in the calculations. The questionnaire results showed a shift towards consuming less meat, this may be due to the demographic that filled out the questionnaire as well as the IPSOS Mori survey being conducted in 2016, and the number of vegans quadrupling between 2014 and 2019 [Citation30]. Shifting ideals and heightened awareness of the environmental impacts of personal consumption patterns are likely to be the cause of this [Citation46].
The estimates show that the current situation is close to the worst case owing to the limited difference between a flexitarian and all meat eating diet. The difference between a full meat or flexitarianism diet only has a 5% impact on loads equating to 2,690 t per annum of P. However, a switch to vegetarianism would reduce loads to WwTW by 8000 tonnes of P per annum (16% reduction) and in the unlikely event of the whole population switching to a vegan.
Diet, the load of P to WwTW would drop by 25%, equating to 13,000 tonnes of P per annum. A more realistic future scenario over the next 20 years derives a reduction from the current predicted load of 10% based on a drift towards vegetarianism and veganism; which still suggests a significant 5000 tonnes of P per annum reduction in loads to WwTW ().
3.4. Demographic data and impacts on P intake and excretion
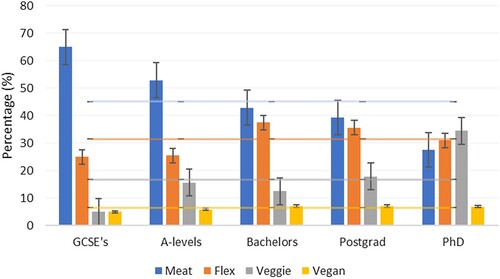
shows the ratio of educational level between the dietary classifications. The solid horizontal lines represent the national percentage of each type of diet [Citation38] which are compared with data from the questionnaire. It can be seen that there is a higher ratio of meat eaters with only a secondary school level of qualifications (GCSEs) compared with those with A level, degree or post graduate degree qualifications as well. Conversely, there is an increasing trend in flexitarians and vegetarians with level of qualification. A growing trend towards higher education supported by the increasing number of vegetarians and vegans, therefore suggests that in the future, phosphorus loading to WwTW will reduce from domestic sources, owing to their a lower-P diet.
Figure 5. Percentage of questionnaire respondents from each educational background versus dietary classifications.
However, there is a counterpoint to the increasing vegetable based diet, and that is the significantly increasing UK takeaway food sector, which has showed a £3.5 billion growth between 2009 and 2021 [Citation32]. shows the significant difference in P content between common takeaways and typical home cooked meals (average of 0.60 g P/100 g and 0.34 mg P/100 g respectively). Such a trend to higher P takeaway foods will therefore have a commensurate effect on P being discharged to WwTW.
Table 4. P content of various takeaway meals [Citation36].
The benefits of the higher likelihood of being vegan if you are young leading to a reduction in P entering WwTW, could therefore be largely negated by this generation also more likely to eat high P takeaway foods as they are often associated with meat consumption, although fast-food restaurants have recently introduced plant-based alternatives [Citation47]. Consumers increasingly want to reduce their meat consumption but still buy products that mimic meat. It is often difficult for the average citizen to consume enough protein without also consuming too much P as they are inherently linked. There is also a growing requirement for traceability among young health conscious consumers, which could reduce the prevalence of processed meats being purchased [Citation48].
Despite shifts in ideals, the food industry seems to be constantly moving with consumer requirements of convenience. With convenience comes P additives [Citation28] and with the rise in consumption of ready meals and online food delivery particularly since the arrival of COVID-19, individuals are only set to consume more P. As discussed previously, similar food stuffs can contain varying amounts of P additives due to their intended shelf life [Citation49]. There is an increasing demand for food on the go, with the market expected to grow £4.9 billion between 2019 and 2024, a 26.4% increase [Citation14]. Because of this, the use of P is likely to increase despite the increasing number of people switching to plant-based diets. Consuming fresher food is inherently more expensive which also impacts personal preferences [Citation50]. As shown by Drummond [Citation27], processed ham can contain nearly double the amount of P when compared with carvery ham (9103 and 5501 mg/kg P respectively).
A realistic start to a change in ideals are schemes such as meatless Mondays, meat portion reduction and opting to switch meat for plant-based foods in a couple of meals a week. Policy makers are reluctant to address calls for the population to consume less meat; however several NGO’s continue to promote ‘meatless days’ and reduction in portion sizes [Citation51,Citation52]. However as seen in the figures above, a shift towards flexitarianism does not lead to significant changes in P excretion. There needs to be a larger movement towards vegetarianism and veganism to see significant reductions in P loads to WwTW. The data provided here shows that 50% of the population needs to adopt a vegetarian or vegan lifestyle to deliver a 8% reduction in diet contribution of P to WwTW compared with the Baseline IPSOS Mori survey data and the ‘Future’ scenario (). In this ‘Future’ scenario 20% and 25% of the population are vegan and vegetarian respectively. Real decreases in P load to WwTW would only be made if the majority of the population shift into a meat free lifestyle. Changing dietary patterns in high meat consuming countries is not only a challenge in reducing P outputs but it is also a sustainability issue due to the extent of GHG produced in livestock farming [Citation53,Citation54]. The focus on the reduction of meat for sustainability causes may accelerate the shift away from an all meat diet. However, survey data for meat eaters suggest that economics, taste and convenience would be a significant barrier to change [Citation46].
3.5. Discharges to WwTW
Comber et al. [Citation4] reported that discharges to WwTW related to food and food additives contribute 68% of the load and therefore managing this source could lead to a decrease in P loads to rivers [Citation41]. The current prediction is 15% less which could be due to changing dietary patterns since the 2013 study as well as underreporting by participants in the questionnaires. This reduction in contribution is promising as shifting diets can lead to noticeable environmental improvement. This study also shows that a further shift in eating patterns would lead to a reduction in P loads; however a large pool of the population would need to implement a plant- based lifestyle for this reduction to have commensurate impacts on water quality. Other research has also suggested that a shift to plant based diets would lead to less soluble, bioavailable P being excreted which would likely result in greater concentrations in the sludge rather than final effluents of WwTW.
4. Conclusions
This research has highlighted the importance and significance of the assumptions used to estimate P loads to WwTW. The use of questionnaire based surveys for eating habits has provided empirical data regarding eating habits and P consumption. Differences in protein intake between types of diet mean it is not possible to simply substitute meat protein for plant-based protein in calculations. Significant reductions in P loads can be achieved by a shift in eating patterns. If the entire UK population were to go vegan, a saving of 13,000 tonnes of P per annum could be achieved. It is recognised that this is an unrealistic scenario due to meat eating being ingrained within society. However, more and more consumers are turning to plant-based lifestyles. If 50% of the population became vegetarian or vegan, a saving of at least 5000 tonnes of P could be removed from WwTW influent loads per annum.
It is recognised that there is no hard and fast solution to reducing P loads in the UK; however changing attitudes and therefore behaviours are key in encouraging individuals to make the dietary shift. Significant investment is required both in education of consumers (through for example use of social media) and development of meat-based alternatives that are attractive to consumers. The food industry also needs to find preservative alternatives to P that cause less environmental damage. Without this, the rise of takeaways and convenience food could easily outweigh the natural shift to plant-based lifestyles.
Down_and_Comber_2021_ESI_revised_Dec_2021.docx
Download MS Word (665 KB)Acknowledgements
The authors wish to thank the co-ordinator of the CIP programme – UK Water Industry Research (UKWIR) for providing the information reported here, and the UK Water Utility companies Anglian, Dwr Cymru, Northumbrian, Scottish, Severn Trent, Southern, South West, Thames, United Utilities, Wessex and Yorkshire Water for their considerable efforts in generating it. The authors would also like to thank Mr Daniel Comber for his invaluable advice regarding diets and protein consumption information.
Disclosure statement
No potential conflict of interest was reported by the author(s).
References
- FSA. US Food Standards Agency. Phosphorus and the diet; 2007; [cited 2020 Sept 16]. Available from: http://www.eatwell.gov.uk
- Kalantar-Zadeh K, Gutekunst L, Mehrotra R, et al. Understanding sources of dietary phosphorus in the treatment of patients with chronic renal disease. Clin J Am Soc Nephrol. 2010;5:519–530.
- Winger R, Uribarri J, Lloyd L. Phosphorus-containing food additives: an insidious danger for people with chronic kidney disease. Trends Food Sci Technol. 2012;24:92–102.
- Comber S, Gardner M, Georges K, et al. Domestic source of phosphorus to sewage treatment works. Environ Technol. 2013;34(9-12):1349–1358.
- Selemani JR, Zhang J, Muzuka ANN, et al. Nutrients’ distribution and their impacts on Pangani River Basin’s ecosystem – Tanzania. Environ Technol. 2018;39:702–716.
- Environment Agency. Phosphorus and Freshwater Eutrophication Pressure Narrative; 2019; [cited 2020 Sept 24].
- Bowes MJ, Smith JT, Jarvie HP, et al. Modelling of phosphorus inputs to rivers from point and diffuse sources. Sci Total Environ. 2008;385:125–138.
- White PJ, Hammond HP. Updating the estimate of the sources of phosphorus in UK waters Defra project WT0701CSF. Department for Environment Food and Rural Affairs, 2007.
- Miller HK, Hooda PS. Phosphorus species and fractionation – why sewage derived phosphorus is a problem. J Environ Management. 2011;92:1210–1214.
- Comber S, Gardner M, Darmovzalova J, et al. Determination of the forms and stability of phosphorus in wastewater effluent from a variety of treatment processes. J Environ Chem Eng. 2015;3(4):2924–2930.
- Defra. Department for Environment, Food and Rural Affairs. Sewage treatment in the UK: UK implementation of the EC urban wastewater treatment directive. 2002, Report number PB6655.
- Holliday M. A comprehensive study of phosphorus additives and their effect on the American population. University of Wisconsin-stout, graduate school, 2007; [cited 2020 Mar 29].
- Bowman B, Russell R. Present knowledge of nutrition. Washington (DC): International Life Sciences Institute Press; 2001.
- IGD. UK food-to-go sector to grow by 26.4% by 2024; 2019; [cited 2020 Sept 15]. Available from: https://www.igd.com/articles/article-viewer/t/uk-food-to-go-sector-to-grow-by-264-by-2024/i/22073
- Kalantar-Zadeh K, Gutekunst L, Mehrotra R, et al. Understanding sources of dietary phosphorus in the treatment of patients with chronic kidney disease. Clin J Am Soc Nephrol. 2010;5:519–530.
- Kremsdorf R, Hoofnagle A, Kratz M, et al. Effects of a high-protein diet on regulation of phosphorus homeostasis. J Clin Endocrin Metabolism. 2013;98(3):1207–1213.
- US Department of Agriculture. Agricultural Research Service. USDA Nutrient Database for Standard Reference, Release 14. Nutrient Data Laboratory Home Page; 2001; [cited 2020 Apr 2].
- Calvo MS, Uribarri J. Contributions to total phosphorus intake: all sources considered. Semin Dial. 2013;26(1):54–61.
- Jonsson H, Stinzing AR, Vinneras B, et al. Guidelines on the use of urine and faeces in crop production. Report 2004-2, EcoSanRes series, 2004, Stockholm Environment Institute.
- Metson G, Cordell D, Ridoutt B. Potential impact of dietary choices on phosphorus recycling and global phosphorus footprints: the case of the average Australian city. Front Nutr. 2016;3:1–7.
- Mihelcic JR, Fry LM, Shaw R. Global potential of phosphorus recovery from human urine and feces. Chemosphere. 2011;84:832–839.
- Naden P, Bell V, Carnell E, et al. Nutrient fluxes from domestic wastewater: A national-scale historical perspective for the UK 1800–2010. Sci Tot Environ. 2016;572:1471–1484.
- Forber KJ, Rothwell SA, Metson GS, et al. Plant based diets add to the wastewater phosphorus burden. Environ Res Letts. 2020;15:094018.
- Elorinne A-L, Alfthan G, Erlund I, et al. Food and nutrient intake and nutritional status of Finnish vegans and non-vegetarians. PLoS One. 2016. doi:10.1371/journal.pone.0148235
- Mariotti F, Gardner CD. Dietary protein and amino acids in vegetarian diets—a review. Nutrients. 2019;11(11):2661. doi:10.3390/nu11112661
- Bakaloudi D, Halloran A, Rippin H, et al. Intake and adequacy of a vegan diet. A systematic review of the evidence. Clin Nutr. 2020. doi:10.1016/j.clnu.2020.11.035
- Drummond S. Phosphorus in food – contribution of human diet via sewage works, building on previous research. University of Plymouth; 2016; [cited 2020 Sept 3].
- León J, Sullivan C, Sehgal A. The prevalence of phosphorus-containing food additives in top-selling foods in grocery stores; 2020; [cited 2020 Sept 15].
- Bell R, Draper H, Tzeng D, et al. Physiological responses of human adults to foods containing phosphorus additives. J Nutrition. 1977;107:42–50.
- The Vegan Society. Diet Statistics 2020; [cited 2021 Nov 15]. Available from: https://www.vegansociety.com/news/media/statistics/worldwide#:~:text=Veganism%20in%20the%20UK,150%2C000%20(0.25%25)%20in%202014
- Moe SM, Zidesharai MP, Chambers MA. Vegetarian compared with meat dietary protein source and phosphorus homeostasis in chronic kidney disease. Clin J Am Soc Nephrol. 2010;6:257–264.
- Just Eat. Household expenditure on takeaways in the United Kingdom (UK) from 2009 to 2021* (in billion GBP) [Graph]; 2017; [cited 2020 Sept 9]. Available from: https://www.statista.com/statistics/584999/takeaways-household-spending-united-kingdom-uk/
- Brophy A. Restaurants Takeaways and Food Delivery Apps. YouGov; 2019; [cited 2020 Jul 26]. Available from: https://yougov.co.uk/topics/resources/articles-reports/2019/11/18/restaurants-takeaways-and-food-delivery-apps
- CGA. Share of people who plan to increase their use of food delivery services due to the coronavirus (COVID-19) pandemic in Great Britain in March 2020, by age. Statista, 2020, Statista Inc; [cited 2020 Sept 10]. Available from: https://www.statista.com/statistics/1107212/covid-19-food-delivery-frequency-in-great-britain/
- Goody DC, Ascott MJ, Lapworth DJ, et al. Mains water leakage: implications for phosphorus source apportionment and policy responses in catchments. Sci Total Environ. 2017;579:702–708.
- Public Health England. The McCance and Widdowson’s the composition of foods integrated dataset. UK nutrient database. Food Standards Agency of the United Kingdom; 2019; [cited 2020 May 3]. Available from: https://www.gov.uk/government/publications/composition-of-foods-integrated-dataset-cofid
- Public Health England. Nutrient analysis survey of fresh and processed fruit and vegetables in relation to fibre: Analytical report; 2017; [cited 2020 Jun 11]. Available from: https://assets.publishing.service.gov.uk/government/uploads/system/uploads/attachment_data/file/603483/fruit_and_vegetable_survey_2015_analytical_report.pdf
- IPSOS MORI. Vegan Society Poll; 2016; [cited 2020 Aug 12]. Available from: https://www.ipsos.com/ipsos-mori/en-uk/vegan-society-poll
- ONS. Office of National Statistics data; 2020; [cited 2020 Dec 15]. Available from: https://www.ons.gov.uk/peoplepopulationandcommunity/populationandmigration/populationestimates/bulletins/annualmidyearpopulationestimates/mid2019estimates
- UKWIR. The National Chemical Investigations Programme 2015-2020 - Volume 1 Part 1 (2015-2017) Monitoring Of Sewage Effluents, Surface Waters And Sewage Sludge. 2018, Report no. 18/EQ/01/12. ISBN: 1 84057 851 3. Published 24/4/2018.
- Comber S, Gardner M, Ellor B. Seasonal variation of contaminant concentrations in wastewater treatment works effluents and river waters. Environ Technol. 2020;41:2716–2730.
- Lockwood A. Social media and the rise of the vegan. University of Sunderland; 2018; [cited 2020 Sept 15]. Available from: https://www.sunderland.ac.uk/more/news/story/social-media-and-the-rise-of-the-vegan-607
- Statista. Instagram users in the United Kingdom (UK) as of June 2020, by age of users (in percentage) [Graph]. In Statista; 2020; [cited 2020 Sept 15]. Available from: https://www.statista.com/statistics/1018012/instagram-users-united-kingdom/
- Comber S, Gardner M, Ellor B. Effects of iron dosing used for phosphorus removal at wastewater treatment works; impacts on forms of phosphorus discharged and secondary effects on concentrations and fate of other contaminants. Sci.Total Environ. 2021;767:145434. doi:10.1016/j.scitotenv.2021.145434
- Gardner M, Jones V, Comber S, et al. Performance of UK wastewater treatment works with respect to trace contaminants. Sci Tot Environ. 2013;456-457:359–369.
- Bryant C. We can’t keep meating like this: attitudes towards vegetarian and vegan diets in the United Kingdom. Sustainability. 2019;11(23):6844.
- PETA. Vegan food launches for January 2020; [cited 2020 Sept 15]. Available from: https://www.peta.org.uk/living/vegan-food-2020/
- Gapper J. Fake meats brand identity is too squishy: Plant-based burgers struggle to match the sensory pleasures of the original. Financial times; 2018; [cited 2020 Sept 10].
- Gutiérrez O. Sodium- and phosphorus-based food additives: persistent but surmountable hurdles in the management of nutrition in chronic kidney disease. 2020 [accessed 15th Sept. 2020].
- Fairbrother M. Rich people,: poor people, and environmental concern: evidence across nations and time. Eur Sociol Rev. 2013;29(5):910–922.
- MacMillan T, Middleton J. Livestock consumption and climate change. Progress and priorities. Food Ethics Council and WWF-UK, Brighton, UK, 2010; [cited 2020 Sept 15].
- Sutton C, Dibb S. Prime cuts. Valuing the meat we eat. WWF-UK (World Wide Fund For Nature) and the Food Ethics Council, Surrey; 2013; [cited 2020 Sept 15].
- Smil V. Worldwide transformation of diets,: burdens of meat production and opportunities for novel food proteins. Enzyme Microbial Technol. 2002;30:305–311.
- Westhoek H, Rood T, Van den Berg M, et al. The protein puzzle; the consumption and production of meat, dairy and fish in the European Union. PBL Netherlands Environmental Assessment Agency, The Hague; 2011; [cited 2020 Sept 15].