
 ?Mathematical formulae have been encoded as MathML and are displayed in this HTML version using MathJax in order to improve their display. Uncheck the box to turn MathJax off. This feature requires Javascript. Click on a formula to zoom.
ABSTRACT
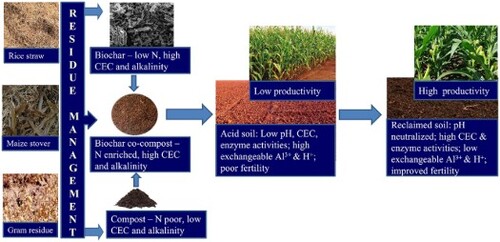
Tropical soils are often deeply weathered and vulnerable to degradation having low pH and unfavorable Al/Fe levels, which can constrain crop production. This study aims to examine nitrogen-enriched novel biochar co-composts prepared from rice straw, maize stover, and gram residue in various mixing ratios of the biochar and their feedstock materials for the amelioration of acidic tropical soil. Three pristine biochar and six co-composts were prepared, characterized, and evaluated for improving the chemical and biological quality of the soil against a conventional lime treatment. The pH, cation exchange capacity (CEC), calcium carbonate equivalence (CCE) and nitrogen content of co-composts varied between 7.78–8.86, 25.3–30.5 cmol (p+) kg−1, 25.5–30.5%, and 0.81–1.05%, respectively. The co-compost prepared from gram residue biochar mixed with maize stover at a 1:7 dry-weight ratio showed the highest rise in soil pH and CEC, giving an identical performance with the lime treatment and significantly better effect (p < .05) than the unamended control. Agglomerates of calcite and dolomite in biochar co-composts, and surface functional groups contributed to pH neutralization and increased CEC of the amended soil. The co-composts also significantly (p < .05) increased the dehydrogenase (1.87 µg TPF g−1 soil h−1), β-glucosidase (90 µg PNP g−1 soil h−1), and leucine amino peptidase (3.22 µmol MUC g−1 soil h−1) enzyme activities in the soil, thereby improving the soil’s biological quality. The results of this study are encouraging for small-scale farmers in tropical developing countries to sustainably reutilize crop residues via biochar-based co-composting technology.
GRAPHICAL ABSTRACT
1. Introduction
Soil degradation is defined as a change in the soil health status resulting in a diminished capacity of the ecosystem to provide goods and services for beneficiaries. Degraded soils have a health status that does not provide the normal goods and services of soil in its ecosystem functions [Citation1]. Soils that show pH in the acidic range generally exhibit low cation exchange capacity (CEC) most of which is contributed by exchangeable Al3+ and H+. As the soil acidity increases, the exchangeable Al3+ and H+ also increase and cause toxicity to soil organisms and plants, resulting in soil degradation. Soil acidification is a major problem in agricultural production, affecting 30–40% of the world’s arable land that is mostly located in the humid tropics [Citation2]. The main limitations in acid soils for crop production are aluminum (Al) and iron (Fe) toxicity, phosphorus (P) and molybdenum (Mo) deficiency, low base saturation, and low microbiological activity [Citation3]. Liming materials form OH–, HCO3–2 and CO3–2 ions (increasing the pH) which react with the indigenous H+ or H+ formed from the hydrolysis of Al3+ generating exchangeable Ca2+ and Al(OH)3. The solubility of Al3+ is dependent on the soil pH. Exchangeable and soluble Al3+ get precipitated as hydroxy-Al species when acid soil is limed [Citation4]. Undecomposed and/or partially decomposed organic materials could increase the soil pH by several mechanisms including specific adsorption of organic anions on hydrous Fe and Al surfaces and corresponding release of OH– ions, proton consumption during the reduction of metallic ions, and ammonification of labile organic nitrogen (N) in composts and manures [Citation5]. The increase in soil pH correspondingly decreases the exchangeable Al/Fe concentration, increases CEC, and hence decreases Al/Fe saturation. Availability of P gets increased due to the decrease in P sorption, which results in an increase in the solubility of P/Al and Fe minerals and increases the mineralization of organic P. Acid soils thus require amelioration to overcome the above problems and to convert these degraded soils suitable for crop production.
Lime is conventionally used to reclaim acid soils, but resource-poor farmers in low- and middle-income countries located in the tropics often lack access to the right quantity of reasonable grade agricultural lime due to its high cost. Long-term application of farmyard manure (FYM) or composts could help buffering the soil acidity to a value suitable for crop production [Citation6], but the preparation of composts takes a long time and the availability of animal dung is a problem due to the rapid mechanization of agriculture under severe labor shortage in rural areas. Traditional application of manures to soil could also act as a source of various conventional [e.g. toxic metal(loid)s] [Citation7] and emerging contaminants (e.g. microplastics, antibiotics) [Citation8,Citation9], creating secondary environmental issues in the long run [Citation10].
Biochar-based materials have received widespread attention in environmental remediation applications [Citation11]. Biochar, which is produced by pyrolyzing bio-waste including agricultural residues in oxygen limited conditions, also holds promise to be used as an alternative liming material because of its intrinsic alkalinity and ability to elevate soil pH [Citation6,Citation12]. Biochar is reported to reduce soil’s exchangeable acidity [Citation6] and enhance the pH value of acidic soils [Citation13] with co-benefits of carbon sequestration [Citation14], improvement of soil fertility, and plant productivity [Citation12,Citation15–18], and enhancement of soil microbial activities [Citation19,Citation20]. However, the effect of biochar on soil biota could be positive, neutral, or detrimental [Citation21], i.e. the presence of toxic elements and compounds in biochar could lead to negative effects on soil fauna (e.g. earthworms) and microorganisms [Citation22–26]. The presence of toxic compounds such as benzene, phenols, carboxylic acids, ketones, furans, and polycyclic aromatic hydrocarbons (PAHs), which are by-products of the pyrolysis process and may be found in water or organic extracts of biochar, may contribute to these deleterious effects [Citation27,Citation28]. The other shortcoming of biochar use in agriculture is the availability of biochar at a low cost, and this is only possible if biochar is emanated as a by-product from the biomass-bioenergy industry.
The soil liming efficacy of composts could be increased by infusing alkaline materials such as biochar with raw plant residues during the compost preparation stage [Citation29]. Owing to the highly porous structure, plenty of reactive surface functional groups, and high cation and anion exchange capacities, biochar helps to retain nutrient elements in the final co-composted material. For example, ammonia gas, which is produced during the thermophilic (45–65°C) stage of conventional plant residue composting, is usually lost into the atmosphere [Citation30], which could be remarkably reduced through biochar infusion with the raw organic matter [Citation31–34].
Blending biochar with compost was reported to enhance the performance of composting by changing the structure and diversity of bacterial and fungal populations [Citation32], decreasing elemental losses and odors [Citation35,Citation36], and reducing emissions of CH4 [Citation37] and N2O [Citation38,Citation39]. Simultaneous immobilization and mineralization of biochar PAHs could also happen during composting [Citation40]. The co-composting process was reported to augment the humification of organic matter in the final material [Citation36]. The alkaline nature of biochar enhanced the temperature, aeration, and oxygen uptake during the composting process, reduced the bulk density (BD) [Citation41] and total nitrogen losses, and increased pH [Citation38], CEC, organic matter (OM), total carbon (TC), nutrients [Citation36], and germination index of composted products [Citation42]. Biochar also enhanced the population of total aerobic heterotrophs, lactic acid bacteria, and actinomycetes [Citation43], degree of polymerization [Citation29], and activity of polyphenol oxidase [Citation44], dehydrogenase, beta-glucosidase and phosphatase enzymes in the co-composted products [Citation45]. Being present in the co-composted material, biochar assists the immobilization of potentially toxic substances, thereby decreasing the potential risk of transfer of contaminants from a compost-amended soil to plants ([Citation43,Citation46].
A major problem associated with the rice-wheat cropping system in the tropical Indo-Gangetic Plains is the safe and environmentally friendly disposal of a large quantity of crop residues, especially rice straws [Citation47,Citation48]. As the window between harvest of rice and sowing of succeeding wheat crop is less than a month, an easy option, the farmers employ, is to burn the residues in-situ in the field, which causes loss of essential plant nutrients and severe air pollution by emitting GHG, smoke and suspended particulate matter into the atmosphere [Citation49,Citation50]. One promising way to tackle the above issue could be to convert rice residues to bioenergy and biochar via green technologies [Citation51] and return the biochar to soils to restore carbon and simultaneously ameliorate soil constraints [Citation47,Citation52] including acidity [Citation53]. However, major limitations of using pristine biochar alone in agricultural soils are its high C:N ratio and poor plant available nutrient content that might not be sufficient to meet crop nutrient demand for sustaining yield. Co-composting crop residues with biochar could not only make the biochar rich in nutrient contents [Citation54], but also facilitate a slow release of those nutrients in synchronization with crop demands [Citation55,Citation56], reclaim acid soils [Citation57], improve soil biological health [Citation58], enhance carbon sequestration, reduce GHG emissions [Citation59], immobilize organic pollutants [Citation60], and minimize plant availability of compost-associated potentially toxic substances [Citation61].
Very limited studies are available on the impact of biochar co-composts in reclaiming tropical acid soils, enriching C and N, and improving soil enzymatic activities. The current study aims to examine nitrogen-enriched novel biochar co-composts prepared from rice straw, maize stover, and gram residue in various mixing ratios of the biochar and their feedstock materials for ameliorating a tropical acid soil. It was hypothesized that the addition of biochar rich in surface functional groups and carbonate mineral phases to crop residues in optimum proportion during composting would concentrate nutrients (especially N), and increase soil liming efficacy of the co-compost, bringing improved chemical and biological quality of the amended soil. This study, for the first time, optimizes the mixing ratio of the above-mentioned crop residues for biochar co-compost production to achieve maximum liming efficacy and quality improvement in an Indian acid soil where open burning of crop residues is a huge environmental and socio-economic issue.
2. Materials and methods
2.1. Characterization of residue and dung samples
Rice (Oryza sativa L.) straw, maize (Zea mays L.) stover and gram (or chickpea; Cicer arietinum L.) residues (collected from the experimental farm of Indian Agricultural Research Institute, New Delhi) and cow dung sample (moisture79.5%, total solid 10.5%, TC 45.1%, TN 0.45% – all on oven dry weight basis) (collected from the Integrated Farming Unit of the Division of Agronomy, Indian Agricultural Research Institute, New Delhi) were first air-dried and then dried in an oven at 60 ± 5°C for 72 and 6 h, respectively. The dried plant and dung samples were cut into pieces, grinded, sieved (through a 0.2-mm screen), and analyzed for total C and N on a CHNS analyzer (EA3000, Euro Vector Elemental Analyzer, Italy). Total C (TC), total N (TN) and C:N ratio of rice straw (45.1% C, 0.46% N, 98:1 C:N), maize stover (44.8% C, 0.81% N, 56:1 C:N), gram residue (46.5% C, 1.89% N, 25:1 C:N), and dung (45.1% C, 0.46% N 98:1 C:N) samples were computed accordingly.
2.2. Preparation of biochar
Dried rice straw (RS), maize stover (MS), and gram residue (GR) (whole plant residue of chickpea collected after threshing of grains) were cut into small pieces (30−50 mm) for the preparation of biochar in an electrically operated temperature-controlled biochar maker (Labex Instruments Pvt. Ltd., India) at 400°C under a constant flow of N2 (1.5 mL sec−1). The cylindrical reactor (dimension: diameter 33 cm, height 37 cm) kept inside a muffle furnace had a capacity to handle 1 kg of feedstock in one batch which yielded about 450–500 g of biochar (45–50% recovery). The pyrolysis temperature was increased at the rate of 2°C min−1 from room temperature (25°C) to 400°C, kept at this temperature for 2 h, then cooled down to room temperature overnight, and the next day the lid of the container was opened to collect the biochar [Citation47]. An outlet tube from the biochar maker was connected to a series of five steel made cylindrical traps (diameter 10 cm, height 38 cm) immersed in a water tank (dimension: length 89 cm × breadth 62 cm × height 41 cm), two empty glass jars (dimension: 2 L volume each), and an exhaust pump for removing the tar, polycyclic aromatic hydrocarbon (PAH), liquids and syn gases produced during pyrolysis. The biochar maker did not have the facility to absorb the gaseous components. The chance of PAH to accumulate on the surface of biochar was negligible due to the continuous removal of PAH and other materials by the exhaust pump. The biochar sample was weighed, and the charring yield (% biochar) was calculated using Equation (1):
(1)
(1) Biochar samples were grinded and sieved to obtain size fractions between 0.5 and 2 mm and stored airtight for further analysis. The yield of rice straw biochar (RSBC), maize stover biochar (MSBC), and gram residue biochar (GRBC) were 42, 42, and 45%, respectively.
2.3. Characterization of biochar
Biochar samples were characterized for physical properties such as BD, particle density (PD), maximum water holding capacity (MWHC), ash, volatile matter, and fixed C contents using standard methods in replicated samples (Supplementary Information; Table S1). Biochar samples were also characterized for their pH and EC, CEC, and calcium carbonate equivalent (CCE) values (Table S1). TC and TN contents in biochar were determined by the CHNS analyzer (EA3000, Euro Vector Elemental Analyzer, Italy) using the dry combustion method. The above biochar parameters were analyzed in four replicated samples and average values were reported ().
Table 1. Physical and chemical properties of biochar.
Composite samples of biochar sub-samples were prepared for the microscopic and spectroscopic analyses. A scanning electron microscopy (SEM) investigation was conducted to obtain morphological information of biochar samples after coating with an alloy of palladium and gold. Images were acquired at a beam energy of 20 kV using a Field Emission Scanning Electron Microscope (Quanta-200F, FEI, U.S.A.). X-ray diffraction (XRD) patterns of biochar samples were obtained using Ni-filtered Cu-Kα radiation at a scanning speed of 1.5° 2θ min−1 (PW-1710, Phillips, Japan), operated at 40 kV and 20 mA. The crystalline mineral phases of biochar were identified by comparing the observed diffractograms with published literature. Fourier transform infrared spectroscopy (FTIR) of the KBr-pelleted biochar samples was carried out in the wavelength region of 4000–400 cm−1 [Citation62] averaging 24 scans at a resolution of 4° cm−1 (on a spectrometer (ALPHA II, Bruker, U.S.A.)). The pellets of biochar were prepared by mixing 5 mg of biochar (0.5 mm sieved) with 1 g of analytical grade dehydrated KBr by applying pressure in a hydraulic press [Citation47].
2.4. Preparation of biochar co-compost
For the preparation of co-composts, RS and MS were cut into small pieces (30−50 mm), and mixed with RSBC, MSBC, and GRBC, respectively, at the ratio of 7:1, 9:1, and 11:1 (w/w) in total 18 combinations. Previous studies reported that biochar in combination with bio-waste in a 1:9 ratio resulted in high recovery of nutrients and C, and reasonable product yield [Citation63]. By taking the above-mentioned three mixing ratios, the current study tested whether the 1:9 ratio could be narrowed down while obtaining similar beneficial effects in the co-compost or not. Composting was done in plastic containers with a dimension of 61 cm (length) × 46 cm (breadth) × 31 cm (height) with the addition of N through urea to bring down the C:N ratio of the composting mixture to 50–60:1 [Citation64]. The required amount of urea, 10% (w/w) fresh cow dung slurry, and an inoculum of the PUSA decomposer (5 mL kg−1) (a microbial consortium of cellulolytic fungi, namely Aspergillus awamori, Trichoderma viridae, Phanerochaete chryosporium and Aspergillus nidulans) [Citation64], were evenly mixed with the biochar and crop residues. The compost mixture was sprinkled with water at a regular interval to maintain the moisture level at 60%. The composting pile was turned on a weekly basis to facilitate aeration. The temperature was recorded on alternate days at three random points of the compost pits to monitor the progress of composting. The temperature increased during the composting process in the initial 10 days up to 50°C, while the atmospheric temperature was around 38°C. Finally, it declined to ambient level after 30 days and remained stable till 60 days. The maturity of the co-composts was decided based on the C:N ratio of the products reaching 20:1. Total composting duration was 60 days. The co-composts thus obtained were sieved through a 4-mm screen and stored for further use.
2.5. Characterization of co-composts
The pH, EC, CEC, TC and TN contents, and CCE of the co-composts were analyzed in three replicated samples using standard methods (Table S1).
2.6. Collection of soil sample and analysis
An acidic surface soil (0–15 cm) belonging to the order Alfisol [Citation65] was collected from Ranchi, Jharkhand, India (85°8″–85°20″E, 23°34″–23°23″N), located 120 m above the mean sea level. The sampling area falls under the sub-humid climate with severe hot and dry summer, and cold winter. The average annual rainfall in this region is about 1450 mm. The soil belongs to the sub-order of red Typic Haplustalf [Citation65] with a sandy clay loam texture, and acidic reaction (pH = 5.05). The lime requirement (LR) of the experimental acid soil was 2.45 g kg−1, as measured using the p-nitrophenol triethanolamine chromate acetate buffer (pH 7.5) method. The experimental soil had an EC = 0.31 dS m−1, CEC = 9.1 cmol (p+) kg−1 soil and MWHC = 40.8%.
2.7. Incubation experiment
Depending on the best intended physico-chemical characteristics (pH, EC, CEC, CCE, N content, and C/N ratio) of the prepared biochar co-composts (), six products, namely RS + RSBC (7:1), RS + GRBC (7:1), RS + GRBC (9:1), RS + GRBC (11:1), MS + GRBC (7:1) and MS + GRBC (11:1) were selected for the neutralization of the acid soil. It was hypothesized that biochar co-compost with higher pH, CEC, CCE, N content, and lower C:N ratio would perform effectively in ameliorating the acid soil. Additionally, the three pristine biochar (RSBC, MSBC, and GRBC) and 2/3rd of the soil’s LR (1.70 g laboratory grade CaCO3 kg−1) alongside an absolute control treatment (without any amendment) were included for comparison purposes. Air-dried soil (80 g) sieved through a 2-mm screen was placed in 100 mL glass beakers to which the biochar (17.6 g kg−1), co-compost (17.6 g kg−1), and CaCO3 (1.70 g kg−1) amendments were added accordingly, mixed uniformly, and moistened to reach 2/3rd of the MWHC of the soil. The application rate of biochar (17.6 g kg−1) was decided based on a preliminary soil pH change experiment with the increasing amount of biochar over the period of 15 days (Table S3). Co-compost was then applied at an equal rate of biochar to compare their liming efficacies. All the beakers were covered with parafilm and placed in an incubator for 45 days at 37°C. All the treatments were replicated three times. Two separate sets of incubation samples were maintained to investigate the physico-chemical and biological parameters of the amended soils.
Table 2. Physical and chemical properties of biochar co-composts.
After 45 days of incubation, one set of soil samples was analyzed for pH, EC, CEC, exchangeable acidity (EA), and exchangeable Al (Ex-Al), using standard methods (Table S1). The difference between EA and Ex-Al was considered as the exchangeable H+ (Ex-H) content. The second set of incubated soil samples was analyzed for soil enzymatic activities, namely dehydrogenase, β-glucosidase, and leucine aminopeptidase (LAP), at 15, 30, and 45 days of incubation, using standard methods (Table S1). Since the soil enzymatic activities peaked on 45 days of incubation, the data pertaining to this date are presented in this paper (Table 4, Figures S1–S3).
2.8. Statistical analysis
A completely randomized design (CRD) was used for the analysis of data. Analysis of variance (ANOVA) was used for testing the significance of results using the SPSS program (version 26). The mean values were separated by Duncan’s Multiple Range Test at a 5% significance level. A principal component analysis (PCA) was performed to examine the contribution of different treatments on various physico-chemical and biological parameters of the amended soil, using the R software package (version 3.3.2) [Citation66].
3. Results and discussion
3.1. Physico-chemical characteristics of biochar
The GRBC recorded the highest pH value (pH = 9.51) followed by RSBC (pH = 8.20), and MSBC (pH = 7.86) (). The EC of the biochar samples varied from 4.16 dS m−1 (MSBC) to 6.56 dS m−1 (GRBC), with a value of 6.19 dS m−1 in RSBC (). The CCE of biochar was in the order: GRBC (42.1%) > RSBC (36.6%) > MSBC (29.7%) (). The CEC was recorded the highest in GRBC [57.8 cmol (p+) kg−1], and the value was nearly similar to RSBC [56.5 cmol (p+) kg−1], but significantly higher than MSBC. The ash content was significantly higher in GRBC (39.1%) than either RSBC (37.1%) or MSBC (31.1%), while the volatile matter content in RSBC, MSBC and GRBC was 27, 23 and 31%, respectively.
The variation in pH of biochar was due to the dissimilar composition of the feedstocks, their ash contents, and the proportion of inorganic and organic fractions [Citation67]. Lower and higher ash content in MSBC (31.1%) and GRBC (39.1%) showed a lower and a higher pH value, respectively. The EC and CCE values of biochar also followed a pattern like pH values. Thus, the increase in pH, EC, and CCE of different biochar was due to the concomitant increase in ash content () which offered considerable alkalinity [Citation68,Citation69]. The high ash content might have provided the liming properties to biochar and permitted its use as a liming agent in acidic soils. Carbonate minerals present in biochar might have contributed to CCE in this study, as revealed by the XRD, SEM, and FTIR results () discussed in later sections. The lowest volatile matter was observed in GRBC (21%) and the highest in RSBC (27%) (). The CEC could be a combined effect of volatile moieties () and surface functional groups of biochar, as discussed in FTIR results later ().
Figure 1. XRD patterns of rice straw biochar (RSBC), maize stover biochar (MSBC), and gram residue biochar (GRBC).
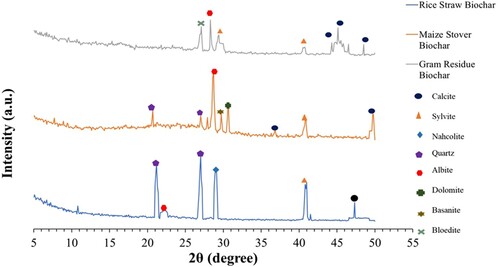
Figure 2. SEM images of (a) rice straw biochar (RSBC), (b) maize stover biochar (MSBC), and (c) gram residue biochar (GRBC).
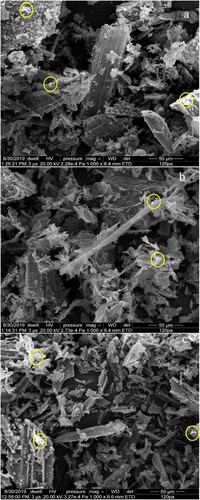
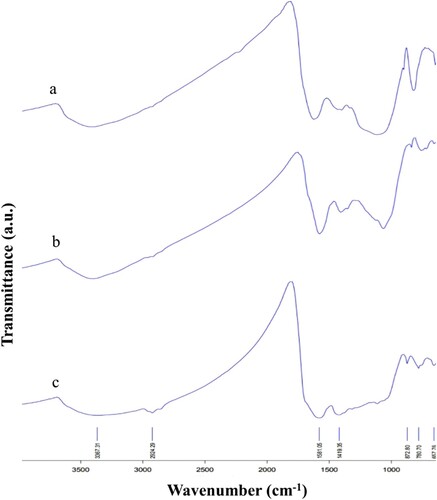
Figure 3. FTIR spectra of (a) rice straw biochar (RSBC), (b) maize stover biochar (MSBC), and (c) gam residue biochar (GRBC).
3.2. Bulk density, particle density and water holding capacity of biochar
The BD of biochar varied between 0.21 and 0.27 Mg m−3 (). GRBC had the highest BD followed by MSBC and RSBC. A similar trend was recorded for PD of biochar varying between 0.40 Mg m–3 (RSBC) and 0.57 Mg m–3 (GRBC). The MWHC and porosity were the highest in GRBC followed by RSBC and MSBC (). The bulk density of rice, wheat, maize, and pearl−millet biochar was reported to be 0.46, 0.48, 0.52, and 0.60 Mg m−3 previously [Citation47]. The low BD of biochar in the current study was likely due to the large particle size of biochar (2 mm). The PD was higher than the BD because biochar was a highly porous material [Citation70]. Particle density was reported to be positively correlated with the ash content of biochar [Citation68,Citation71], establishing the major contribution of ash in determining biochar PD in this study. Different feedstocks too might have affected the mineral composition, porosity, and biochar yield [Citation72]. The granular structure of GRBC (as evidenced from SEM images, discussed later) might be responsible for its high BD, PD, and porosity. Due to having a higher porosity, GRBC showed a higher MWHC than the other two biochar [Citation73].
3.3. Carbon and nitrogen content of biochar
The TC content was the highest in MSBC (62.6%) followed by GRBC (58.4%) and RSBC (57.6%) (). The TN content was recorded the highest in GRBC (1.69%) followed by RSBC (0.68%) and MSBC (0.67%). The C:N ratio of RSBC, MSBC, and GRBC was 85, 94, and 35, respectively. The range of TC and TN in the biochar samples was within the value reported previously [Citation47,Citation68,Citation74]. The carbon content in biochar could depend on multiple factors such as biomass type, pyrolysis temperature, and ash content. A strong negative correlation could occur between carbon and ash contents of biochar [Citation75], which was also evidenced in this study as GRBC showed low TC but high ash content. Literature reported a wide variation in N contents of biochar prepared from similar feedstocks and under similar temperature, which substantiated the fact that other production parameters such as heating rate, oxygen content, and biomass handling and storage procedures might also affect N content in biochar [Citation76].
3.4. Biochar crystal phase, morphology and surface functional groups
The XRD patterns of RSBC, MSBC, and GRBC showed sharp reflections due to the presence of crystalline quartz (SiO2), sylvite (KCl), and calcite (CaCO3) phases ( and Table S4). The presence of quartz in RSBC was supported by large reflections appearing at 3.34, 3.30, and 4.19 Å [Citation77]. The reflections at 1.92, 3.08 and 4.02 Å were attributable to the presence of calcite, nahcolite (NaHCO3), and albite (NaAlSi3O8), respectively [Citation78]. Sylvite (3.15 and 2.21 Å) [Citation68,Citation79] was observed in all three biochar samples. Similarly, the appearance of an intense reflection at 1.81 Å in MSBC and GRBC could be attributed to the occurrence of calcite [Citation77]. The XRD pattern of MSBC had shown the presence of dolomite (CaCO3·MgCO3, 2.92 Å) [Citation77], quartz (3.34 and 4.42 Å) [Citation80], basanite (CaSO4·0.5H2O) (3.006 Å) and calcite (2.49 Å). The XRD pattern of GRBC exhibited intense reflections at 2.09 and 2.04 Å, which could be attributed to calcite, alongside an additional reflection at 3.29 Å likely due to the presence of bloedite (Na2Mg (SO4)2·4H2O) [Citation77,Citation80]. Information on various crystalline mineral phases of biochar is useful for predicting the solubility and biological availability of relevant elements, particularly plant nutrients [Citation77,Citation78]. A high quantity of carbonates might have contributed to the high alkalinity of GRBC in this study. The quartz content in GRBC was negligible, while RSBC and MSBC contained quartz, which was likely due to the respective feedstock, especially rice straw being naturally rich in Si.
The circled areas in SEM images () of the biochar samples represented the presence of ash and agglomerates of various minerals, which was quantitatively higher in GRBC than RHBC and MSBC. Purakayastha et al. [Citation47] reported similar agglomerates containing calcium in rice straw and pearl-millet biochar. Morphologically the GRBC particles looked granular, whereas RSBC particles were flaky, and MSBC had particles of shape in between RSBC and GRBC.
The FTIR spectra of RSBC and GRBC showed a higher absorption of energy at 3405−3408 cm−1 region ( and Table S4), indicating a higher amount of RCOO− (carboxylate) and Ph−OH (phenolic hydroxides) groups, and higher absorption of energy in the phenolic −OH bending region (1381.2−1433.9 cm−1) [Citation68]. These results supported the higher abundance of oxygen-containing functional groups, and hence higher CEC in RSBC and GRBC than in MSBC [Citation47,Citation68]. The bands at 2854–2924 cm−1 [Citation81] and 2923−3045 cm−1 [Citation68] in RSBC and MSBC spectra indicated the presence of aliphatic C–H stretching vibrations, which were observed in the GRBC spectrum only at 2924 cm−1 (). All the three biochar spectra showed bands at 1607.83, 1601.86, and 1581.05 cm−1, respectively, which was related to COOH (carboxyl) group stretching vibrations, or C=O and C=C in-plane aromatic vibrations. These bands were reported in biochar at slightly different wave numbers in previous studies, such as 1534–1616 cm−1 and 1578−1599 cm−1 [Citation68], or 1578−1617 cm−1 [Citation82], and 1600 cm−1 [Citation83].
3.5. Physico-chemical characteristics of co-composts
The pH and EC of biochar co-composts decreased with an increase in the ratio of residue to biochar from 7:1 to 11:1 (). Except for a few instances, in the case of EC, RS + GRBC (7:1) had the greatest pH and EC, followed by RS + GRBC (9:1) and RS + RSBC (7:1). The CCE was recorded the highest in MS + GRBC (7:1) followed by RS + GRBC (7:1), RS + GRBC (9:1/11:1), MS + GRBC (9:11/11:1). Ammonification and dissolution of alkaline minerals might have resulted in the increment of alkalinity [Citation84], and thermal decomposition of organic matter during the bio-oxidative phase might have increased the pH value in the biochar co-composts [Citation85]. The alkalinity, ash content and CCE of biochar, biochar loading rate along with residues, and interactions between the components – all impacted the pH of biochar co-composts, which ranged from 7.78 to 8.60 in this study (). The pH showed a declining trend with replacement of highly alkaline GRBC (pH = 9.51) with low alkaline RSBC (pH = 8.2) and MSBC (pH = 7.86). In alignment with current results, Khan et al. [Citation86] reported pH rises in a co-composted mixture of chicken manure, saw dust, and biochar (5 and 10% wet weight) as compared with materials composted without biochar, where the high pH value of biochar accounted for the increase of pH in co-composts. Wang et al. [Citation40] also reported a high pH of compost containing wheat straw and 10% biochar than compost without biochar.
The EC of biochar co-composts varied between 2.25 and 4.20 dS m−1 and increased significantly when maize stover was replaced by rice straw in the co-compost (). The EC of co-composts could vary depending on factors such as the type of biochar feedstock and the amount of salts added through the biochar applied. Most of the rice straw derived co-composts had shown higher EC than maize stover derived co-composts. As a result, the EC showed a decreasing trend with the replacement of high salt containing biochar (GRBC; EC = 6.56 dS m−1) with low salt containing biochar (RSBC; EC = 6.19 dS m−1, and MSBC; EC = 4.16 dS m−1) in rice straw-based co-composts. The salt contents of biochar co-composts in this study were not likely to pose any salt stress to plants when applied to soils with low to moderate EC.
The CCE of biochar co-composts was the highest in MS + GRBC (7:1) followed by RS + GRBC (7:1), and the values varied between 25.5 and 30.5% was directly proportional to the quantity of carbonate mineral phases present in the biochar and hence co-composts (). Maize stover derived co-composts had a greater CCE value than rice straw derived co-composts. Overall, the CCE of biochar co-composts decreased as the residue to biochar ratio increased, and when biochar with high CCE (with high carbonate and alkalinity contents) was added in the co-composts. This result displayed the key role of biochar in increasing the liming potential of biochar co-composts, which corroborated with findings of previous reports [Citation87].
The C content in RS + RSBC and RS + MSBC decreased significantly (p < .05) when the rice straw to biochar ratio increased from 7:1 to 9:1 (). In the case of other biochar co-composts, the C content did not vary significantly. The C content was the highest in RS + MSBC (7:1). The TN content in biochar co-compost was comparatively higher (>0.81% N) than normal composts (0.7% N) such as that reported by Qiu et al. [Citation88]. The N content was recorded the highest in MS + GRBC, followed by RS + GRBC (7:1/9:1/11:1) and RS + RSBC (7:1). The N content decreased significantly in all the co-composts when the residue to biochar ratio increased from 7:1 to 11:1, with a slight exception in RS + GRBC and MS + GRBC. The C:N ratio of co-composts decreased in both the treatments containing residues with and without biochar, which might be attributable to substrate mineralization and/or an increase of TN following C degradation [Citation89]. In this study, the TC and TN contents in biochar co-composts mostly decreased as the ratio of residue to biochar increased because biochar organic matter was significantly more resistant to degradation/mineralization than that of crop residues. Overall, the C:N ratio of biochar co-compost was lower than the normal compost [Citation88].
3.6. Effect of biochar and biochar co-compost on soil pH and electrical conductivity
Among the treatments, GRBC biochar and MS + GRBC (7:1) co-compost showed the highest increment in soil pH compared to the unamended control, and these increments were at par with that of lime application (). All the treatments showed significantly (p < .05) higher soil EC than the control, in alignment to the salt content or EC values of these materials (). The RS + GRBC co-compost at both 9:1 and 11:1 ratios significantly (p < .05) increased the soil EC compared to the control, followed by MS + GRBC (7:1). The RS + RSBC (7:1), GRBC and lime treatment showed significantly (p < .05) lower soil EC than other amendments. Soil EC was higher in biochar treated soils than in the control likely due to the presence of ash in biochar materials. Berek et al. [Citation90] reported a significant increment of EC in Ultisol and Oxisol after the application of wood biochar mixed with composts. The alkalinity-containing ash and carbonate minerals in biochar and co-compost could increase both EC and pH of the soil in a mechanism similar to a lime. Alkaline amendments would release hydroxyl ions (OH−), consequently other electrolytes and more importantly the released Ca2+ might have replaced H+ and Al3+ in soil exchange complexes, which increased the pH [Citation91] and EC of an acid soil [Citation90]. A concomitant decrease in soil EA, Ex-Al, and Ex-H, and an increase in CEC of the acid soil due to the application of biochar/biochar co-compost were thus observed (). Alkalinity in biochar and co-composts would arise due to the presence of CO32−and HCO3− ions, organic moieties, formation of various alkali metal salts during feedstock pyrolysis, and functional groups on biochar surfaces (e.g. R−COO− and R−O−) [Citation80]. The pH and alkalinity of GRBC in this study were higher than RSBC and MSBC. Legumes (gram residue in this case) in general accumulate more alkali metals in their biomass due to unbalanced uptake of cations and anions compared to poaceous crops (rice and maize) [Citation92], which might have contributed to the higher alkalinity in GRBC than RSBC and MSBC. The soil pH rise due to the co-compost application was higher in narrow residue-biochar ratio material than in wide ratio material because of the higher addition of biochar in the former than in the latter one.
Table 3. Effect of biochar, biochar co-compost and lime amendments on pH, electrical conductivity, cation exchange capacity, exchangeable acidity, exchangeable Al3+ and exchangeable H+ contents in soil.
3.7. Effect of biochar and biochar co-compost on soil exchangeable acidity, exchangeable Al3+ and H+, and cation exchange capacity
A significant (p < .05) decrease in soil EA, Ex-Al, and Ex-H occurred due to the application of different amendments (). The biochar and lime treatments were the most effective in decreasing the above soil parameters, followed by various biochar co-composts. The highest extent of decrease in EA (∼49%) was noticed in RSBC treatment (). Other treatments (MSBC, GRBC, RS + GRBC, MS + GRBC, and lime) decreased EA by approximately 41% over the control. The RSBC treatment was the most effective in decreasing soil Ex-Al (by 52%) (). Among the co-composts, RS + GRBC (7:1) and MS + GRBC (7:1/11:1) were effective in decreasing Ex-Al by about 40%. The lime treatment showed the highest reduction in Ex-H (by 72%), followed by RS + GRBC (7:1) (by 57%). All three biochar samples reduced Ex-H content by about 37% over the control. The co-composts contained fewer amounts of alkaline cations than biochar and lime, which made the former less effective per unit mass of material applied for reducing EA and Ex-Al and Ex-H in the soil. Solubility of Al3+ is dependent on soil pH, which was substantiated by the results of this study that exchangeable and soluble Al species might have been precipitated as hydroxy−Al species following the application of alkaline biochar, co-composts, or lime to the acid soil [Citation93]. Firstly, biochar’s alkalinity and high pH buffering capacity generated by carbonates and alkali metal oxides would react with H+ and neutralize the soil acidity. Secondly, biochar-released base cations would exchange with Al3+ and H+ in colloidal exchange complexes and enrich them with exchangeable base cations such as Ca2+ and Mg2+. Thirdly, functional groups of biochar such as R−COO− and R−O− would react with H+, whereas _O_, _OH, -COOH could complex with Al3+ via specific adsorption, converting phytotoxic Al3+ to less toxic Al(OH)3 and Al(OH)4− species [Citation94]. The results confirmed that biochar from biomass of leguminous gram (GRBC) was a better amendment than biochar from non-leguminous crop residues for ameliorating acid soil, in alignment with previous reports [Citation92].
The lime treatment recorded the highest CEC of the soil followed by GRBC, while the control treatment gave the lowest CEC value (). The RS + GRBC (7:1) was superior to MS + GRBC (7:1) and MS + GRBC (11:1) for improving the soil CEC. The co-compost treatments too improved the soil CEC compared to the control, but the effects of different co-composts were statistically similar (p > .05). Carboxyl and phenolic functional groups could ionize and contribute to the CEC of biochar, and thus form soil charges following application of the biochar to soil [Citation95]. This study showed higher CEC of RSBC and GRBC than MSBC, which was verified by greater energy absorption, in particular, IR spectral regions of GRBC and RSBC than MSBC (; Section 3.4). Biochar treatments showed a trend of increased soil CEC according to biochar’s own CEC value, whereas the co-compost treatments changed soil CEC in accordance with the replacement of low alkaline biochar with high alkaline biochar. Narrowing down the residue to biochar ratio in co-composts was effective in increasing the soil CEC. Liming material or biochar could enhance the CEC of acid soil by modifying the pH and increasing the number of cations (e.g. Ca2+, Mg2+, K+) on soil exchangeable surfaces [Citation96]. Biochar co-composts enhanced soil CEC by similar mechanisms as stated above, but the magnitude of the effect was lesser than pristine biochar due to the dilution effect as the bulk of the material was made of crop residues. The GRBC based co-composts performed well in increasing soil CEC due to the inherently high alkalinity and CEC of this biochar.
3.8. Effect of biochar and biochar co-compost on soil enzymatic activity
All the biochar, RS + RSBC (7:1) and RS + GRBC (7:1/9:1) showed statistically similar (p > .05) dehydrogenase activity, which was higher than other treatments (). In most cases, dehydrogenase activity peaked on the 45th day after the application of amendments to the soil (Figure S1), which was also reported by Purakayastha et al. [Citation47]. A small pool of labile C (as volatile matter) detected in all the biochar samples might have fueled soil microbial metabolism immediately after biochar or co-compost addition to the soil [Citation97]. Additionally, optimization of soil porosity resulting from biochar or biochar co-compost with high porosity () would have improved oxygen availability in the soil in conjunction with soil pH correction, helping to enhance the physiological efficiency of microorganisms in terms of soil dehydrogenase activity [Citation98]. In earlier reports, low-temperature biochar produced at <500°C enhanced the activities of almost all soil enzymatic groups involved in C and N cycling and dehydrogenase activities in soil [Citation99].
Table 4. Effect of biochar, biochar co-compost and lime amendments on activities of dehydrogenase, β-Glucosidase and leucine aminopeptidase enzymes in soil.
The highest β-glucosidase activity was recorded with lime treatment followed by GRBC and MSBC. Differences in β-glucosidase activity due to the co-compost application were statistically insignificant (p > .05) (). Biochar addition resulted in a steady rise in β-glucosidase activity, which was reported also in earlier studies [Citation100]. The higher β-glucosidase activity would suggest higher microbial activity involved in soil carbon mineralization. Especially, co-composts would contain readily available C sources and polysaccharides which could be converted to glucose meeting the C and energy need of heterotrophic soil microorganisms and thus would enhance β-glucosidase activity [Citation101].
The addition of carbonaceous materials such as biochar and co-composts that contain different organic N fractions might cause variation in soil LAP activity. The highest LAP activity was recorded with the lime treatment and GRBC (). Among co-composts, RS + RSBC (7:1) and MS + GRBC (11:1) showed high soil LAP activity (). These results supported previously reported finding that the application of biochar in soil increased the activity of a series of enzymes related to soil N mineralization [Citation102].
3.9. Correlation among soil chemical and biological parameters
The liming effect of biochar and biochar co-composts was evidenced from improved soil chemical parameters including pH, EC, CEC, and EA, Ex-Al, and Ex-H contents (). Since soil biological properties are impacted by soil acidity, a correction of pH of the experimental acid soil significantly enhanced the enzymatic activity (microbial activity) (). The correlation coefficients (r) among soil chemical and biological properties thus demonstrated the significance of amending the acidic Alfisol with biochar, biochar co-compost or lime (). Soil pH negatively correlated with EA and Ex-Al. The β-glucosidase and LAP activity positively correlated with soil pH, indicating the beneficial effect of liming on these biological parameters. The EA, Ex-Al, and Ex-H showed a negative correlation with all the enzymatic activities, which signified the pH correction effect due to the application of biochar/biochar co-compost in acid soil. The β-glucosidase activity significantly correlated with dehydrogenase activity (p < .05) and LAP activity (p < .01). Since all the above enzymes are involved in the breakdown of organic matter, specifically to available C and N, a strong association among these parameters was observed.
Table 5. Correlation coefficients (r) among different chemical and biological properties of soil.
3.10. Principal component analysis
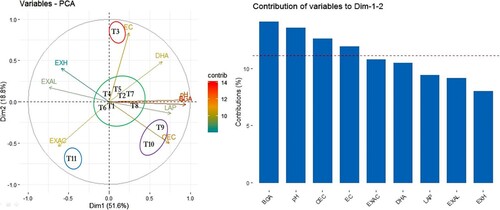
The PCA biplot exhibited two principal components, together explaining 70.34% (51.58% in PC1 and 18.76% in PC2) of the observed variability in the analysed data set (). The treatments had a significant impact on four variables, viz., BGA, pH, CEC, and EC of soil. From the biplot obtained through the PCA method based on the contribution of variables towards Dim 1 and 2, the treatments were segregated into four groups. The group was ranked in descending order of magnitude. In group 1, the highest impact was observed by the treatment T3 (RS + GRBC (9:1)) on changing EC of soil, in group 2 representing T1 (RS + RSBC (7:1)), T2 (RS + GRBC (7:1)), T4 (RS + GRBC (11:1)), T6 (MS + GRBC (11:1)), T7 (RSBC) and T8 (MSBC) having an impact on soil pH and BGA, while the group 3 representing T9 (GRBC) and T10 (2/3rd LR) impacting the soil CEC. The clustering of T9 and T10 in soil opposite to T3 in the biplot indicated their contradictory responses. The clustering of T1, T2, T4, T6, T7, and T8 together away from either T9 and T10 or T3 suggested their dissimilar responses to the change of various physico-chemical and microbiological activities in the soil. The PCA results thus reiterated that biochar and biochar co-composts resulted in various degrees of beneficial effects in ameliorating the degraded acid soil in this study.
Figure 4. Correlation biplots and identification of most important contributing parameters based on principal component analysis (PCA) depicting the relationship among the physicochemical and microbial properties of soil amended with biochar, biochar co-composts, and lime. Abbreviations: T1 − RS + RSBC (7:1), T2 − RS + GRBC (7:1), T3 − RS + GRBC (9:1), T4 − RS + GRBC (11:1), T5 − MS + GRBC (7:1), T6 − MS + GRBC (11:1), T7 − RSBC, T8 − MSBC, T9 − GRBC, T10 − 2/3rd LR, T11 − Control, RS − Rice straw; MS − Maize stover; RSBC − Rice straw biochar; MSBC − Maize stover biochar; GRBC − Gram residue biochar; LR − Lime requirement; EC − Electrical conductivity (ds m−1), CEC − Cation exchange capacity, EXAC − Exchange acidity, EXAL − Exchangeable Al3+, EXH − Exchangeable H+, DHA − Dehydrogenase activity, BGA − β-glucosidase activity, LAP − Leucine amino peptidase activity.
4. Conclusions
The physical and chemical properties of biochar including BD, PD, MWHC, porosity, pH, alkalinity, ash content, CEC, and CCE were significantly affected by the feedstock type. The above properties of biochar and biochar co-composts helped in explaining their liming efficacies for ameliorating acid soil. Gram residue biochar (GRBC) emerged as a promising liming material which decreased the EA by 40% and increased the soil pH and CEC by 36% and 32%, respectively, showing comparable effects to agricultural lime treatment for neutralizing exchangeable acidity and enhancing CEC of the soil. The alkalinity and CCE of biochar co-composts were governed by the residue to biochar ratio during co-composting, and the 7:1 ratio performed well with respect to the above properties. Among the biochar co-composts, RS + GRBC (7:1) followed by MS + GRBC (7:1) emerged as promising liming material for increasing the pH of the acid soil. The application of biochar and biochar co-composts on average also enhanced soil dehydrogenase, β-glucosidase, and leucine aminopeptidase activities (by 80%, 432%, and 133% with biochar and by 103%, 737%, and 169% with co-composts), which hold implications in improving biological quality, and C and N cycling in the soil. Despite many advantages of biochar and biochar co-compost on soil health, the presence of potentially hazardous components and PAHs in the products may have ecotoxic impacts. Conducting bioassays in solid phases and aqueous extracts is essential for the screening of biochar/biochar co-composts and for assessing the potential eco-toxicity caused or mitigated by such amendments. Likewise, the effect of such N enriched alkaline co-composts on the fractions of N should be studied for their wide scale field application in future. The cost involved in biochar production and biochar’s ecological and economic benefits in terms of improving the ecosystem functioning of soil and plant productivity also needs to be analyzed before popularizing this technology among the farming community.
Nain_et_al._SI_R1.docx
Download MS Word (226.1 KB)Acknowledgements
Pooja Nain is grateful to ICAR-Indian Agricultural Research Institute, New Delhi, for providing necessary funding in the form of a Junior Research Fellowship (IARI/JRF/21187) to carry out this work. The authors are thankful to Dr. Rajesh Kumar, Division of Agricultural Chemicals, and Dr. Debarup Das, Division of Soil Science and Agricultural Chemistry, ICAR-Indian Agricultural Research Institute, New Delhi, for helping in the FTIR and XRD analyses of biochar, respectively. Binoy Sarkar was supported by the Lancaster Environment Centre Project.
Disclosure statement
No potential conflict of interest was reported by the author(s).
Data availability statement
All data generated or analyzed during this study are included in this published article and its supplementary information file.
Additional information
Funding
References
- FAO. (2022). https://www.fao.org/soils-portal/soil-degradation-restoration/en/
- Dai Z, Zhang X, Tang C, et al. Potential role of biochars in decreasing soil acidification-a critical review. Sci Total Environ. 2017;581–582:601–611.
- Wei H, Liu Y, Xiang H, et al. Soil pH responses to simulated acid rain leaching in three agricultural soils. Sustainability. 2019;12:280.
- Yirga C, Erkossa T, Agegnehu G.. Soil acidity management. Ethiopian Institute of Agricultural Research (EIAR). 2019, Addis Ababa, Ethiopia.
- Rengel Z. Handbook of plant growth pH as the master variable. Vol. 88. Perth: University of Western Australia; 2002. p. 303.
- Meena HM, Prakasha HC. The impact of biochar: lime and fertilizer on soil acidity and microbiological properties and their relationship with yield of rice and cowpea in an acidic soil of Southern India. J Plant Nutri. 2021. DOI:10.1080/01904167.2021.1952225
- Awasthi MK, Wainaina S, Mahboubi A, et al. Methanogen and nitrifying genes dynamics in immersed membrane bioreactors during anaerobic co-digestion of different organic loading rates food waste. Biores Technol. 2021;342:125920.
- Gonod LV, Dellouh LPY, Andriamalala A, et al. Fate of sulfa methoxazole in compost,: manure and soil amended with previously stored organic wastes. Sci Total Environ. 2022;803:150023.
- Vithanage M, Ramanayaka S, Hasinthara S, et al. Compost as a carrier for microplastics and plastic-bound toxic metals into agroecosystems. Curr Opinion Environ Sci Health. 2021;24:100297.
- Urra J, Alkorta I, Garbisu C. Potential benefits and risks for soil health derived from the use of organic amendments in agriculture. Agronomy. 2019;9(9):542.
- Lu L, Yu W, Wang Y, et al. Application of biochar-based materials in environmental remediation: from multi-level structures to specific devices. Biochar. 2020;2(1):1–31.
- Wu S, Zhang Y, Tan Q, et al. Biochar is superior to lime in improving acidic soil properties and fruit quality of Satsuma mandarin. Sci Total Environ. 2020a;714:136722. doi:10.1016/j.scitotenv.2020.136722.
- He M, Xiong X, Wang L, et al. A critical review on performance indicators for evaluating soil biota and soil health of biochar-amended soils. J Hazard Mater. 2021;414:125378.
- Han J, Zhang A, Kang Y, et al. Biochar promotes soil organic carbon sequestration and reduces net global warming potential in apple orchard: two-year study in the Loess Plateau of China. Sci Total Environ. 2022;803:150035.
- Ahmad A, Chowdhary P, Khan N, et al. Effect of sewage sludge biochar on the soil nutrient, microbial abundance, and plant biomass: A sustainable approach towards mitigation of solid waste. Chemosphere. 2022;287:132112. DOI:10.1016/j.chemosphere.2021.132112
- Gamage A, Basnayake B, De Costa J, et al. Effects of rice husk biochar coated Urea and anaerobically digested rice straw compost on the soil fertility, and cyclic effect of phosphorus. Plants. 2022;11(1):75.
- Purakayastha TJ, Bera T, Bhaduri D, et al. A review on biochar modulated soil condition improvements and nutrient dynamics concerning crop yields: pathways to climate change mitigation and global food security. Chemosphere. 2019;227:345–365.
- Purakayastha TJ, Das KC, Gaskin J, et al. Effect of pyrolysis temperatures on stability and priming effects of C3 and C4 biochars applied to two different soils. Soil Tillage Res. 2016;155:107–115.
- Giannitsopoulos ML, Burgess PJ, Rickson RJ. Effects of conservation tillage drills on soil quality indicators in a wheat–oilseed rape rotation: organic carbon: earthworms and water-stable aggregates. Soil Use Manag. 2020;36(1):139–152.
- Hill R, Hunt J, Sanders E, et al. Effect of biochar on microbial growth: a metabolomics and bacteriological investigation in E. coli. Environ Sci Technol. 2019;53:2635–2646.
- Lehmann J, Rillig MC, Thies J, et al. Biochar effects on soil biota – a review. Soil Biol Biochem. 2011;43:1812–1836.
- Dempster D, Gleeson D, Zi S, et al. Decreased soil microbial biomass and nitrogen mineralisation with Eucalyptus biochar addition to a coarse textured soil. Plant Soil. 2012;354:311–332.
- Gomez-Eyles JL, Sizmur T, Collins CD, et al. Effects of biochar and the earthworm Eisenia fetida on the bioavailability of polycyclic aromatic hydrocarbons and potentially toxic elements. Environ Pollut. 2011;159:616–622.
- Liu Q, Zhang Y, Liu B, et al. How does biochar influence soil N cycle? A meta-analysis. Plant Soil. 2018;426(1–2):211–225.
- Liu T, Yang L, Hu Z, et al. Biochar exerts negative effects on soil fauna across multiple trophic levels in a cultivated acidic soil. Biol Fertil Soils. 2020;56:597–606.
- Wu Q, Lian R, Bai M, et al. Biochar co-application mitigated the stimulation of organic amendments on soil respiration by decreasing microbial activities in an infertile soil. Biol Fertil Soils. 2021;57(6):793–807.
- Ghidotti M, Fabbri D, Hornung A. Profiles of volatile organic compounds in biochar: insights into process conditions and quality assessment. ACS Sustain Chem Eng. 2016;5:510–517.
- Lyu H, He Y, Tang J, et al. Effect of pyrolysis temperature on potential toxicity of biochar if applied to the environment. Environ Pollut. 2016;218:1–7.
- Zhou S, Kong F, Lu L, et al. Biochar – an effective additive for improving quality and reducing ecological risk of compost: a global meta-analysis. Sci Total Environ. 2022;806:151439.
- Piippo S, Lauronen M, Postila H. Greenhouse gas emissions from different sewage sludge treatment methods in north. J Cleaner Prod. 2018;177:483–492.
- Chen H, Awasthi SK, Liu T, et al. Effects of microbial culture and chicken manure biochar on compost maturity and greenhouse gas emissions during chicken manure composting. J Hazard Mater. 2020;389:121908.
- Wu X, Ren L, Luo L, et al. Bacterial and fungal community dynamics and shaping factors during agricultural waste composting with zeolite and biochar addition. Sustainability. 2020b;12:7082.
- Wu X, Ren L, Zhang J, et al. Effects of zeolite and biochar addition on ammonia-oxidizing bacteria and ammonia-oxidizing Archaea communities during agricultural waste composting. Sustainability. 2020c;12(16):6336.
- Yin Y, Yang C, Li M, et al. Research progress and prospects for using biochar to mitigate greenhouse gas emissions during composting: a review. Sci Total Environ. 2021;798:149294.
- Liu N, Zhou JL, Han LJ, et al. Role and multi-scale characterization of bamboo biochar during poultry manure aerobic composting. Bioresour Technol. 2017;241:190–199.
- Zhang L, Sun X. Changes in physical: chemical, and microbiological properties during the two−stage co-composting of green waste with spent mushroom compost and biochar. Bioresour Technol. 2014;171:274–284.
- Li Y, Ma J, Yong X, et al. Effect of biochar combined with a biotrickling filter on deodorization: nitrogen retention, and microbial community succession during chicken manure composting. Bioresour Technol. 2022;343:26137.
- Godlewska P, Schmidt HP, Ok YS, et al. Biochar for composting improvement and contaminants reduction: a review. Bioresour Technol. 2017;246:193–202.
- Guo X, Liu H, Zhang J. The role of biochar in organic waste composting and soil improvement: a review. Waste Manage. 2020;102:884–899.
- Gustavo Adolfo GF, Wolf-Anno B, Martin R, et al. Co-composting of biochar and nitrogen-poor organic residues: Nitrogen losses and fate of polycyclic aromatic hydrocarbons. Waste Management. 2022;143:84–94. https://doi.org/10.1016/j.wasman.2022.02.025.
- Wang Q, Awasthi MK, Ren X, et al. Combining biochar: zeolite, and wood vinegar for composting of pig manure: the effect on greenhouse gas emission and nitrogen conservation. Waste Manage. 2018;74:221–230.
- Milon AR, Chang SW, Ravindran B. Biochar amended compost maturity evaluation using commercial vegetable crops seedlings through phytotoxicity germination bioassay. J King Saud Univ–Sci. 2022;34:101770.
- Sanchez-Monedero MA, Cayuela ML, Roig A, et al. Role of biochar as an additive in organic waste composting. Bioresource Technol. 2018;247:1155–1164.
- Wu H, Lai C, Zeng G, et al. The interactions of composting and biochar and their implications for soil amendment and pollution remediation: a review. Critical Rev Biotechnol. 2017;37(6):754–764.
- Wang N, Ren L, Zhang J, et al. Activities of functional enzymes involved in C, N, and P conversion and their stoichiometry during agricultural waste composting with biochar and biogas residue amendments. Bioresour Technol. 2022;345:126489.
- Cui H, Ou Y, Wang L, et al. Critical passivation mechanisms on heavy metals during aerobic composting with different grain-size zeolite. J Hazard Mater. 2021;406:124313.
- Purakayastha TJ, Kumari S, Pathak H. Characterisation: stability, and microbial effects of four biochars produced from crop residues. Geoderma. 2015;239:293–303.
- Sandhu OS, Jat ML, Gupta RK, et al. Influence of residue type and method of placement on dynamics of decomposition and nitrogen release in maize-wheat-mung bean cropping on permanent raised beds: a litterbag study. Sustainability. 2022;14(2):864.
- Dhaliwal HS, Brar YS, Brar GS. Evaluation of pollutants emitted from open field crop residue burning in Punjab, India. In: Kumar R, Pandey AK, Sharma RK, et al, editors. Recent trends in thermal engineering. Singapore: Springer; 2022. p. 203–211.
- Kaushal LA, Prashar A. Agricultural crop residue burning and its environmental impacts and potential causes – case of northwest India. J Environ Plan Manage. 2021;64(3):464–484.
- Anand A, Kumar V, Kaushal P. Biochar and its twin benefits: crop residue management and climate change mitigation in India. Renew Sust Energ Rev. 2022;156:111959.
- Yin J, Zhao L, Xu X, et al. Evaluation of long-term carbon sequestration of biochar in soil with biogeochemical field model. Science Total Environ. 2022;822:153576.
- Muche M, Molla E, Mohammed S, et al. Evaluating slow pyrolysis of Parthenium hysterophorus biochar: perspectives to acidic soil amelioration and growth of selected wheat (Triticum aestivum) varieties. The Scientific World J. 2022. DOI:10.1155/2022/8181742
- Ravindran B, Awasthi MK, Karmegam N, et al. Co-composting of food waste and swine manure augmenting biochar and salts: nutrient dynamics: gaseous emissions, and microbial activity. Bioresour Technol. 2022;344:126300.
- Novak JM, Ippolito JA, Watts DW, et al. Biochar compost blends facilitate switchgrass growth in mine soils by reducing Cd and Zn bioavailability. Biochar. 2019;1:97–114.
- Seyedsadr S, Šípek V, Jačka L, et al. Biochar considerably increases the easily available water and nutrient content in low-organic soils amended with compost and manure. Chemosphere. 2022;293:133586.
- Jeffery S, Abalos D, Spokas KA, et al. Biochar effects on crop yield. In: Lehmann J, Joseph S, editors. Biochar for environmental management. London: Routledge; 2015. p. 333–358.
- Hwang HY, Kim SH, Shim J, et al. Composting process and gas emissions during food waste composting under the effect of different additives. Sustainability. 2020;12(18):7811.
- Felber R, Leifeld J, Horák J, et al. Nitrous oxide emission reduction with green-waste biochar: comparison of laboratory and field experiments. Eur J Soil Sci. 2014;65(1):128–138.
- Teodoro M, Trakal L, Gallagher BN, et al. Application of co-composted biochar significantly improved plant-growth relevant physical/chemical properties of a metal contaminated soil. Chemosphere. 2020;242:125255.
- Duan Y, Yang J, Guo Y, et al. Pollution control in biochar-driven clean composting: emphasize on heavy metal passivation and gaseous emissions mitigation. J Hazard Mater. 2021;420:126635.
- Huang F, Gao LY, Wu RR. Qualitative and quantitative characterization of adsorption mechanisms for Cd2+ by silicon-rich biochar. Sci Total Environ. 2020;731:139163.
- Antonangelo JA, Sun X, Zhang H. The roles of co-composted biochar (COMBI) in improving soil quality: crop productivity, and toxic metal amelioration. J Environ Manage. 2021;277:111443.
- Sharma A, Sharma R, Arora A, et al. Insights into rapid composting of paddy straw augmented with efficient microorganism consortium. Int J Recy Org Waste Agric. 2014;3(2):54.
- Soil Survey Staff. Keys to soil taxonomy. 12th ed. Washington (DC): USDA-Natural Resources Conservation Service; 2014.
- R Core Team. R: a language and environment for statistical computing. Vienna: R Foundation for Statistical Computing; 2017. https://www.R project.org/
- Karim AA, Kumar M, Mohapatra S, et al. Nutrient rich biomass and effluent sludge wastes co-utilization for production of biochar fertilizer through different thermal treatments. J Clean Prod. 2019;228:570–579.
- Bera T, Purakayastha TJ, Patra AK, et al. Comparative analysis of physicochemical, nutrient, and spectral properties of agricultural residue biochars as influenced by pyrolysis temperatures. J Mat Cycles Waste Manage. 2017;20(2):1115–1127.
- Ippolito JA, Cui L, Kammann C, et al. Feedstock choice: pyrolysis temperature and type influence biochar characteristics: a comprehensive meta-data analysis review. Biochar. 2020;2:421–438.
- Antal J, Grønli M. The art: science, and technology of charcoal production. Ind Eng Chem Res. 2003;42:1619–1640.
- Das SK, Ghosh GK, Avasthe RK, et al. Compositional heterogeneity of different biochar: effect of pyrolysis temperature and feedstocks. J Environ Manage. 2021;278:111501.
- Tomczyk A, Sokołowska Z, Boguta P. Biochar physicochemical properties: pyrolysis temperature and feedstock kind effects. Rev Environ Sci Biotechnol. 2020;19(1):191–215.
- Nair VD, Ramachandran Nair PK, Dari B, et al. Biochar in the agroecosystem-climate-change-sustainability nexus. Front Plant Sci. 2017;8:2051.
- Bera T, Purakayastha TJ, Patra AK, et al. Comparative analysis of physicochemical: nutrient, and spectral properties of agricultural residue biochars as influenced by pyrolysis temperatures. J Mat Cycles Waste Manage. 2018;20(2):1115–1127.
- Aller MF. Biochar properties: transport: fate, and impact. Crit Rev Environ Sci Technol. 2016;46(14-15):1183–1296.
- Shi J, Fan X, Tsang DCW, et al. Removal of lead by rice husk biochars produced at different temperatures and implications for their environmental utilizations. Chemosphere. 2019;235:825–831.
- Singh B, Camps-Arbestain M, Lehmann J. Biochar: a guide to analytical methods. Clayton South, VIC, Australia: CSIRO Publishing; 2017.
- Singh B, Raven MD. 21 X-ray diffraction analysis of biochar. In: Singh B, Camps-Arbestain M, Lehmann J, editors. Biochar: a guide to analytical method. Clayton South, VIC, Australia: CSIRO Publishing; 2017. p. 245.
- Limwikran T, Kheoruenromne I, Suddhiprakarn A, et al. Most plant nutrient elements are retained by biochar in soil. Soil Syst. 2019;3(4):75.
- Yuan JH, Xu RK, Zhang H. The forms of alkalis in the biochar produced from crop residues at different temperatures. Bioresour Technol. 2011;102(3):3488–3497.
- Sarmah AK, Srinivasan P, Smernik RJ, et al. Retention capacity of biochar-amended New Zealand dairy farm soil for an estrogenic steroid hormone and its primary metabolite. Soil Res. 2010;48(7):648–658.
- Smidt E, Meissl K, Tintner J. Investigation of 15-year-old municipal solid waste deposit profiles by means of FTIR spectroscopy and thermal analysis. J Environ Monitor. 2007;9(12):1387–1393.
- Keiluweit M, Nico S, Johnson MG, et al. Dynamic molecular structure of plant biomass-derived black carbon (biochar). Environ Sci Technol. 2010;44(4):1247–1253.
- Fidel RB, Laird DA, Thompson ML. Evaluation of modified Boehm titration methods for use with biochars. J Environ Qual. 2013;42(6):1771–1778.
- Zhao SX, Na T, Wang XD. Effect of temperature on the structural and physicochemical properties of biochar with apple tree branches as feedstock material. Energies. 2017;10:1293.
- Khan N, Clark I, Sánchez-Monedero MA, et al. Physical and chemical properties of biochars co-composted with biowastes and incubated with a chicken litter compost. Chemosphere. 2016;142:14–23.
- Mujtaba G, Hayat R, Hussain Q, et al. Physio-chemical characterization of biochar: compost and co-composted biochar derived from green waste. Sustainability. 2021;13(9):4628.
- Qiu J, He J, Liu Q, et al. Effects of conditioners on sulphonamides degradation during the aerobic composting of animal manures. Procedia Environ Sci. 2013;16:17–24.
- Jindo K, Sonoki T, Matsumoto K, et al. Influence of biochar addition on the humic substances of composting manures. Waste Manage. 2016;49:545–552.
- Berek AK, Hue NV, Radovich TJ, et al. Biochars improve nutrient phyto-availability of Hawai’i’s highly weathered soils. Agron. 2018;8(10):203.
- Houssou AA, Jeyakumar P, Niazi NK, et al. Biochar and soil properties limit the phytoavailability of lead and cadmium by Brassica chinensis L. in contaminated soils. Biochar. 2022;4. DOI:10.1007/s42773-021-00126-x
- Yuan JH, Xu RK. The amelioration effects of low temperature biochar generated from nine crop residues on an acidic Ultisol. Soil Use Manage. 2011;27(1):110–115.
- Shetty R, Prakash NB. Effect of different biochars on acid soil and growth parameters of rice plants under aluminium toxicity. Sci Reports. 2020;10:12249.
- Shi RY, Ni N, Nkoh JN, et al. Biochar retards Al toxicity to maize (Zea mays L.) during soil acidification: the effects and mechanisms. Sci Total Environ. 2020;719:137448.
- Figueredo NAD, Costa LMD, Melo LCA, et al. Characterization of biochars from different sources and evaluation of release of nutrients and contaminants. Rev Ciên Agron. 2017;48(3):3–403.
- Subedi R, Bertora C, Zavattaro L, et al. Crop response to soils amended with biochar: expected benefits and unintended risks. Ital J Agron. 2017;12:161–173.
- Smith JL, Collins HP, Bailey VL. The effect of young biochar on soil respiration. Soil Biol Biochem. 2010;42(12):2345–2347.
- Farrell M, Kuhn TK, Macdonald LM, et al. Microbial utilisation of biochar-derived carbon. Sci Total Environ. 2013;465:288–297.
- Liao X, Kang H, Haidar G, et al. The impact of biochar on the activities of soil nutrients acquisition enzymes is potentially controlled by the pyrolysis temperature: a meta-analysis. Geoderma. 2022;411:115692.
- Lopes EMG, Reis MM, Frazão LA, et al. Biochar increases enzyme activity and total microbial quality of soil grown with sugarcane. Environ Technol Innov. 2021;21:101270.
- Bera T, Vardanyan L, Inglett KS, et al. Influence of select bioenergy by-products on soil carbon and microbial activity: a laboratory study. Sci Total Environ. 2019;653:1354–1363.
- Amoah-Antwi C, Kwiatkowska-Malina J, Thornton SF, et al. Restoration of soil quality using biochar and brown coal waste: a review. Sci Total Environ. 2020;722:137852.