
 ?Mathematical formulae have been encoded as MathML and are displayed in this HTML version using MathJax in order to improve their display. Uncheck the box to turn MathJax off. This feature requires Javascript. Click on a formula to zoom.
ABSTRACT
Removal of dissolved zinc (Zn) from water by a novel alkali-activated material (AAM) prepared from steel industry slags in a fixed-bed column was investigated. Design of experiments was used to find the optimum operation parameters [flow rate , adsorbent mass, (
), and initial Zn concentration (
)] for the removal of Zn2+ from a ZnCl2 solution. Regression models for the breakthrough (
), and saturation (
) capacities of the bed and three other response parameters as functions of
,
and
were fitted with coefficients of determination (
) ranging from 0.48 to 0.99. Experimental values of
and
varied within 1.42–7.03 mg Zn/g and 10.57–17.25 mg Zn/g, respectively. The optimum operation parameters were determined to be
1.64 ml/min and
4.5 g, whereas
had negligible effect on the response parameters in the range 73–107 mg Zn/l. Finally, three empirical breakthrough curve (BTC) models were employed to describe the individual BTCs of which the modified dose – response model was found to give the best fit (0.960
0.998). The results of the present work demonstrate that the novel AAM has considerable potential to be utilized in water purification applications.
GRAPHICAL ABSTRACT
1. Introduction
Huge amounts of side streams with limited utilization possibilities are produced in industrial processes worldwide. Given that the utilization of side streams is environmentally and economically beneficial, considerable interest in finding novel applications for these materials has emerged. In addition to solid side streams, large amounts of heavy-metal-containing wastewaters are produced in industrial facilities. Zinc (Zn) is one of the divalent heavy metals for which the U.S. Environmental Protection Agency has set the tolerable amount in drinking water to 5 mg/l [Citation1].
Adsorption experiments are often performed in batch mode. However, in many water purification applications, it is desirable to run the process in a continuous mode to achieve a steady flow of the effluent [Citation2,Citation3]. To design and implement such processes, knowledge on the impurity concentration at the outlet as a function of operation time is needed. This time dependency is affected mainly by advection, axial dispersion, and by the rates of the various mass transfer phenomena taking place at the solid–liquid interface [Citation4,Citation5].
The necessary information may be obtained from a breakthrough curve (BTC). A BTC illustrates the ratio of the impurity concentration in the effluent to the impurity concentration in the feed () as a function of time or treated volume. The shape of the BTC is determined by the concentration profile in the mass transfer zone (MTZ), which moves across the bed as the bed becomes increasingly saturated [Citation6].
Accurate models for BTCs have been constructed by the application of suitable artificial intelligence techniques [Citation7,Citation8] and numerical procedures [Citation9]. However, the convergence problems of numerical procedures due to poor initialization and strong dependence of artificial intelligence models on the experimental data are the main challenges of these methods. Therefore, many attempts have been made to create simplified models that could reproduce or even predict BTCs [Citation10–18]. Unsurprisingly, all these models are strictly empirical even though they have some foundations in the differential mass balance written for a horizontal cross section of the bed. More comprehensive discussion on fixed-bed adsorption processes and their modelling can be found elsewhere [Citation4–6,Citation10].
Blast furnace slag (BFS) and ladle furnace slag (LFS) are side streams of the steel industry. Both BFS and LFS contain mainly oxides of Ca, Si, Mg and Al [Citation19,Citation20]. A widely used modification method for these materials is alkali activation, in which the raw materials are treated with concentrated hydroxide and/or silicate solutions [Citation21,Citation22]. The resulting alkali-activated materials (AAMs) are usually amorphous, but their structure is influenced greatly by the Ca content of the material [Citation22]. AAMs are potential sorbents for water purification applications since they typically have high specific surface areas and possess a high number of ion exchange sites [Citation22].
The application of activated carbon and biochar for heavy metal removal from water has been studied rather extensively, while AAMs have received less attention [Citation23–29]. A quite recent review by Luukkonen et al. [Citation22] contains a summary of studies on the application of AAMs in water treatment.
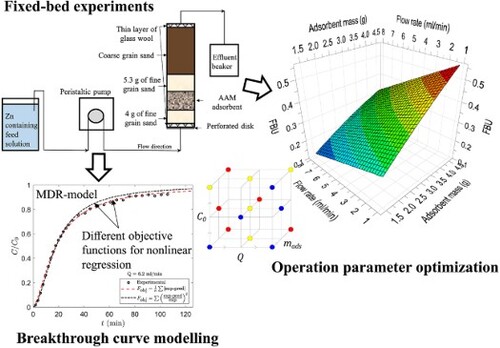
In the present paper, we report the utilization potential of a novel AAM prepared from steel slags in the removal of Zn from wastewater in the fixed-bed operation mode. Specifically, a central composite circumscribed (CCC) design [Citation30] has been applied to enable the modelling of five responses measuring the efficiency of the process with simple regression equations which allowed the optimization of the operation parameters. The solid materials have been characterized with several methods to aid the interpretation of the obtained results. Additionally, we report the modelling of the BTCs by simple two-parameter equations. The applicability of the modified dose–response (MDR) equation, the logistic equation and a somewhat less known equation by Chu [Citation4] to modelling the BTCs of the process has been investigated. The results of the present study are of use in estimating the capabilities of steel slag based AAMs in the removal of dissolved zinc from wastewater.
2. Materials and methods
2.1. Materials
The following commercial chemicals were used without further purification: sodium hydroxide (NaOH, VWR), sodium silicate solution (7.5–8.5% Na₂O; 25.5–28.5% SiO₂, Merck), glacial acetic acid (CH3COOH, VWR), zinc chloride (ZnCl2, Merck), silicon dioxide (SiO2, Merck). BFS and LFS (Particle size < 1 mm) were obtained from a European steel producer. Red granite (coarse sand) was purchased from Finnsementti and was washed first with 1% hydrochloric acid (HCl) for 24 h followed by washing with deionized water until neutral. The usage of the above materials has been specified in the following sections.
2.2. Adsorbent preparation and characterization
The general procedure for the preparation of the AAM followed that described in an earlier work of our group [Citation31] but with some notable modifications. Equal amounts of BFS and LFS were added to a solution containing 10 M NaOH and sodium silicate solution in 1:1 mass ratio [Citation31]. The solution was stirred for 24 h and stored in a fridge. The mixing ratio by mass was 1:1:1.332 (BFS:LFS:alkaline solution). The mixture was stirred for 10 min at 500 rpm and was then cast into moulds. The AAM was cured in a fume hood for three days, crushed in a benchtop jaw-crusher and passed through a sieve set. The particle diameter in the utilized fraction was 0.125–0.500 mm. The ground AAM was washed with 0.1 M acetic acid in plastic buckets. Ca. 0.017 mol acid was used per 1 g of AAM. The contents were stirred for 24 h and the solution was decanted. The AAM was washed with deionized water until the solution was neutral, and dried overnight at 90°C. The weight loss caused by the washing procedure was ca. 48%.
The details of the used characterization methods can be found in the electronic supplementary information (ESI) and only a summary of the methods is presented here. The specific surface areas (SSA), pore volumes (PV) and pore size distributions (PSD) of the starting materials and those of the AAM were determined with a physisorption instrument using nitrogen gas. The elemental compositions of the samples were determined by X-ray fluorescence spectrometry. The infrared (IR) absorption spectra and X-ray diffraction (XRD) patterns of the samples were also recorded, and can be found in the ESI.
2.3. Experimental design of column experiments
A 23 CCC design with 8 factorial points, 6 star points and 4 centre points was applied to optimize the operation parameters. The CCC design is a special case of the central composite design, in which the star points are located a distance away from the design centre, where
is the total number of factorial experiments (
8 in our case) [Citation30]. This selection of
makes the design rotatable, which implies that the variance of the predicted response is constant for all points that are the same distance from the design centre [Citation30]. MODDE 7.1 software was used to construct the experimental design and to analyse the results [Citation32]. The operational factors were flow rate (
), adsorbent mass (
) and initial Zn concentration (
) and five levels were assigned to each factor (). The response parameters are defined in detail in the following section. The coefficient of determination
and the
value were used as measures of the quality of fit. The
is a somewhat similar quantity as
but gives indication of how well the model can predict observations which have not been used in the parameterization. This quantity is calculated as:
(1)
(1) where
is the prediction error sum of squares and
is the total sum of squares of the response corrected for the mean [Citation30].
Table 1. The operational factors and their levels.
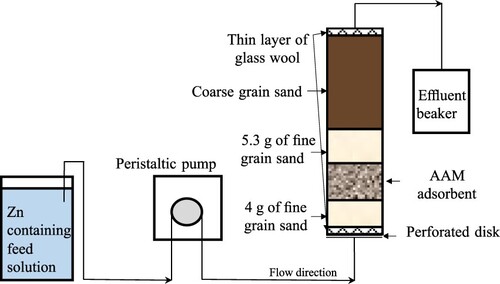
The column was a 15 cm long plastic tube with an internal diameter of 2 cm (). The unit was operated in an up-flow mode using a Watson–Marlow 120S/DV peristaltic pump. The layers were packed on a perforated disk. The fine sand was analytical grade SiO2 and coarse sand (red granite) was used to fill the column. An aliquot from the ZnCl2 stock solution was diluted with deionized water to produce a feed solution of the desired Zn concentration. The temperature of the feed solution was within 17–20°C. Effluent samples (5 ml) were taken in suitable time intervals, their pH was recorded, and the Zn concentration was measured using flame atomic absorption spectrophotometry (Varian 240FS, Mulgrave, Victoria, Australia).
Figure 1. Illustration of the experimental setup.
2.4. Response parameters
Several quantities describing column performance can be calculated from the BTC data. One such property is the adsorption capacity of the bed () which can be calculated from the area limited by the BTC and the horizontal line
1 by integrating the curve with appropriate limits. The quantity
(mg/g) corresponds to the amount of Zn adsorbed per gram of adsorbent until the saturation time
. The saturation point was arbitrarily defined to be the point on the curve at which
0.9. The bed capacity at this point is given by
(2)
(2) where
is the Zn concentration in the feed (mg/l),
is the volumetric flow rate (ml/min) and
is the adsorbent mass (g) [Citation6]. The capacity for any other time interval can be calculated by changing the limits of the integral in Equation (2). A
value of 0.05 was arbitrarily selected to define the breakthrough point.
Other quantities that have been used to evaluate the efficiency of the process, are the fractional bed utilization (FBU), efficiency of the adsorption process (EAP) (%) and length of the mass transfer zone (cm), and are defined by Equations (3)–(5), respectively [Citation3,Citation33,Citation34].
(3)
(3)
(4)
(4)
(5)
(5) where
is the bed height (cm) and the term
is a symmetry parameter [Citation34].
2.5. Breakthrough curve modelling
2.5.1. Logistic model
The logistic equation is perhaps the most widely used model to describe the BTCs of fixed-bed systems [Citation11]. The model equation and its linearized form are given by:
(6)
(6)
(7)
(7) where
and
are empirical parameters. The simplicity of the equation probably explains its popularity. It should be noted that three commonly used empirical BTC models: the (overly) simplified Thomas model, the Bohart–Adams model and the Yoon–Nelson model, are mathematically equivalent to Equation (6) [Citation35].
2.5.2. Modified dose–response model
The modified dose–response (MDR) model developed by Yan et al. [Citation12] is another empirical BTC model. It was developed with the aim to account for the physical limitations of a real fixed-bed system better than the logistic equation. The model equation is given by:
(8)
(8)
where and
(l) are empirical model parameters. EquationEq. (8
(8)
(8) ) can be rearranged to a linear form:
(9)
(9)
2.5.3. Model of Chu
Chu has described yet another empirical BTC model [Citation4]. He modified the equation proposed by Belter et al. [Citation36] to account for possible asymmetry in BTCs. Since the BTCs in this work generally showed a broad trailing edge, the following equation from Chu’s paper was adopted:
(10)
(10) where
and
(min) are adjustable parameters and
is the error function.
(11)
(11)
2.5.4. Fitting methods
The logistic and MDR models were fitted to the experimental data using both linear and nonlinear regression. With Equation (10), only nonlinear regression was used. The timestamp (min) for each datapoint was calculated according to the formula:
(12)
(12) where
is the time when the sample collection was started,
(min) is the duration of the sampling and
(min) is the time when the first drop of treated effluent appeared at the end of the downstream tube.
Model fitting was conducted in MATLAB® [Citation37]. The experimental values were calculated utilizing MATLAB’s trapezoidal integration function. An algorithm called simulated annealing was applied in the nonlinear regression. Details of the algorithm can be found elsewhere [Citation38,Citation39]. Two differently weighed objective functions were applied to demonstrate the possibility of improving the fit quality in certain regions of the BTC:
(13)
(13)
(14)
(14) where
is the number of experimental datapoints,
is the experimental value, and
is the value predicted by the model.
3. Results and discussion
3.1. Characterization results
The results of the SSA, PV and PSD analyses are summarized in . It is apparent that the acid wash dramatically increased the SSA. PV also increased, but no significant change was observed in the PSD. The small SSA of the unwashed AAM was attributed to the absorption of atmospheric CO2 to the highly alkaline mixture used in the AAM preparation. This conclusion was supported by the disappearance of the intense IR adsorption band at 1400–1500 cm−1 following the acid wash (Figure S1.1). The energy of this band corresponds rather closely to the energy of the asymmetric stretching vibration of a carbonate () group [Citation40–42]. Also, elemental analysis revealed that unwashed AAM contained ca. 8.7 wt-% of carbon calculated as CO2, but the acid wash reduced this quantity to ca. 1.1 wt-% (Table S1.1). Moreover, a significant amount of Ca was dissolved during the acid wash.
Table 2. Results of the SSA, PV and PSD analyses. See ESI for a description of the analyses.
The IR spectra of the samples obtained from different stages of AAM preparation and usage can be found in the ESI (Figure S1.1). In addition to the carbonate band, other notable peaks were identified. In all samples, an intense band near 1000 cm−1 was observed. This peak was attributed to the asymmetric stretching vibrations of the Si–O bonds [Citation40,Citation43,Citation44]. Ortego et al. [Citation43] have observed that increased polymerization of silicate units leads to the shifting of this peak to higher energy. Our data shows signs of such behaviour, as the LFS and BFS showed intense peaks centred at ca. 800 and 900 cm−1, respectively, whereas the AAM showed peaks centred at 978 and 1007 cm−1 before and after the acid wash. However, the broad 800 cm−1 peak of the LFS may also be due to a Si–O–Al vibration [Citation44]. The peaks at ca. 1650 cm−1 were ascribed to adsorbed H2O [Citation41,Citation44]. The broad adsorption band centred at ca. 3400 cm−1 was attributed to adsorbed H2O and surface OH groups [Citation40,Citation44]. Clear evidence of Zn uptake was observed in both the XRF and XRD data for the samples taken from the column experiments (Figure S1.2).
3.2. Optimization results
presents the experimental design and the observed response values. The realized factor values differed from the design values to some extent. The mean absolute difference [Eq. (15)] between the targeted () and measured (
) operation factor value was 2.3 mg/l for
, 0.29 ml/min for
and 0.015 g for
(The measured factor values for the individual experiments can be found in the ESI).
(15)
(15)
Table 3. The experimental design and the observed response values. The experiments were performed in the order given in the second column.
Regression models for the five responses were fitted using multiple linear regression. All regressions were significant at the 95% confidence level ( 0.05, see .). Terms with statistically insignificant (zero) coefficients at the 95% confidence level were generally excluded from the models.
Table 4. Summary of fit for the five studied responses.
However, in the case of FBU and the nonsignificant
term was retained in the model to preserve model hierarchy, as the interaction term
was significant for these responses. A summary of fit for the five responses is shown in and analysis of variance (ANOVA) tables for each response can be found in the ESI (Tables S1.3–S1.7).
The P-values for the lack of fit tests (>0.05) indicated that the variance in the data could be explained by the models within the limits of the experimental uncertainty. The fit quality for FBU was excellent, as indicated by the high and
values. The strong effect of the factors on the FBU is most likely a consequence of the fact that it is calculated by dividing two quantities, both of which show dependency on the factors.
On the contrary, alone was not affected that much by the factors in the studied design space and the fit to the data was poor (
0.483). Thus, no detailed analysis was conducted for
. Obviously, the bed capacity is affected less by the conditions as complete saturation is neared. Thus, the smaller effect of operation conditions on
than on
could be expected.
The observed versus predicted response plots, the normal probability plots of the residuals and the scaled and centred model coefficients can be found in the ESI. The model equations with unscaled coefficients, that is, in terms of the original units of the factors, are as follows:
(16)
(16)
(17)
(17)
(18)
(18)
(19)
(19) where
is expressed in g,
in mg/l and
in ml/min. It should be noted that Equations (16)–(19) are purely empirical and only applicable to the column setup used in this study. Also, their validity is limited to the factor ranges covered in the experiments. shows the effects of individual factors to the responses according to Equations (16)–(19) when other factors are held at their centre point values.
Figure 2. The effects of factors to the responses according to Equations (16)–(19). The limits of the 95% confidence intervals are indicated by the curves with red dots.
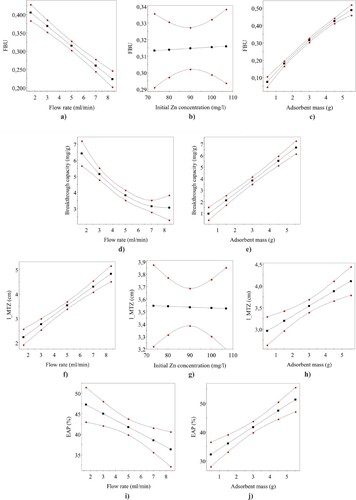
3.2.1. Effect of adsorbent mass (bed height)
shows that had a positive effect on all responses. In the case of FBU,
and EAP, this effect is obvious given that the longer the bed the longer the residence time. As shown in h,
also increases with increasing
. This behaviour can be explained by the asymmetric nature of the observed BTCs. As shown in , the trailing edge becomes broader with increasing
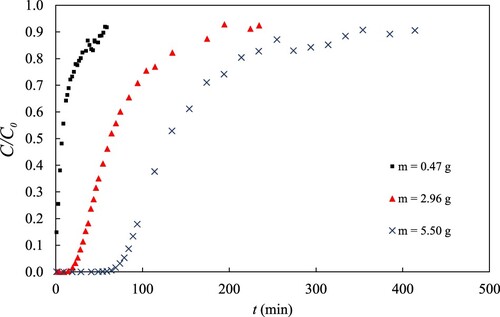
. It seems, that with longer beds, the MTZ could ‘stretch’ more before saturation was reached.
Figure 3. Experimental BTCs from experiments 13, 14 and 18 with differing bed heights () other conditions being the same.
90 mg/l and
5 ml/min. Effluent pH 4.9–5.5.
3.2.2. Effect of flow rate
As can be seen in a, d and i, flow rate exerted a negative effect on FBU, and EAP, which can be readily explained by the shorter residence time with higher flow rate. The positive effect of
on
(f) is also intuitive.
The interaction term was significant for FBU. This means that the negative effect of
becomes more pronounced as
increases. Since
determines the rate at which the MTZ stretches, the correlation between
and
discussed above becomes steeper with higher
, which is reflected also to the value of FBU. In this case, the interaction term
should be significant and positive for
, which was not observed. It is possible that this effect could not be resolved from the greater uncertainty associated with the
. Nevertheless, the P-value for the
coefficient (0.0323) for FBU was only slightly lower than 0.05. Thus, not much emphasis should be placed on the interpretation of this term.
3.2.3. Effect of initial Zn concentration
The effect of was practically negligible in the studied concentration range. As can be seen in b and g, straight lines with zero slopes would be within the confidence limits indicated in the figures.
However, the interaction term was observed to be significant and negative for FBU. Thus, the higher the
, the more negative is the slope of the FBU versus
plot. Therefore, it would seem reasonable to suggest that the lengthening of the MTZ as a function of
is more rapid with higher
. The term
was indeed significant and positive for
, consistent with the above statement.
3.3. Breakthrough curve modelling results
The three models described in section 2.5 were fitted to the experimental BTC data. To give an example, the data for experiment 18 has been plotted in . Similar plots for every experiment can be found in the ESI.
Figure 4. The BTC from experiment 18 and the curves fitted with the logistic, MDR, and Chu models. Equation (13) has been used as the objective function in nonlinear regression. 5 ml/min,
90 mg/l and effluent pH
5.2.
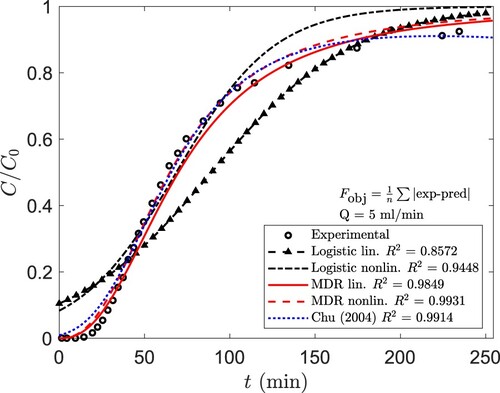
3.3.1. Model evaluation
Both MDR (Equation [8]) and Chu models (Equation [10]) generally resulted in much better fits than the logistic model (Equation [6]). Significantly higher and lower
values were obtained using the former models. The
values for the MDR and the logistic models ranged within 0.960–0.998 and 0.726–0.963, respectively. In the case of the Chu model, no reasonable fit was obtained for the data of experiment 13, in which breakthrough occurred almost instantly, but for all other experimental datasets, the
values were within 0.942–0.995.
The main reason behind the poor behaviour of the logistic equation was the asymmetric nature of the experimental BTCs. This behaviour was better modelled by the more flexible MDR and Chu equations than by the symmetric logistic equation. Another shortcoming of the logistic model is that the limit of Equation (6) as , is
, which is physically unrealistic. This limit can only approach zero if the constant
is large.
Higher and lower
values were usually obtained with the MDR model than with Equation (10), although the difference was often marginal. However, the function defined by Equation (10) does not increase monotonously, and decreasing behaviour was observed in some cases, when fitting the equation to experimental data. This is physically unrealistic, of course.
The above considerations led us to conclude that for our system, the MDR model was the most appropriate of the three models tested. It must be emphasized that the models used in this work are purely empirical. Thus, detailed statements about the nature of the mass transfer phenomena or their kinetics cannot be made. However, the described modelling strategy is quick, cost-efficient and requires no in-depth knowledge of the system.
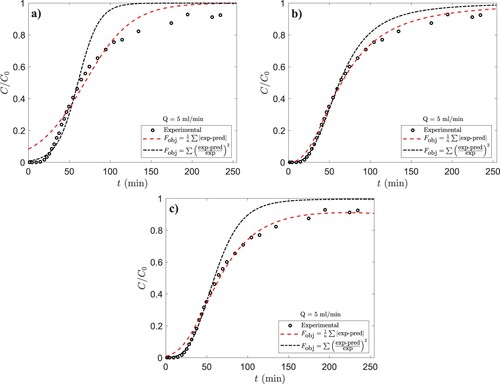
3.3.2. Choice of the objective function
shows the three models fitted to the data of a single experiment using the two differently weighed objective functions, Equations (13) and (14). It is apparent, that the use of the objective function given by Equation (14) results in a superior fit quality in the initial portion of the BTC, as can be expected from its mathematical form. This of course comes with the expense of poor fit quality in the later portion of the BTC. illustrates that fit quality in a certain region may be improved by appropriate weighing of the objective function. This can be advantageous for systems for which models that adequately describe the entire operation range are unavailable.
Figure 5. Comparison of the curves fitted to the BTC data from experiment 18 using nonlinear regression with different objective functions. (a) Logistic model, (b) MDR model and (c) Chu model.
3.3.3. Prediction of bed capacities and comparison to other adsorbents
The calculated by graphically integrating the experimental BTCs ranged from 10.57 to 17.25 mg/g. The equilibrium capacity of the AAM at room temperature was estimated by carrying out preliminary batch adsorption experiments (Figure S1.5). The batch capacities in the
range 0–100 mg/l were satisfactorily predicted by the empirical Freundlich isotherm (
0.95):
(20)
(20)
where (mg/l) and
(mg/g) are the Zn concentration and adsorption capacity at equilibrium, respectively. The trend in the equilibrium pH could also be reproduced by assuming that the main source of protons was ion-exchange between Zn2+ and H+ and that this reaction constituted a constant small fraction of all ion-exchange reactions involving Zn, which followed the isotherm given by Equation (20) (Figure S1.6). The agreement of the experimental pH values with values predicted from the above considerations is at least not in conflict with the assumption that ion-exchange was taking place. Equation (20) predicts that
14.1 mg/g at
100 mg/l, which is quite close to the
values obtained in the column experiments (). The reasonably close agreement between the estimated
and
values indicate that at least nearly full saturation was achieved in the column experiments. The
and
values calculated from the fitted MDR equations, along with the experimental values, are listed in and .
Table 5. Experimental values and the values calculated from the fitted MDR equations. The type of regression is given in the column header.
Table 6. Experimental values and the values calculated from the fitted MDR equations. The type of regression is given in the column header.
shows how the saturation capacities obtained in this study compare to those of some other adsorbents reported in the literature. Since other studies reporting column saturation capacities of AAM based adsorbents for Zn were not found, we have extended the comparison to all aluminosilicate-based adsorbents as well as to some biosorbents. It should be noted that the adsorption capacities vary widely depending on the adsorbent and the conditions, and gives only a very limited view to the vast number of adsorbents that have been described in the literature. However, it is apparent that the AAM described in the present paper has an appreciable capacity towards dissolved zinc and has therefore potential to be utilized in water purification applications. Still, further research is needed to investigate the ability of the AAM to remove other contaminants, and to evaluate its suitability in treating real wastewaters.
Table 7. Comparison of the maximum experimentally obtained column saturation capacity () in this study to column capacities reported for other adsorbents.
4. Conclusions
The preparation of a novel alkali activated material (AAM) from side streams of the steel industry has been described. Furthermore, its utilization in the removal of Zn(II) from water in the fixed-bed operation mode has been investigated. Characterization revealed that during preparation, the AAM adsorbed CO2 from air which led to the formation of carbonates. Acid washing dissolved the carbonates and significantly increased the specific surface area of the AAM. Breakthrough and saturation capacities up to 7.03 and 17.25 mg Zn/g were obtained in the column experiments, respectively. A 23 central composite circumscribed design was applied to study the effects of operation parameters on the efficiency of the fixed-bed process. Regression models for five response parameters showed that the use of low flow rates and a long beds is favourable in terms of efficiency, whereas the effect of initial Zn concentration was negligible in the studied concentration range. The close agreement of the saturation capacities with the equilibrium capacity suggests that almost the full adsorption capacity of the AAM can be utilized in the column operation mode. Finally, we have shown that the breakthrough curves can be described with the modified dose–response model with appreciable accuracy. The results presented in this paper indicate that the novel AAM has considerable potential to be utilized in the treatment of zinc containing wastewaters.
Authorship contribution statement
Mikael Manninen: conceptualization and design of the study, experimental laboratory work, analysis and interpretation of the results, first draft of manuscript, visualization.
Teija Kangas: Conceptualization of the study, supervision, analysis and interpretation of the results, project administration.
Tao Hu: Analysis of the samples, interpretation of the results.
Toni Varila Analysis of the samples, interpretation of the results.
Ulla Lassi: Funding acquisition.
Hanna Runtti: Conceptualization of the study, supervision, analysis and interpretation of the results, project administration. All authors have reviewed the results and approves the final version of the manuscript.
SupplementaryMaterial.docx
Download MS Word (7.9 MB)Acknowledgements
The authors would like to thank Riina Hemmilä, Juhani Väisänen, Markus Väyrynen and Elavarasi Sundhararasu for their contribution to the laboratory work.
Disclosure statement
No potential conflict of interest was reported by the author(s).
Additional information
Funding
References
- United States Environmental Protection Agency. (2009). National Primary Drinking Water Regulation Table. 2009 [cited 2022 May 6]. Available from: https://www.epa.gov/ground-water-and-drinking-water/national-primary-drinking-water-regulation-table.
- Aguayo-Villarreal IA, Bonilla-Petriciolet A, Hernández-Montoya V, et al. Batch and column studies of Zn2+ removal from aqueous solution using chicken feathers as sorbents. Chem Eng J. 2011;167:67–76.
- de Franco MAE, de Carvalho CB, Bonetto MM, et al. Diclofenac removal from water by adsorption using activated carbon in batch mode and fixed-bed column: isotherms, thermodynamic study and breakthrough curves modeling. J Clean Prod. 2018;181:145–154.
- Chu KH. Improved fixed bed models for metal biosorption. Chem Eng J. 2004;97:233–239.
- Ruthven DM. Principles of adsorption and adsorption processes. New York: Wiley; 1984.
- Worch E. Adsorption dynamics in fixed-bed adsorbers. adsorption technology in water treatment: fundamentals, processes, and modeling. Berlin: De Gruyter; 2012; p. 169–195.
- Javad AM, Jahangir A, Mohammad JJS, et al. Modeling of fixed-Bed column system of Hg(II) ions on ostrich bone Ash/nZVI composite by artificial neural network. J Environ Eng. 2017;143:04017061.
- Gordillo-Ruíz FA, Sánchez-Ruíz FJ, Mendoza-Castillo DI, et al. Dynamic fuzzy neural network for simulating the fixed-bed adsorption of cadmium, nickel, and zinc on bone char. Int J Environ Sci Technol. 2018;15:915–926.
- Amiri MJ, Roohi R, Gil A. Numerical simulation of Cd(II) removal by ostrich bone ash supported nanoscale zero-valent iron in a fixed-bed column system: utilization of unsteady advection-dispersion-adsorption equation. Journal of Water Process Engineering. 2018;25:1–14.
- Aksu Z. Application of biosorption for the removal of organic pollutants: a review. Process Biochem. 2005;40:997–1026.
- Tan KL, Hameed BH. Insight into the adsorption kinetics models for the removal of contaminants from aqueous solutions. J Taiwan Inst Chem E. 2017;74:25–48.
- Yan G, Viraraghavan T, Chen M. A New model for heavy metal removal in a biosorption column. Adsorpt Sci Technol. 2001;19:25–43.
- Wolborska A. Adsorption on activated carbon of p-nitrophenol from aqueous solution. Water Res. 1989;23:85–91.
- Clark RM. Evaluating the cost and performance of field-scale granular activated carbon systems. Environ Sci Technol. 1987;21:573–580.
- Yoon YH, Nelson JH. Application of Gas adsorption kinetics I. A theoretical model for respirator cartridge service life. Am Ind Hyg Assoc. 1984;45:509–516.
- Thomas HC. Heterogeneous Ion exchange in a flowing system. J Am Chem Soc. 1944;66:1664–1666.
- Bohart GS, Adams EQ. Some ASPECTS OF THE BEHAVIOR OF CHARCOAL WITH RESPECT TO CHLORINE.1. J Am Chem Soc. 1920;42:523–544.
- Amiri MJ, Bahrami M, Nekouee N. Analysis of breakthrough curve performance using theoretical and empirical models: Hg2+ removal by bone char from synthetic and real water. Arab J Sci Eng. 2022.
- Bakharev T, Sanjayan JG, Cheng Y-B. Alkali activation of Australian slag cements. Cem Concr Res. 1999;29:113–120.
- Rađenović A, Malina J, Sofilić T. Characterization of ladle furnace slag from carbon steel production as a potential adsorbent. sorrell C, editor. Adv Mater Sci Eng. 2013: 198240.
- Ge Y, Cui X, Liao C, et al. Facile fabrication of green geopolymer/alginate hybrid spheres for efficient removal of Cu(II) in water: batch and column studies. Chem Eng J. 2017;311:126–198134.
- Luukkonen T, Heponiemi A, Runtti H, et al. Application of alkali-activated materials for water and wastewater treatment: a review. Rev Environ Sci Bio. 2019;18:271–297.
- Yunus ZM, Othman N, Al-Gheethi A, et al. Adsorption of heavy metals from mining effluents using honeydew peels activated carbon; isotherm, kinetic and column studies. J Dispersion Sci Technol. 2021;42:715–729.
- Zhang YP, Adi VSK, Huang H-L, et al. Adsorption of metal ions with biochars derived from biomass wastes in a fixed column: adsorption isotherm and process simulation. J Ind Eng Chem. 2019;76:240–244.
- Kavand M, Asasian N, Soleimani M, et al. Film-Pore-[Concentration-Dependent] surface diffusion model for heavy metal ions adsorption: single and multi-component systems. Process Saf Environ Prot. 2017;107:486–497.
- Hernández-Hernández LE, Bonilla-Petriciolet A, Mendoza-Castillo DI, et al. Antagonistic binary adsorption of heavy metals using stratified bone char columns. J Mol Liq. 2017;241:334–346.
- Park J-H, Cho J-S, Ok YS, et al. Competitive adsorption and selectivity sequence of heavy metals by chicken bone-derived biochar: batch and column experiment. J Environ Sci Health A. 2015;50:1194–1204.
- Yang X, Wan Y, Zheng Y, et al. Surface functional groups of carbon-based adsorbents and their roles in the removal of heavy metals from aqueous solutions: A critical review. Chem Eng J. 2019;366:608–621.
- Inyang MI, Gao B, Yao Y, et al. A review of biochar as a low-cost adsorbent for aqueous heavy metal removal. Crit Rev Environ Sci Technol. 2016;46:406–433.
- Montgomery DC. Design and analysis of experiments. 5th ed New York: John Wiley & Sons, Inc; 2001.
- Sundhararasu E, Tuomikoski S, Runtti H, et al. Alkali-Activated adsorbents from slags: column adsorption and regeneration study for nickel(II) removal. Removal. ChemEngineering. 2021;5:13.
- Modde 7.1, sartorius stedim biotech GmbH, göttingen. Göttingen: Sartorius Stedim Biotech GmbH; 2007.
- Xavier ALP, Adarme OFH, Furtado LM, et al. Modeling adsorption of copper(II), cobalt(II) and nickel(II) metal ions from aqueous solution onto a new carboxylated sugarcane bagasse. part II: optimization of monocomponent fixed-bed column adsorption. J Colloid Interf Sci. 2018;516:431–445.
- Nuić I, Trgo M, Perić J, et al. Analysis of breakthrough curves of Pb and Zn sorption from binary solutions on natural clinoptilolite. Micropor Mesopor Mat. 2013;167:55–61.
- Chu KH. Breakthrough curve analysis by simplistic models of fixed bed adsorption: In defense of the century-old bohart-adams model. Chem Eng J. 2020;380:122513.
- Belter PA, Cussler EL, Hu W-S. Bioseparations : downstream processing for biotechnology. New York: Wiley; 1988.
- MATLAB. 2021. 9.11.0.1769968 (R2021b), The MathWorks Inc., Natick, MA.
- Goffe WL, Ferrier GD, Rogers J. Global optimization of statistical functions with simulated annealing. J Econ. 1994;60:65–99.
- Corana A, Marchesi M, Martini C, et al. Minimizing multimodal functions of continuous variables with the “simulated annealing” algorithm—corrigenda for this article is available here. Algorithm. ACM Trans Math Softw. 1987;13:262–280.
- Kara İ, Yilmazer D, Akar ST. Metakaolin based geopolymer as an effective adsorbent for adsorption of zinc(II) and nickel(II) ions from aqueous solutions. Appl Clay Sci. 2017;139:54–63.
- Giannopoulou I, Panias D. Hydrolytic stability of sodium silicate gels in the presence of aluminum. J Mater Sci. 2010;45:5370–5377.
- Frost RL, Dickfos MJ. Raman and infrared spectroscopic study of the anhydrous carbonate minerals shortite and barytocalcite. Spectrochim Acta A. 2008;71:143–146.
- Ortego JD, Barroeta Y, Cartledge FK, et al. Leaching effects on silicate polymerization. An FTIR and silicon-29 NMR study of lead and zinc in Portland cement. Environ Sci Technol. 1991;25:1171–1174.
- Barbosa VFF, MacKenzie KJD, Thaumaturgo C. Synthesis and characterisation of materials based on inorganic polymers of alumina and silica: sodium polysialate polymers. Int J Inorg Mater. 2000;2:309–317.
- Punrattanasin P, Sariem P. Adsorption of copper, zinc, and nickel using loesses as adsorbents by column studies. Pol J Environ Stud. 2015;24:1267–1275.
- Nguyen TC, Loganathan P, Nguyen TV, et al. Simultaneous adsorption of Cd, Cr, Cu, Pb, and Zn by an iron-coated Australian zeolite in batch and fixed-bed column studies. Chem Eng J. 2015;270:393–404.
- Moreno-Pérez J, Bonilla-Petriciolet A, Rojas-Mayorga CK, et al. Adsorption of zinc ions on bone char using helical coil-packed bed columns and its mass transfer modeling. Desalin Water Treat. 2016;57:24200–24209.
- Meringer A, Liffourrena AS, Heredia RM, et al. Removal of copper and/or zinc ions from synthetic solutions by immobilized, non-viable bacterial biomass: batch and fixed-bed column lab-scale study. J Biotechnol. 2021;328:87–94.
- Raulino GSC, Vidal CB, Lima ACA, et al. Treatment influence on green coconut shells for removal of metal ions: pilot-scale fixed-bed column. Environ Technol. 2014;35:1711–1720.