
 ?Mathematical formulae have been encoded as MathML and are displayed in this HTML version using MathJax in order to improve their display. Uncheck the box to turn MathJax off. This feature requires Javascript. Click on a formula to zoom.
ABSTRACT
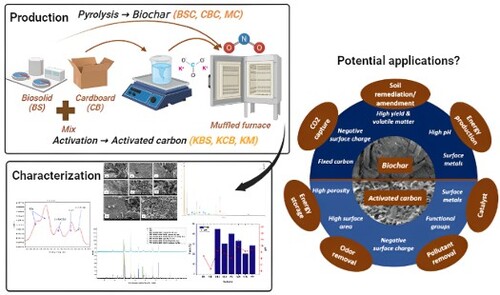
Qatar’s population has been rapidly increasing in recent years, and the country’s long-term vision, QNV 2030, aims to sustain this growth by transforming the country into a sustainable state. One aspect of this vision is to convert waste into value-added products, which will reduce the environmental and spatial burden associated with waste in Qatar, while contributing to a circular economy. This study describes methods for producing biochar and activated carbon (AC) from gas-to-liquids derived biosolids, cardboard waste and mixed samples using pyrolysis and activation techniques. The characterisation of products revealed that the yield of biochar samples was higher than AC, and that the pH of the biochar samples was more alkaline than the feed samples due to metals after pyrolysis and reduced acid surface functional groups. Proximate analysis of samples showed lowered moisture and enhanced ash in feeds upon pyrolysis and activation due to increased temperature with reduced volatile content. AC application to water treatment is considered a potential benefit due to the increased surface area, pore volume and magnetic properties based on the Brunauer–Emmett–Teller (BET) and X-ray Powder Diffraction (XRD) analysis. The X-ray photoelectron spectroscopy (XPS) analysis also showed increased –CO3/O–C = O and potassium in the ACs as a result of potassium carbonate activation. The study proposes various applications that can support a circular economy, but future studies should investigate actual applications and potential health and environmental effects and evaluate the feasibility and environmental impact of production methods.
GRAPHICAL ABSTRACT
1. Introduction
Qatar is a small Arabian Peninsula country and part of the Gulf Cooperation Council (GCC), which has seen a lot of development in recent years. It has a high GDP per capita due to its large hydrocarbon reserves, particularly natural gas, having the third largest natural reserves after Russia and Iran [Citation1,Citation2]. The population has grown quickly, from around 600,000 in 2000 to 2.8 million in 2020, with most people living in urban areas [Citation3]. In the GCC countries, natural gas accounts for 75% of electricity generation, while the remaining 25% is from crude oil [Citation4]. The export potential of hydrocarbons is expected to increase by 437 million barrels by 2025 [Citation4]. Specific to Qatar, 99% of the current electricity needs for power are met by fossil fuels [Citation5]. Qatar’s long-term vision ‘Qatar National Vision (QNV) 2030’, intends to transform the country into a sustainable and developed state that ensures a high quality of life for its citizens and future generations.
Part of this is managing a large amount of waste and wastewater from the oil and gas industry (O & G) sustainably. During the wastewater treatment process in the O & G, a significant amount of sewage sludge or biosolids (BS) is produced; usually, this waste is processed well and disposed of. However, there is an environmental risk during the process [Citation6]. Working towards the QNV2030, Qatar is also researching ways to convert wastes to value-added products such as pyrolysis and activation; this will reduce the environmental and spatial burden associated with wastes in Qatar and contribute to a circular economy [Citation3]. While pyrolysis converts waste materials into valuable products, such as carbon-rich biochars, by heating them to high temperatures (typically above 300 °C) in an inert atmosphere [Citation7], activation is done by physical or chemical means at high temperatures higher than 800 °C [Citation8]. When the feed is used directly for the activation, it is called one-step activation, and using pyrolysed feed or biochar is known as two-step activation [Citation9]. Activation is known to improve the surface area and pore volume of the samples and enhance the active sites and functionality [Citation8]. Studies have been widely focused on mixing feeds for pyrolysis, known as co-pyrolysis [Citation10]. As mentioned in the review paper by Zuhara et al.(2022a), there is research on the activation of co-pyrolysed biochar for mixed feeds. The intention of mixing is to reduce the amount of waste in the landfill or other harmful management techniques. It is crucial to understand the products from these processes with distinct physical and chemical characteristics that influence their potential end use [Citation11–14].
Therefore, this project will uniquely study gas-to-liquids (GTL)-derived biosolids and cardboard and mixing the samples in a 1:1 ratio for pyrolysis and one-step chemical activation using potassium carbonate. The following objectives are considered to study (1) proximate and ultimate analysis of the feeds: biosolids and cardboard, biochar samples (biosolids, cardboard, mixed), activated samples (biosolids, cardboard, mixed) effects on all samples’ yield, pH, surface charge, surface area, and porosity (2) effects of pyrolysis and chemical activation on the surface morphology and composition using Scanning electron microscopy (SEM) and energy dispersive X-ray spectroscopy (EDS) (SEM-EDS). (3) crystallinity and structure of the samples by X-ray Powder Diffraction (XRD) analysis (4) elemental constituents on the surface and chemical bonding state of all samples are analysed using X-ray Photoelectron Spectroscopy (XPS) or Electron Spectroscopy (5) potential of using biosolids, cardboard, and mixed samples for various applications is analysed based on the characterisation results.
2. Methodology
2.1 Pyrolysis and activation
The biosolid samples were obtained from one of the largest gas-to-liquids (GTL) plants in Qatar operated by Shell Qatar, generation 6 kilotonnes of biosolids annually and the CB waste (1-ply) was collected from a leading shopping market in Qatar. The method for pyrolysing biosolid, cardboard and mixed samples are detailed in Zuhara et al. (Citation2022). After pyrolysis, the samples were cooled and weighed to determine the yield using equation 1. For activation, feeds were sieved to ≤ 700 µm using potassium carbonate (1M) with an impregnation ratio of sample: activating agent ratio of 1:3 for all samples. Further mixing was done at 100 rpm for 24 h in an auto-shaker. To ensure complete dryness, all samples were placed in the oven at 105℃ for eight hours before further activation at 700℃ for 2 h in a muffled furnace at a heating rate of 10°C/min in an inert atmosphere. The pH-adjusted, dried samples were used for further characterisation. For this paper, the samples are labelled and presented in .
Table 1. Sample naming.
The yield is calculated using Equation 1.
(1)
(1)
Wp: Weight of product (biochar/activated carbon)
Wf: Weight of feed.
2.2 Properties analysis
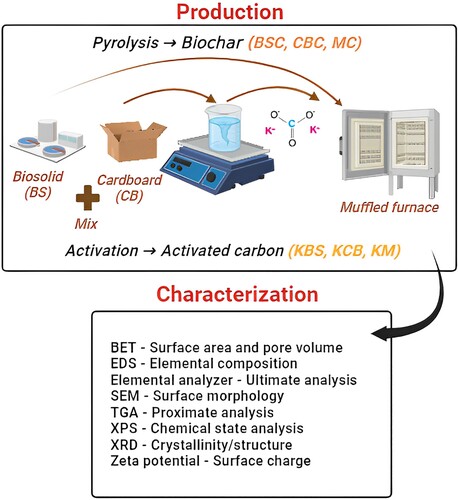
The pH, proximate, ultimate, surface charge, surface area, pore volume, SEM-EDS, and XRD analysis of the feeds, biochar and AC samples were carried out following the exact methodology detailed in [Citation6]. The XPS analysis was performed following the method described in [Citation15]. is the schematic diagram showing the method of preparation and characterisation methods for this study.
Figure 1. Schematic diagram of the methodology.
3. Results and discussion
3.1 Yield and pH of samples
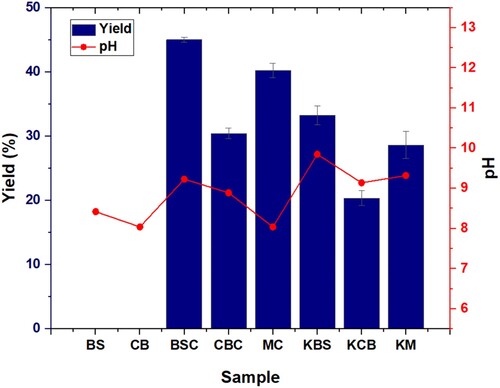
Overall, the yield of the biochar samples was higher than the AC as an increase in temperature is known to reduce the yield due to an increased loss of volatiles at higher temperatures [Citation15]. Similarly, the reduced yield for cardboard samples (biochar and AC) is also due to the enhanced devolatilisation compared to the BS and mixed samples. The yield order was the same for biochar and AC samples in the order BS > mix > CB.
shows the pH of the feed, biochar, and AC samples and the yields of the latter two samples. The pH of the feeds shows the samples are slightly alkaline, which could be due to the presence of calcium carbonate; this is evident from the XRD analysis of the sample discussed in section 3 [Citation16]. The biochar samples are more alkaline than feeds possible due to the concentration of metals after pyrolysis (EDS) and the reduced acid surface functional groups due to the decomposition of the oxygen-containing groups upon pyrolysis – this is evident in the XPS results in section 3.6 [Citation17]. As for the ACs, all samples are slightly alkaline in nature – the pH is high due to the addition of potassium carbonate, an alkaline activating agent. If required for further environmental applications, the biochar and ACs can be neutralised using acids such as hydrochloric acid [Citation18,Citation19].
Figure 2. Yield and pH comparison of samples.
3.2 Proximate and ultimate analysis
The proximate and ultimate analysis of all samples is reported in . Proximate analysis shows a lowered moisture and an enhanced ash in the feeds upon pyrolysis and activation due to increased temperature. The volatile content is also observed to have reduced due to devolatilisation at high temperatures [Citation20]. As for the ultimate analysis, the observations clearly show an increased carbon content for the biochar samples. An increase in oxygen in the AC is detected, which could indicate the increase in the oxygen-containing functional groups upon activation using potassium carbonate [Citation21]. Significant nitrogen was seen in the BS and mixed feeds.
Table 2. Proximate and ultimate analysis of samples.
3.2 Surface area, charge, and pore volume
The surface area (SA) and pore volume (PV) of the feeds are extremely low, with values less than 1.745 m2/g and 0.04 cm3/g for SA and PV, respectively, for both samples. There was only a slight increase in the measurements after pyrolysis. However, a significant increase in the SA is noticed upon activation – KBS: 156.5 m2/g, KCB:515.7 m2/g, and KM: 527.0 m2/g. The mixed sample has the highest surface area proving a synergistic effect between the feeds. Similarly, there was a substantial improvement in the pore volume as well (). When the two feeds are mixed for activation, the carbon has more extraction and demineralisation yield, resulting in increased pores after extraction and demineralisation. This could have promoted the activation reaction to obtain much cleaner activated carbon with higher BET values. The surface area of the activated samples is compared to literature-reported values of other ACs by physical and chemical methods [Citation8]. The samples are all negatively charged with slight negative changes when pyrolysed and activated.
Table 3. Surface properties of samples.
3.4. SEM and EDS analysis
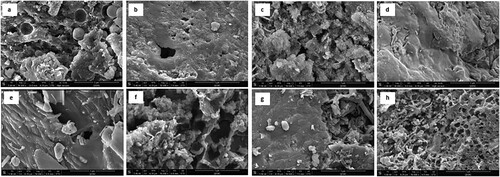
The textural properties of the feed, biochar, and ACs are shown in and Figure S1. The feeds showed how BS is flat and non-porous; given its origin, the cardboard samples are revealed to be fibrous. The ACs were filled with cavities with increased pore volumes. All three activated samples, KBS, KCB, and KM show distinct morphologies. The evaporation of the activating agent during carbonisation could have left spaces, therefore creating openings. Additionally, the reaction of potassium carbonate with carbon increased CO due to the chemical reaction between the feeds and the chemical releasing gas from the core up to the surface of the particles. Compared to this, the biochar and feed samples show little to no pores. However, the thermal treatment given to the biochar samples has led the samples to be fragmented and dispersed.
Figure 3. SEM images at 50,000 x magnifications: (a) BS (b) BSC (c) KBS (d) CB (e) CBC (f) KCB (g) MC (h) KM.
The EDS results in and Figure S2, show how the relative composition of elements varied between the samples. Overall, the BS and mixed samples contained nitrogen and sulphur, as seen in the literature on the presence of these elements from the wastewater treatment process [Citation22]. Furthermore, iron was detected in BS as an iron coagulant was used during the wastewater treatment process. The biochar samples showed an increase in the composition of elements such as sodium, magnesium, aluminium, and manganese due to the concentration at a higher temperature during pyrolysis [Citation23,Citation24]. Additionally, the high carbon content and low oxygen content resulting from pyrolysis is the result of the breakdown of volatile compounds at high temperatures, which concentrates carbon compounds such as cellulose and lignin that are difficult to break down [Citation25]. Finally, the ACs showed an expected rise in the potassium and oxygen groups due to activation using potassium carbonate. The iron content is also shown to have increased significantly upon activation, indicating the presence of magnetic properties in KBS and KM.
Table 4. EDS results of samples.
3.5. XRD analysis
presents the diffractogram for the samples. The BS and BSC samples have only one sharp peak around 30° indicating the presence of calcite, confirming no significant changes upon pyrolysis, displaying its crystalline nature. However, when the BS is activated, the figure reveals the significant existence of magnetite (Fe3O4) and potassium iron oxides (K2Fe4O7, KFeO2). Similarly, CB, CBC, and KCB all detected calcite peaks, which is expected due to their natural presence, such as in paper feeds [Citation26,Citation27]. The CB identified an additional cellulose peak which is not present in CBC, instead detecting graphite, making the sample less crystalline after pyrolysis – a similar result has been reported in a study by CB biochar. Furthermore, in this study, upon pyrolysis, the sample analysis demonstrated other peaks of aluminium silicate hydroxide: due to the reaction of the individual elements: Al, Si, H, and O at high temperatures, as seen in and dolomite (calcite-like compound) upon pyrolysis. Regarding the mixed samples, they showed characteristics of both CB and BS.
Figure 4. XRD results of (A) BS, BSC, KBS (B) CB, CBC, KCB (C) MC, KM.
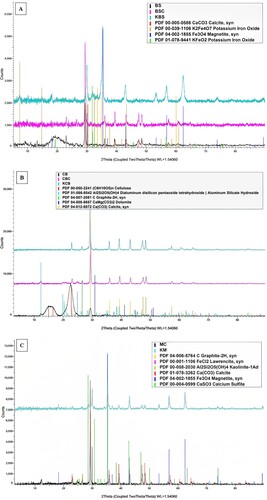
In addition to calcite, other graphite and aluminium silicate hydroxide peaks were found in the mixed char, just like the CB sample. Similar to KBS, magnetite was identified in the mixed activated sample as well; this was observed in another study on nano iron oxide nanoparticles showing intense 2θ peaks at 30,2°, 35,2°, 43,1°, 57,2°, and 62,5°, representing the occurrence of diffraction planes for magnetite (220), (311), (400), (511),(440) respectively like in this study [Citation28]. The potential reaction with potassium and oxygen (activating agent) with iron in KBS and KM samples would have led to this formation. This proves the presence of magnetic properties in both KBS and KM samples, and iron in the feed facilitated this (). Weak peaks of lawrencite (FeCl2) in the mixed char and calcium sulphite in the mixed AC were discovered in the diffractogram of the samples due to the potential interaction between the individual elements present in the feeds during pyrolysis and activation, respectively ().
3.6. XPS analysis
(A) shows results for all the BS samples. For the feed, the chemical state analysis of C1s – indicates the peaks of C–C/C–H, C–O/C–N, C = O and –CO3/O–C = O were detected at 284.8 eV, at 286.2 eV, at 287.8 and 289.2 eV respectively. After pyrolysis, the C1s-related chemical state analysis of BS shows the presence of the peaks C–C/C–H, C–O/C–N, C = O, and –CO3/O–C = O at 284.8, 286.1, 287.6 and 289.3 eV respectively. Additionally, activation of BS demonstrated the presence of the peaks C–C/C–H, C–O/C–N, C = O,and –CO3/O–C = O in addition to K2p3/2 and K2p1/2 at 292.6 and 295.4 eV, respectively as shown in . The deconvolution method is explained in previous reports [Citation29–31]. Overall, the XPS results indicate the presence of C mainly as C–C/C–H for BS, with a smaller occurrence of C–O/C–N and a minor presence of C = O and –CO3/O–C = O. Furthermore, BSC has a relatively lower oxidation state than BS due to the reduction in C–O, C = O, and O–C = O/-CO3 chemical states, leading to more C–C/C–H chemical states for C. However, activated BS sample indicated mainly C–C/C–H, with relatively smaller C–O and C = O presence. As expected, activation also showed the increased –CO3/O–C = O peak relative area and the presence of potassium on the surface of the AC due to the usage of potassium carbonate for activation.
Figure 5. XPS C1s spectra deconvolution of (A) BS, BSC, KBS (B) CB, CBC, KCB (C) MC, KM.
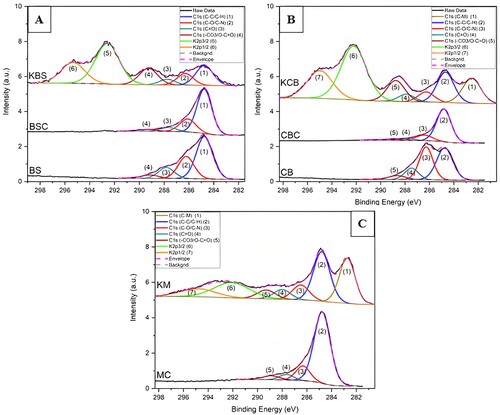
For CB, C1s-related chemical state analysis shows the peaks of C–C/C–H, C–O/C–N, C = O and –CO3/O–C = O. While for CBC, C1s-related chemical state analysis shows the occurrence of the peaks C–C/C–H, C–O/C–N, C = O and –CO3/O–C = O. After activation, C1s-related chemical state analysis shows the presence of the peaks C–C/C–H, C–O, C = O and –CO3/O–C = O as well as K2p3/2 and K2p1/2. In addition, there is a presence of a lower binding energy peak related to C1s at 282.6 eV, which is an indication of the carbide/graphite chemical state – this presence is in accord with other ACs produced by oxygenated compounds at high temperatures [Citation32–34]. As a whole, XPS results show the presence of C mainly as C–O/C–N, a slightly smaller peak related to C–C/C–H, and a minor presence of C = O and –CO3/O–C = O. Similar to the previous results, CBC related C1s have shown a reduction in the oxidation state due to the decrease in O-related chemical states and the increase of C–C/C–H percentage. Similar to KBS, after activation, KCB showed the increased CO3/O–C = O peak relative area compared to C–C/C–H, which is related to the presence of carbonates (-CO3) at the surface and also the detection of potassium on the surface of the AC. All the CB related results are shown in (B).
For mixed char, similar to the previous samples, the C1s-related analysis reveals the existence of C–C/C–H, C–O/C–N at, C = O and –CO3/O–C = O peaks. As evident in the previous discussion of both KBS and KCB, the mixed activated sample also showed the peaks C–C/C–H, C–O/C–N, C = O –CO3/O–C = O related to the C1s spectra, as well as K2p3/2 and K2p1/2. In addition, there is an indication of a lower binding energy peak related to C1s at 282.7 eV, similar to KCB, associated with carbide/graphite chemical state detected in KM. Both MC and KM show mainly a high fraction of C–C/C–H due to the atmosphere-controlled process (high temperature in inert gas). Both MC and KM XPS results are shown in (C).
3.7. Potential of products and future studies
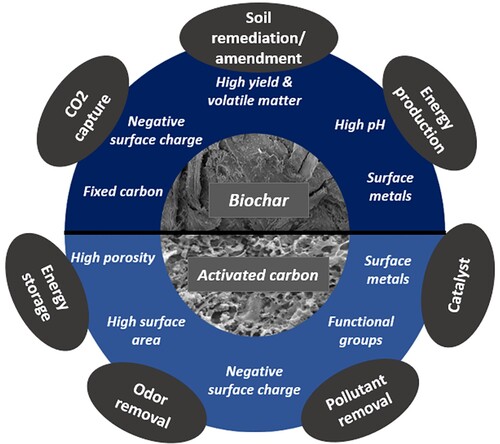
Based on the characterisation of biochar and AC samples provided in previous sections, the samples have the potential to be used for various applications. The high pH of the biochar samples show that they can be used for soil amendment purposes to improve fertility and water-holding capacity [Citation35,Citation36]. It can also be used for carbon sequestration, which can help mitigate climate change [Citation37,Citation38]. The presence of important functional groups such as C = O and C–O/C–N based on the XPS results, the negative surface charge and especially the magnetic properties of the BS and mixed biochar evident from the XRD analysis make it suitable for soil remediation purposes [Citation39–41]. Since the surface area and pore volume are at the lower end for all the biochar samples, further activation following a two-step process could improve the quality of the biochar samples further for water treatment applications [Citation9,Citation18]. The presence of catalytic metals such as calcium, magnesium, and heavy metals shown in indicates their use as a catalyst for gasification process, thus enabling the production of energy (biofuel, syngas, and others) [Citation7]. Additionally, the potential use of biochar as animal feed is being explored and has been found to positively affect factors such as growth, adsorption of toxins, digestion, blood values, efficiency of feeding, quality of meat, and greenhouse gas emissions [Citation42].
In the present case, AC produced from potassium carbonate made porous carbons with a large surface area (). The potential for adsorbing various kinds of organic and inorganic pollutants is revealed based on the negative surface charge, and functional groups including C = O and C–O/C–N based on the XPS results [Citation8]. The samples can also be studied for pathogens and other pollutants from the water as many other commercially available ACs for water purification [Citation43]. ACs can also be employed as air filters and purifiers to remove VOCs, smoke, and odours; industrial application of purification and de-odorizing industrial gases such as methane, hydrogen, and natural gas should be explored [Citation44,Citation45]. Future studies can expand to new areas of applications related to gold purification (separating gold from other core materials) and medical purposes (removing toxins). is a schematic diagram showing the parameters of biochar and AC and some of their applications. The applications make these products an excellent environmental-friendly and economic investment.
Figure 6. Potential applications of biochar and activated carbon.
Future studies should investigate the actual application of these feeds, biochar, and AC for applications. The presence of metals and other organics should be studied for possible leaching and health and environmental effects. Other activation methods, including but not limited to commonly used activating agents such as phosphoric acid, potassium hydroxide, carbon dioxide, and steam, need to be explored. Furthermore, techno-economic assessment studies need to be conducted to understand the feasibility of pyrolysis and activation, and a comparison with other application methods is necessary. Finally, an in-depth life cycle assessment (LCA) study of the feeds from the cradle to the grave needs to be carried out to understand how beneficial it is for the environment.
4. Conclusion
In recent years, Qatar’s population has grown rapidly and to sustain this growth, the QNV 2030 vision encourages researching ways to convert waste into value-added products. This study describes a method for producing biochar and activated carbon from biosolid and cardboard waste and mixed samples using pyrolysis and activation (using K2CO3). The yield and other characterisation, including pH measurement, proximate and ultimate analysis, pore volume, surface charge, area and morphology analysis, is carried out to understand the potential of the products. Following are some key findings from this study:
The yield of biochar samples was higher than activated carbon, due to enhanced devolatilisation at the higher temperature used for the activated carbon production.
The pH of the biochar samples was more alkaline than the feed samples due to metals after pyrolysis and reduced acid surface functional groups. The activated carbon samples were slightly alkaline due to the activating agent potassium carbonate.
The proximate and ultimate analysis of samples showed lowered moisture and enhanced ash in feeds upon pyrolysis and activation due to increased temperature, reduced volatile content, increased carbon in the biochar samples and increased oxygen in AC.
As expected, the feed’s surface area and pore volume were high for ACs in the order Mix > CB >BS confirming synergy between the feeds.
Furthermore, the samples were negatively charged, with slight changes after pyrolysis and activation.
Textural properties of feed, biochar and ACs revealed distinct morphologies with porosity in KBS, KCB, and KM. The XRD analysis for biochar and activated carbon samples of BS and mixed samples showed the presence of magnetite and CB of calcite in the feed and less crystalline in the char samples due to the presence of graphite.
The XPS results and deconvolution of C1 spectra showed reduced C = O bonds and increased C = O bonds after pyrolysis and activation respectively.
Based on the characterisation, biochar and activated carbon samples have potential uses including soil amendment, carbon sequestration, soil remediation, water treatment, air pollution control, energy production and animal feed. Activated carbon is beneficial for adsorbing pollutants and can be used in water purification, air purification and industrial gas purification. However, future studies should investigate actual applications and potential health and environmental effects and evaluate production methods’ feasibility and environmental impact.
Supplementary_file.docx
Download MS Word (461.7 KB)Acknowledgements
Open Access funding provided by the Qatar National Library. The authors would like to thank HBKU Core Labs for characterising the samples using SEM-EDS, XPS, and XRD. A special appreciation is expressed to Qatar Shell Research and Technology Center—Qatar for the collaboration and for providing the biosolid samples.
Disclosure statement
No potential conflict of interest was reported by the author(s).
Data availability statement
Data will be made available on request.
Additional information
Funding
References
- Alhumoud JM. Municipal solid waste recycling in the gulf Co-operation council states. Resour Conserv Recycl 2005;45(2):142–158. doi:10.1016/j.resconrec.2005.01.010
- Esen V, Oral B. Natural gas reserve/production ratio in Russia, Iran, Qatar and Turkmenistan: a political and economic perspective. Energy Policy. 2016;93:101–109. doi:10.1016/j.enpol.2016.02.037
- Mariyam S, Cochrane L, Zuhara S, et al. Waste management in Qatar: a systematic literature review and recommendations for system strengthening. Sustain. 2022;14(15):1–23. doi:10.3390/su14158991
- Fatima T, Mentel G, Doğan B, et al. Investigating the role of export product diversification for renewable, and non-renewable energy consumption in GCC (gulf cooperation council) countries: does the kuznets hypothesis exist? Environ. Dev. Sustain. 2022;24(6):8397–8417. doi:10.1007/s10668-021-01789-z
- Okonkwo EC, Wole-Osho I, Bamisile O, et al. Grid integration of renewable energy in Qatar: potentials and limitations. Energy. 2021;235:121310, doi:10.1016/j.energy.2021.121310
- Zuhara S, Pradhan S, Pasha M, et al. Potential of GTL-derived biosolids for water treatment: fractionization, leachate, and environmental risk analysis. Water (Switzerland). 2022;14(24):4016. doi:10.3390/w14244016
- Mariyam S, Shahbaz M, Al-Ansari T, et al. A critical review on co-gasification and co-pyrolysis for gas production. Renew Sustain Energy Rev 2022;161(March):112349, doi:10.1016/j.rser.2022.112349
- Zuhara S, Mackey HR, Al-Ansari T, et al. A review of prospects and current scenarios of biomass co-pyrolysis for water treatment. Biomass Convers. Biorefinery. 2022, doi:10.1007/s13399-022-03011-0
- Oginni O, Singh K, Oporto G, et al. Effect of one-step and two-step H3PO4 activation on activated carbon characteristics. Bioresour. Technol. Reports. 2019;8(July):100307, doi:10.1016/j.biteb.2019.100307
- Fakayode OA, Aboagarib EAA, Zhou C, et al. Co-pyrolysis of lignocellulosic and macroalgae biomasses for the production of biochar – A review. Bioresour Technol 2020;297(September 2019):122408, doi:10.1016/j.biortech.2019.122408
- Park J, Hung I, Gan Z, et al. Activated carbon from biochar: influence of its physicochemical properties on the sorption characteristics of phenanthrene. Bioresour Technol 2013;149:383–389. doi:10.1016/j.biortech.2013.09.085
- Panwar NL, Pawar A. Influence of activation conditions on the physicochemical properties of activated biochar: a review. Biomass Convers. Biorefinery. 2022;12(3):925–947. doi:10.1007/s13399-020-00870-3
- Ding Z, Wan Y, Hu X, et al. Sorption of lead and methylene blue onto hickory biochars from different pyrolysis temperatures: importance of physicochemical properties. J Ind Eng Chem 2016;37:261–267. doi:10.1016/j.jiec.2016.03.035
- Kambo HS, Dutta A. A comparative review of biochar and hydrochar in terms of production, physico-chemical properties and applications. Renew Sustain Energy Rev 2015;45:359–378. doi:10.1016/j.rser.2015.01.050
- Crombie K, Sohi SP, Brownsort P, et al. The effect of pyrolysis conditions on biochar stability as determined by three methods. Gcb Bioenergy. 2013;5(2):122–131. doi:10.1111/gcbb.12030
- Berek AK, Hue NV. Characterization of biochars and their use as an amendment to acid soils. Soil Sci 2016;181(9–10):412–426. doi:10.1097/SS.0000000000000177
- Aktar S, et al. Effects of temperature and carrier gas on physico-chemical properties of biochar derived from biosolids. J Anal Appl Pyrolysis. 2022;164(March):105542, doi:10.1016/j.jaap.2022.105542
- Oginni O, Singh K, Oporto G, et al. Influence of one-step and two-step KOH activation on activated carbon characteristics. Bioresour. Technol. Reports. 2019;7(April):100266, doi:10.1016/j.biteb.2019.100266
- Karapınar HS. Adsorption performance of activated carbon synthesis by ZnCl2, KOH, H3PO4 with different activation temperatures from mixed fruit seeds. Environ. Technol. (United Kingdom). 2022;43(9):1417–1435. doi:10.1080/09593330.2021.1968507
- Bushra B, Remya N. Biochar from pyrolysis of rice husk biomass—characteristics, modification and environmental application. Biomass Convers. Biorefinery. 2020: 7–12. doi:10.1007/s13399-020-01092-3
- Tan G, Sun W, Xu Y, et al. Sorption of mercury (II) and atrazine by biochar, modified biochars and biochar based activated carbon in aqueous solution. Bioresour Technol 2016;211:727–735. doi:10.1016/j.biortech.2016.03.147
- Roychand R, et al. Recycling biosolids as cement composites in raw, pyrolyzed and ashed forms: a waste utilisation approach to support circular economy. J. Build. Eng. 2021;38(December 2020):102199, doi:10.1016/j.jobe.2021.102199
- Wang X, Li C, Li Z, et al. Effect of pyrolysis temperature on characteristics, chemical speciation and risk evaluation of heavy metals in biochar derived from textile dyeing sludge. Ecotoxicol Environ Saf 2019;168(October 2018):45–52. doi:10.1016/j.ecoenv.2018.10.022
- Lu T, Yuan H, Wang Y, et al. Characteristic of heavy metals in biochar derived from sewage sludge. J. Mater. Cycles Waste Manag. 2016;18(4):725–733. doi:10.1007/s10163-015-0366-y
- Mosa A, El-Banna MF, Gao B. Biochar filters reduced the toxic effects of nickel on tomato (lycopersicon esculentum L.) grown in nutrient film technique hydroponic system. Chemosphere. 2016;149:254–262. doi:10.1016/j.chemosphere.2016.01.104
- Molla MR, et al. Facile extraction and characterization of calcium hydroxide from paper mill waste sludge of Bangladesh. R. Soc. Open Sci. 2022;9(8):220681. doi:10.1098/rsos.220681
- Cherkas O, Beuvier T, Fall S, et al. X-ray absorption and diffraction analysis for determination of the amount of calcium carbonate and porosity in paper sheets. Cellulose. 2016;23(5):2831–2840. doi:10.1007/s10570-016-1001-3
- Cusioli LF, Quesada HB, Barbosa de Andrade M, et al. Application of a novel low-cost adsorbent functioned with iron oxide nanoparticles for the removal of triclosan present in contaminated water. Microporous Mesoporous Mater 2021;325(June):111328. doi:10.1016/j.micromeso.2021.111328
- Almanassra IW, et al. Palm leaves based biochar: advanced material characterization and heavy metal adsorption study. Biomass Convers. Biorefinery. 2022;(Ii), doi:10.1007/s13399-022-03590-y
- Al-Gaashani R, Najjar A, Zakaria Y, et al. XPS and structural studies of high quality graphene oxide and reduced graphene oxide prepared by different chemical oxidation methods. Ceram Int 2019;45(11):14439–14448. doi:10.1016/j.ceramint.2019.04.165
- Al-Gaashani R, Zakaria Y, Lee OS, et al. Effects of preparation temperature on production of graphene oxide by novel chemical processing. Ceram Int 2021;47(7):10113–10122. doi:10.1016/j.ceramint.2020.12.159
- Nahil MA, Williams PT. Surface chemistry and porosity of nitrogen-containing activated carbons produced from acrylic textile waste. Chem Eng J 2012;184:228–237. doi:10.1016/j.cej.2012.01.047
- Puziy AM, Poddubnaya OI, Socha RP, et al. XPS and NMR studies of phosphoric acid activated carbons. Carbon N. Y. 2008;46(15):2113–2123. doi:10.1016/j.carbon.2008.09.010
- Teo EYL, et al. High surface area activated carbon from rice husk as a high performance supercapacitor electrode. Electrochim Acta. 2016;192:110–119. doi:10.1016/j.electacta.2016.01.140
- Shetty R, Prakash NB. Effect of different biochars on acid soil and growth parameters of rice plants under aluminium toxicity. Sci Rep 2020;10(1):1–10. doi:10.1038/s41598-020-69262-x
- Chintala R, Mollinedo J, Schumacher TE, et al. Effect of biochar on chemical properties of acidic soil. Arch. Agron. Soil Sci. 2014;60(3):393–404. doi:10.1080/03650340.2013.789870
- Zhang Y, Maierdan Y, Guo T, et al. Biochar as carbon sequestration material combines with sewage sludge incineration ash to prepare lightweight concrete. Constr Build Mater 2022;343(January):128116, doi:10.1016/j.conbuildmat.2022.128116
- Mona S, Malyan SK, Saini N, et al. Towards sustainable agriculture with carbon sequestration, and greenhouse gas mitigation using algal biochar. Chemosphere. 2021;275:129856, doi:10.1016/j.chemosphere.2021.129856
- Chen H, et al. Engineered biochar for environmental decontamination in aquatic and soil systems: a review. Carbon Res. 2022;1(1):1–25. doi:10.1007/s44246-022-00005-5
- Tan Z, Yuan S, Hong M, et al. Mechanism of negative surface charge formation on biochar and its effect on the fixation of soil Cd. J Hazard Mater 2020;384(February 2019):121370. doi:10.1016/j.jhazmat.2019.121370
- Pan M. Biochar adsorption of antibiotics and its implications to remediation of contaminated soil. Water. Air. Soil Pollut. 2020;231(5):221. doi:10.1007/s11270-020-04551-9
- Schmidt HP, Hagemann N, Draper K, et al. The use of biochar in animal feeding. PeerJ. 2019;2019(7):1–54. doi:10.7717/peerj.7373
- Jjagwe J, Olupot PW, Menya E, et al. Synthesis and application of granular activated carbon from biomass waste materials for water treatment: a review. J. Bioresour. Bioprod. 2021;6(4):292–322. doi:10.1016/j.jobab.2021.03.003
- Barbusinski K, Kalemba K, Kasperczyk D, et al. Biological methods for odor treatment – a review. J Clean Prod 2017;152:223–241. doi:10.1016/j.jclepro.2017.03.093
- Kim M, Lim GT, Kim YJ, et al. A novel electrostatic precipitator-type small air purifier with a carbon fiber ionizer and an activated carbon fiber filter. J Aerosol Sci 2018;117(September 2017):63–73. doi:10.1016/j.jaerosci.2017.12.014