
 ?Mathematical formulae have been encoded as MathML and are displayed in this HTML version using MathJax in order to improve their display. Uncheck the box to turn MathJax off. This feature requires Javascript. Click on a formula to zoom.
ABSTRACT
Hydropower UV disinfection has not been explored as a possible alternative for off-grid disinfection. Hydropowered UV LED technology was developed using off-the-shelf UV-C LEDs and pico – and femto-scale hydro turbine generators and evaluated across point-of-use relevant flow rates. Commercially available UV LED flow through reactors were subjected to microorganism challenge testing with 3 power schemes: wall-plug, hydropower, and hydropower-charged battery. UV LEDs powered by hydropower-charged battery demonstrated similar disinfection as wall-plug powered UV LEDs, achieving 0.5-1.8 MS2 log10 reduction at flow rates 0.5-2.3 L min−1, corresponding to reduction equivalent doses (RED) up to 16 or 30 mJ/cm2 for 254 and 285 nm, respectively. With hydropowered UV LEDs alone, MS2 log10 reduction decreased to <0.3 log10 reduction due to an underperforming and grossly inefficient turbine, with RED of 8 or 18 mJ/cm2 for 254 and 285 nm, respectively. Assessment of existing markets of UV disinfection systems and pico-hydro turbines demonstrated that hydropowered UV systems are already theoretically feasible for scales at point-of-entry (POE) and above. Economic feasibility will improve if turbines and/or UV system efficiencies improve. Prototype hydropower UV LED systems ranged from $145 to 220 depending on the UV LED reactor, and the battery system added $81. This study demonstrates the practicality of sustainable, renewable energy POU UV disinfection technology that can benefit decentralised, off-grid, rural and remote communities. The system may also scale up to provide renewable energy disinfection at larger scales, such as buildings and water distribution systems, for protecting human health in highly populated areas.
GRAPHICAL ABSTRACT
1. Introduction
1.1. UV disinfection for controlling microbial contamination
Ultraviolet (UV) disinfection is a proven water treatment technology for reducing waterborne disease and inactivating microorganisms [Citation1]. UV addresses several issues that often impede application of chemical disinfection: it requires no hazardous chemicals, does not impart taste and odour, avoids selective pressure for chemical resistance, and causes little to no formation of disinfection by-products [Citation2]. Conventional low pressure and medium pressure mercury (Hg) lamps pose risks to human and environmental health if they break and release hazardous mercury into water supplies, are fragile, degrade over time with frequent power on/off cycles, and require a warm-up period to achieve full light intensity [Citation3,Citation4].
UV light emitting diodes (UV LEDs) are an emerging, low-cost, mercury-free technology capable of emitting polychromatic germicidal UV radiation [Citation2,Citation5–8]. UV LEDs are proven in disinfection applications such as small drinking water systems [Citation9], municipal drinking water [Citation10], and small-scale wastewater treatment [Citation11]. Key technology advancements such as tailorable wavelengths and increasing electrical efficiency by Haitz’s Law [Citation12–14] are making UV LEDs competitive with existing mercury-based UV sources [Citation3,Citation8]. Currently, reported wall-plug efficiency (i.e. ability of light source to convert energy to light) values of UV LEDs ranges from 0.5 to 6% [Citation8,Citation12,Citation15–18] while mercury systems have greater efficiencies from 15 to 35% (i.e. only 15–35% of energy is converted to emitted light) [Citation2,Citation18–20]. UV LEDs are expected to continue decreasing in cost and increasing in light output and efficiency, which will reduce barriers for wide-spread UV LED adoption and design of electrically efficient disinfection systems.
1.2. In-pipe hydropower as a renewable energy source for water systems
Sustainable development to meet future needs requires globalised efforts to achieve equitable access to climate-resilient, safe, and effectively managed water and sanitation services without increasing greenhouse gas emissions [Citation21]. Renewable energy offers a promising solution to meet the electricity needs of nearly 1.3 billion people who still lack access to electricity and the 1 billion people that have poor quality electricity or have intermittent grid-power [Citation22,Citation23]. Electrification of rural areas is impeded by geography-related challenges, high costs, and poor political impetus [Citation22]. Alternative energy sources may serve as on-site power sources for water treatment devices to ensure safe water [Citation24]. Research on energy-harvesting devices for self-powered water disinfection is an emerging field of research for applications where water infrastructure and grid power are inadequate (e.g. rural, remote) or damaged (e.g. by natural disasters) [Citation25].
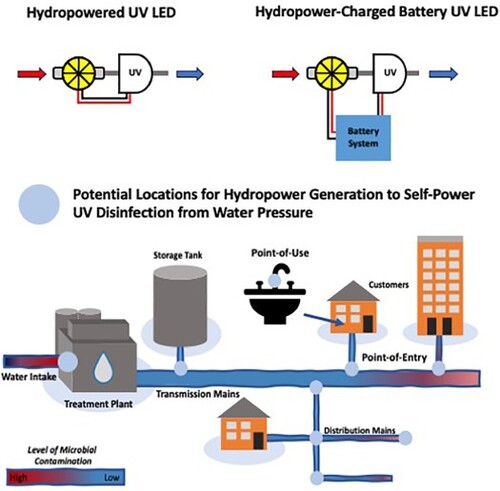
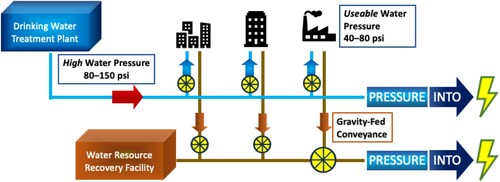
Large-scale hydropower dams are popular for renewable energy generation, but have drawbacks such as high capital cost (between $2500 and 7500 per kW), large footprint, environmental and social disruption, and construction-related greenhouse gas emissions from concrete curing [Citation23,Citation26]. In-pipe hydropower is a relatively new technology that harnesses excess water pressure in existing infrastructure within municipal water and wastewater, industrial water, urban and building, and agriculture and irrigation systems to generate electricity [Citation27]. In-pipe hydropower is scalable, limits environmental disruption, and is climate-independent (e.g. precipitation, temperature) [Citation28]. Pre-existing conduits (e.g. canals, pipes) in agricultural, municipal, industrial systems, gravity-driven water supplies, water tanks, wastewater conveyance, and stormwater collection can be designed or retrofitted with hydropower technology to generate renewable energy [Citation29–36]. By design codes, excessive water pressure unsuitable for residential, commercial, or industrial use is commonly dissipated by pressure reducing valves (PRVs). Turbines could be used strategically to recover hydraulic energy into electricity while serving the function of a PRV. Gravity-fed water systems or sewage collection systems can be retrofitted or designed to generate electricity to recover costs for municipalities ().
Figure 1. Schematic of water pressure harvesting with hydroelectric systems in drinking water and wastewater pipe systems.
In-pipe hydropower has potential to help address these multi-faceted challenges regarding environmental sustainability and water access. The United States possesses an untapped conduit (e.g. in-pipe) hydropower capacity of 530 MW and an undeveloped potential capacity of 1410 MW [Citation37]. The industrial and municipal sectors possess in-pipe hydropower potentials of 378 and 374 MW, respectively, which equates to 4481 GWh per year [Citation37]. This electricity can be exploited for powering on-site equipment (e.g. electronics, SCADA) or treatment devices, such as UV disinfection, to offset operation costs.
Commercialised, municipal scale in-pipe hydropower systems (typically >50 gal min−1; 0.00315 m3 s−1) with efficiencies approaching 40%–50% [Citation38] are becoming increasingly attractive in countries such as the United Kingdom, Ireland, Italy, United States, Turkey, Canada, Laos [Citation35,Citation39–44]. Hydropower can also power wireless smart metres for detecting leaks in distribution systems [Citation45], monitoring pipeline health [Citation46], charging electrical devices, powering non-UV LEDs, and harvesting energy with 3D-printed turbines [Citation47]. Research and development on small scale hydropower (e.g. pico-hydro turbines and smaller) has been limited, so there is much potential to advance this technology to decarbonise water systems, improve energy resilience, and reduce electricity costs.
1.3. In-pipe hydropower for decentralised electrical generation and UV disinfection
According to the World Health Organization, 2.2 billion people lack access to safely managed drinking water [Citation48]. While UV systems offer a low-cost, compact, and chemical-free solution for global water and sanitation, electricity requirements impede use of UV in remote or off-grid communities that are burdened by waterborne disease. However, combining UV with renewable energy bypasses the electricity need. UV systems were previously adapted with hand-pumps [Citation49], solar PV [Citation50,Citation51], and piezo-electric generation [Citation52] for decentralised, small-scale disinfection.
Hydropower UV disinfection has not yet been explored. Thus, the aim of this paper was to evaluate the technological, economic, and social opportunities and challenges of hydropowered UV disinfection. Hydropower, which currently contributes 46% of global renewable energy, can be installed on-site as a grid-independent power source for UV disinfection systems [Citation26,Citation53,Citation54]. Distributed hydropowered UV disinfection can help reduce risk of exposure to pathogens and DBPs and offset healthcare costs [Citation55]. The objectives of this study were to design a prototype hydropower UV reactor with off-the-shelf components, evaluate the technology for disinfection performance, and to provide a critical review of challenges and opportunities of implementing hydropowered UV, including by techno economic assessment of the designed system. Once optimised, hydropowered UV LEDs will vastly expand drinking water applications for UV LEDs to reduce pathogen exposure in pressurised, and off-grid and remote settings that lack reliable electricity.
2. Methods
2.1. Flow through UV LED reactors
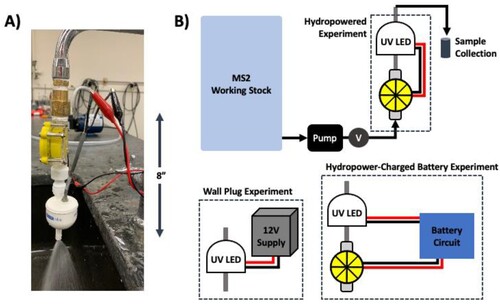
Point-of-use scale UV reactors, PearlAqua Micro reactor models 3B, 6B and 9C, were purchased from AquiSense Technologies (Erlanger, KY). The nominal wavelength of the reactors was 280 nm with full-width at half maximum (FWHM) of 12 nm ((b)). The reactors are NSF/ANSI International 55–2019 certified water disinfection systems with maximum operating pressure of 120 psi (pounds per square inch; 827 kPa) and pressure drop of 0.9–5.9 psi (6.2–40.7 kPa) at flow rates between 1.2 and 5.3 L min−1. The reactors are rated for fluid temperatures from 0 to 45°C, are compatible with 3/8″ (0.95 cm) inner diameter quick connect fittings and operate with input voltage of 12 V. Required input power requirements ranged from 2.5 to 11 W. Reactors house internal electronics and UV LEDs and operate in an up-flow orientation per manufacturer recommendation. Reactors were purchased in October 2019 with the flying lead configuration with four wires: red = power supply, black = ground, green = temperature sensing, and white = current sensor wire. The proof-of-concept hydropower UV LED reactor is shown in (a) and the turbine is shown in Figure S1.
Figure 2. Proof-of-concept for off-the-shelf hydropower UV LED reactor (A) attached to sink for visualisation purposes. Flow through testing apparatus (B) with three different power regimes: wall-plug, hydropower, and hydropower-charged battery. A valve (V) was used for adjusting the flow rates. The dashed lines indicate the systems that were interchanged into the test apparatus to change the power supply for flow through disinfection testing.
2.2. Microorganism propagation and enumeration
For flow through disinfection tests, thawed MS2 (ATCC 15598-B1) stocks of 1010 PFU mL−1 were diluted to obtain feed stock concentrations of ∼106 PFU mL−1 in 0.1X PBS. For collimated beam tests, MS2 stocks were diluted in sterile 1X PBS (pH 7.2) to prepare working stock solutions targeting ∼106 PFU mL−1. The stock solutions were homogenised for 10 minutes before disinfection experiments and continuously mixed throughout the experiments using a submersed aquarium pump. All untreated and UV treated samples were serially diluted in 1X PBS. MS2 bacteriophage plaque assay was performed with E. coli Famp host (ATCC 700891) in Tryptic soy agar using EPA 1602 single layer agar method. Microorganism enumeration was performed by spot plating technique [Citation56] with 10 µL spots and 10 technical replicates per dilution. Plates were incubated at 37°C for 12–16 h. Microorganism inactivation was expressed as log10 inactivation and calculated as log10 (N0/Nx), where N0 is the microorganism concentration before UV irradiation and Nx is the microorganism concentration after UV irradiation in flow through or collimated beam testing.
2.3. Flow through disinfecting tests
Flow through UV disinfection experiments were conducted using three power sources: wall-plug (12 V), hydropower, and hydropower-charged battery (hydropower battery). The flow through disinfection set-up is shown in (b). A pump and adjustable gate valve were used to vary the flow rate for all experiments. Flow rates were measured at the outlet of the apparatus using a graduated cylinder and stopwatch measurements. All untreated and treated samples were collected at the outlet. Untreated (negative control) samples were collected at the start and end of each experiment with the UV source disconnected from the power supply. A waiting period of 5–10 s was permitted between sample collection and power on/off to allow fresh solution to flush through the system.
Disinfection by wall-plug (12 V) powered UV LEDs was established as baseline disinfection performance according to manufacturer specified operating conditions. For wall-plug powered disinfection experiments, the positive and negative connections on the reactors were connected to the positive and negative terminals of a regulated DC power supply (BK Precision® 1621A) set to 12 V DC. The current drawn from the power source were 0.27, 0.67, and 0.77 A, resulting in calculated power consumptions of 3.2, 8.0, and 9.24 W for the PearlAqua Micro 3B, 6B and 9C units, respectively.
Hydropower battery powered UV LED disinfection was also performed using an off-the-shelf hydro turbine (Figure S1). For hydropowered disinfection experiments, the hydropowered UV LED apparatus was constructed by connecting the red (supply) and black (ground) leads from the UV LED reactors to the red (positive) and black (negative) leads of the turbine generator. Voltage and current were monitored with digital multimeters the duration of the experiment to confirm the operation of the UV LEDs. Voltage and current measurements were used to calculate power consumption of the UV LED using the hydropower turbine generators. A battery circuit (Figure S2, Text S1, Table ST1) was designed to be charged by the turbine and to output 12 V for powering the UV LED reactors. The initial charge of the battery was 0 V. At the end of the charging period, the battery voltage was 11.1 and 12 V after the boost converter.
2.4. Collimated UV experiments
Biodosimetry is commonly used to determine the UV dose of an enclosed UV reactor [Citation57]. Collimated beam experiments were conducted to determine the UV dose responses of MS2, which were used to back-calculate UV dose in reactors. A Triple Wavelength Pulsing Pearl Beam (AquiSense Technologies, Erlanger, KY) with UVinaire LED emitting 285 nm (FWHM = 14) and low-pressure (LP) mercury lamp (COOSPIDER, 6W) emitting 254 nm were used as UV radiation sources. UV exposures were performed using a standardised protocol for monochromatic UV sources adjusted for polychromatic light emission [Citation58–60] using the experimental apparatus shown in Figure S3A. The emission spectra of the UV sources are shown in Figure S3B. Reduction equivalent doses (RED) for both 254 and 285 nm were calculated for the flow through disinfection results using first-order disinfection kinetics fitted with linear regression to UV dose responses. RED for 254 nm was calculated for comparison to typical LP UV doses used in water treatment, and RED for 285 nm was calculated because it was the UV LED with the closest peak wavelength to UV LED in the flow through reactor (282 nm). Because MS2 sensitivity varies by wavelength, RED for 254 nm was calculated for comparison to typical LP UV doses used in water treatment, and RED for an LED with very similar peak wavelength emission (nominal = 285 nm, actual = 284 nm) to a representative emission spectrum for LEDs used in the reactor (estimated peak = 280 nm). Additional details of the collimated beam experiments are provided in Text S2.
2.5. Theoretical compatibility of UV and in-pipe hydropower systems
The electrical compatibility for UV and in-pipe pico-hydro turbine systems was evaluated by obtaining specifications, such as power required, UV doses, and flow rates, for UV LED and LP UV water disinfection systems at the point-of-entry (POE) scale (>5 GPM; > 0.000315 m3 s-) and point-of-use (POU) scale (≤5 gal min−1; ≤ 0.000315 m3 s−1). Data for UV systems were obtained from datasheets for different systems from leading manufacturers. Similarly, power output and flow rate data were obtained from datasheets for existing pico-hydro turbines. Power requirements or generation and flow rates were compared for UV and turbine systems to determine whether hydropower UV would be feasible based on electrical requirements.
To assess the feasibility of engineering a hydropowered UV system, we modelled the design boundaries of the Theoretical Maximum Turbine Hydropower (i.e. hydraulic power potential in water supplies) [Citation61,Citation62] and the Theoretical Minimum Required Power for a hypothetical UV system [Citation63,Citation64]. The upper and lower boundaries of the combined system was calculated at different flow rates, turbine efficiencies, hydraulic efficiencies of UV reactors, germicidal efficiencies of UV reactors, water qualities (i.e. UV Transmittance, UVT), and required UV doses.
Predicted turbine power generation () was calculated at different flow rates (Q) and pressure drops (ΔP) using Equation (1) across a range of turbine system efficiencies (from an ideal turbine generator with efficiency
= 100% to a low efficiency turbine with
= 10%,). Pressure differentials in psi were converted to Pa and flow rates in GPM were converted to m3/s.
(1)
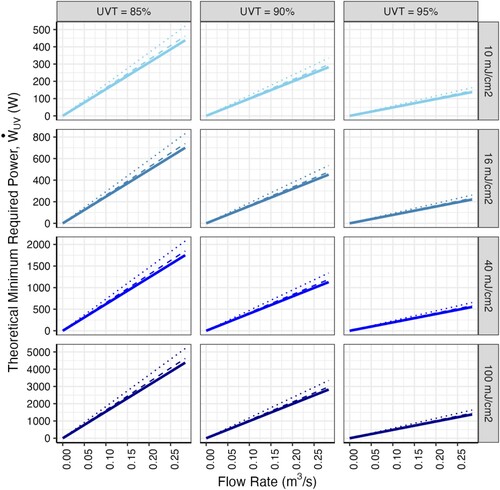
(1) Equation (2), adapted from Simons (2017) and Simons et al. (2019), was used to calculate the Theoretical Minimum Required Power of a UV reactor, where
= minimum power emitted by UV source (mW), Q = flow rate (mL s−1),
= UV fluence (mJ cm−2), UVT = UV transmittance, and
= combined hydraulic and germicidal efficiency of hypothetical UV reactor. Optical efficiency (
) of the UV system was assumed to be 90% for an ideal quartz sleeve or window. Target UV fluences (
) of 10, 16 (NSF/ANSI Class B), 40 (NSF/ANSI Class A), and 100 mJ cm−1 were set for Equation (2) to determine
across various UVT and flow rates.
(2)
(2)
3. Results and discussion
3.1. UV disinfection performance
Disinfection kinetics for MS2 are summarised in for the three UV LED reactors with three power sources. Separate reduction equivalent doses (RED) calculated are shown on the right-axis of RED were calculated from linear UV dose responses for 254 and 285 nm collimated beam experiments. First-order disinfection rate constants (estimate ± standard error) for 254 and 285 nm were 0.0525 ± 0.0019 and 0.0284 ± 0.0006 cm2/mJ (Figure S4).
Figure 3. Flow through disinfection testing results for MS2 under three different power sources using 3 different UV LED units (3B, 6B and 9C with peak nominal wavelengths of 280 nm). The three different power sources were: wall-plug, hydropower (HP), and hydropower charged battery (HPB). Reduction equivalent doses (RED) for 254 nm (blue) and 285 nm (purple) are shown on the secondary y-axes.
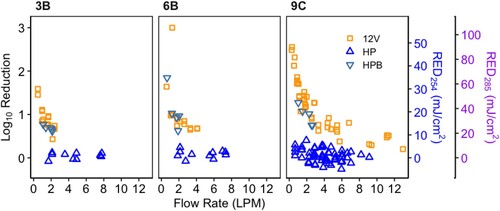
Flow through disinfection results demonstrated that the RED for 254 and 285 nm ranged from 5 to 50 mJ/cm2 and 10 to 100 mJ/cm2, respectively, across the range of flowrates tested in the 3 wall-plug powered UV LED reactors (). For hydropower disinfection of MS2, log reduction values were between 0.5 and 2 LI below the wall-plug disinfection results for a given reactor and flow rate. Results indicate that the off-the-shelf hydropower turbine (∼$15) was grossly inefficient (Figure S5, Figure S6, Text S3) and not capable of supplying the required power for the UV LEDs to achieve comparable levels of disinfection as the wall-plug UV LED (). UV LEDs powered by hydropower-charged battery achieved between 0.5 and 1.8 MS2 log10 reduction at flow rates between 0.5 and 2.3 L min−1, corresponding to reduction equivalent doses (RED) up to 16 or 30 mJ/cm2 for 254 and 285 nm, respectively. Hydropower-charged battery results were similar to results for wall-plug powered UV LEDs, while UV LEDs powered by hydropower alone only achieved MS2 log10 reduction off <0.3 log10 reduction due to an underperforming and grossly inefficient turbine, which corresponds to RED of 8 or 18 mJ/cm2 for 254 and 285 nm, respectively.
Turbines at the POU scale are not optimised due to the poor economies of scale, but further development of turbine technology would make hydropowered UV disinfection competitive as a POU treatment device. Based on the power requirement of the UV LED system and the output power of the turbine, a modest increase in turbine efficiency around 10%–15% would enable the system to operate (Figure S6). Moreover, disinfection was observed at flow rates greater than the maximum UV manufacturer-recommended flow rates, indicating that it would be possible to operate the UV LEDs outside the recommended operating range to achieve measurable disinfection while enabling increased power generation of turbine generators at higher flow rates. For the hydropower battery charged powered UV disinfection, we observed similar disinfection to the wall-plug powered UV LED (). The battery system was charged fully by the turbine prior to the beginning of the flow through disinfection testing, and the UV LED was not directly powered by the turbine.
3.2. Market assessment of UV and hydropower systems
The predicted turbine power that can be harvested from water supplies for various hydraulic conditions up to 4500 gal min−1 (e.g. municipal scale; 17,040 L min−1 = 0.284 m3 s−1) is summarised in , assuming various turbine efficiencies. Maximum predicted power increases proportionally as flow rate, pressure drop, and efficiency increase (). The theoretical minimum required power for UV systems to achieve various UV doses as a function of flow rate and water quality is summarised in . When UVT decreases from 95% to 90%, 90% to 85%, and 95% to 85%, the minimum power required for each respective flow rate and dose increased by 205%, 154%, and 316% (). Figures S6 and S7 show in greater detail the maximum predicted turbine hydropower and the theoretical minimum required power, respectively, that correspond with flow rates <50 GPM (<0.00315 m3 s−1) for and .
Figure 4. Effect of turbine efficiency on predicted power generation () from water supplies for different flow rates (up to 4500 gal min−1 calculated; 0.284 m3 s−1) and pressure drops.
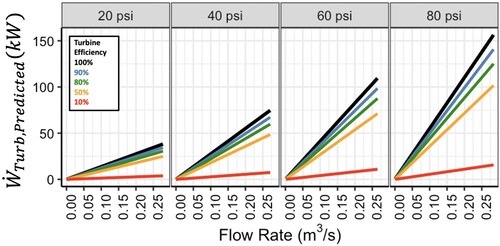
Figure 5. Effect of germicidal and hydraulic efficiency on Theoretical Minimum Required Power () for UV systems for different UV doses and water qualities (i.e. UVT) across various flow rates (up to 0.284 m3 s−1 or 4500 GPM). The solid lines, dashed line, and dotted lines represent minimum power a hypothetical system with combined 95%, 90%, and 80% germicidal and hydraulic efficiencies (
), respectively. Note that the y-axes ranges are different to permit visualisation of each data series per row. Figure S7 shows the theoretical minimum required power of UV systems for flow rates <50 GPM (<0.00315 m3 s−1).
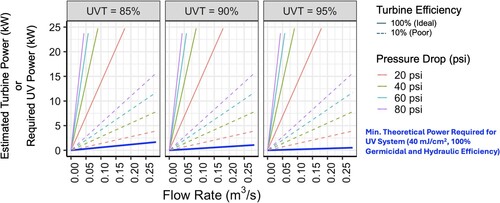
The design envelope created between the theoretical maximum generated power and minimum required power is summarised in across different water qualities, turbine efficiencies, pressure drops, and flow rates, indicating a wide space of theoretical possibility for a given set of conditions.
Figure 6. Design envelope for theoretical maximum turbine hydropower generation (upper bounds represented by multi-colour solid and dashed lines) and minimum theoretical required power (lower bound represented by bold solid line) for UV systems to achieve 40 mJ/cm2 under various water qualities. The theoretical maximum turbine hydropower generation was calculated assuming either 10% (dashed lines) or 100% (solid line) turbine efficiency to represent a range of turbine systems. Water qualities were represented by UV Transmittance (UVT) values 85%, 90%, and 95%.
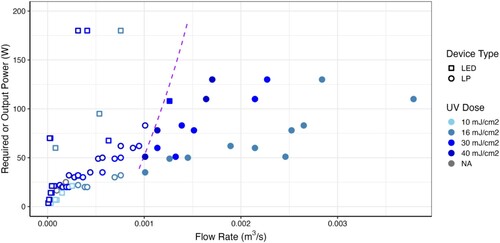
The currently available market for UV and turbine systems based on manufacturer-reported data is summarised in Figure S8, shown at different scale flow rates. Already theoretically compatible UV and turbine systems are highlighted in with closed symbols, and their details are provided in Table ST2 and ST3, respectively. Hydropower UV is theoretically possible with many LP UV systems and with at least one UV LED system () across a range of commonly applied UV doses. Hydropower UV at POU flow rates is currently not feasible because of inefficient turbines at POU flow rates (Figure S8). The reason for this gap in the current market are twofold. Primarily, there is insufficient research in developing turbine technology at POU scale. Second, economies of scale for power generation, design, and manufacturing are limited. Because of these factors, there exists an untapped area of research where increased investment can boost the reach of renewable turbine technology for off-grid and low flow applications.
Figure 7. UV and pico-hydro turbine database (as of January 2024) where UV doses, flow rates, and power requirements were obtained from manufacturer datasheets for UV LED (blue squares) and low-pressure (LP) mercury disinfection systems (blue circles). The purple dashed line indicates the minimum power output for the smallest adequately characterised in-line turbine system commercially available in the market (Canyon Hydro MH-300-60). Compatible UV systems (i.e. within operating range specified by manufacturers to achieve the reported UV dose) for this turbine are shown as filled symbols.
4. Economic analyses
4.1. POU hydropower UV system
To determine the economic feasibility of the POU UV LED systems, analysis was performed on multiple scenarios of POU hydropower UV LED systems using various operating conditions and daily water requirements for a household. A scenario in the United States was used for the analysis. In rural areas in the US, bottled water use is common despite having access to tap water at home, which can lead to health and economic impacts [Citation65–68]. The comparison was performed to determine the potential savings for drinking and cooking that treating tap water at home would provide over purchasing bottled water. Three different power supply scenarios were assessed for the analysis: wall-plug operation, hydropower, and hydropower-charged battery ((b)). The wall-plug operation represents purchasing a UV LED unit and powering it with conventional wall-plug electricity. The hydropowered UV LED represents the UV LED powered by only the water turbine. Two turbines were used for the economic analysis: the SAVEMORE4U 12 V miniature turbine and the Zurn AquaSense Hydroelectric Power Generator (Model P6900-GEN). The hydropower-charged UV LED represents the UV LED system powered by a battery which is charged by the turbine. The battery system would be appropriate for situations where there is no electricity, intermittent and low flow, and intermittent need for potable water. Assumptions for water consumption and utility costs for the analyses are summarised in , and system operating conditions and costs for the analysis are summarised in Table ST4.
Table 1. Assumptions for economic analysis of POU hydropower UV LED system to produce potable water only for drinking and cooking requirements in an average household of 4 people.
Results of the POU hydropower UV system economic analysis are summarised in Figure S9. Hypothetical system costs ranged from $45-556 (Figure S9A), and the return-on-investment (ROI) periods (Figure S9B) were calculated based on the cost of electricity, tap water, bottled water, and cost of the turbine and battery system. The ROI for the systems ranged between 0.10 and 1.26 years (Figure S9B), depending on the UV LED unit and the power system (e.g. hydropower vs. hydropower-charged battery). For the lifetime of the UV LED systems (10,000 h), the equivalent bottled water cost saved by POU UV treatment at the specified flow rates ranged from $3416 – $15,088 (Figure S9C). These values demonstrate that the savings by replacing bottled water with POU UV treated water far outweighs the cost of the UV LED systems by factors of 7–126, depending on the size (i.e. greater disinfection capacity at higher flow rates) of the UV LED unit and the cost of the turbine system chosen. The greatest variability in cost came from the battery system and the more expensive turbine. An advantage of the battery system is that it can be used to recover energy from tap water flow for other electrical needs besides POU UV disinfection. The cost of piped tap water (16 L per day) was negligible ($0.01/day) in terms of the operating cost. By replacing the bottled water with the POU UV system, the potential daily and annual savings would be $1.21/day and $443/year, respectively. Differences in the cost of bottled water and tap water by region and utility over time should be considered for future analyses. Costs not included in the analysis were vehicle expenses to travel to the store and the time cost of travelling to purchase bottled water, which would make the UV system even more economical.
4.2. POE hydropower UV system
An economic analysis conducted for the POE scale was used to determine the economic feasibility of improving an existing pressure reducing valve (PRV) system with various combinations of in-line turbine and UV disinfection systems. These hypothetical scenarios were evaluated for electrical savings and economic benefits from in-line hydropower generation. For UV LED and LP UV systems, the same operating assumptions were used for the analysis. A Canyon Hydro MH300-60 turbine generator was used as the in-line turbine system. Based on manufacturer specification sheets, it was assumed that the flow rate (27 gal min−1; 0.0017 m3 s−1 or 102 L min−1) and pressure range (503.3 kPa; 73 psi) were available for the maximum power generation by the in-line turbine system, which would result in 300 W output.
Net present value analysis, with assumptions and results summarised in Table ST5, was used to compare the following alternatives for a 20-year lifespan. Recurring costs of operations and maintenance for each alternative were estimated, and the comparisons are reflected as factors of the NPV of Alternative 1 (PRV Replacement), which was – $3650 over 20 years. The NPV of Alternative 2 (upgrade to in-line turbine alone) was 1.45 times less than the NPV of Alternative 1. The NPV of Alternatives 3, 4 and 5 for in-line turbines and UV reactors were 2, 7, and 6 times less than the NPV of Alternative 1, respectively (Table ST5). The potential savings for UV systems were calculated from the expected power consumption that would be offset by the in-line turbine. The potential electricity revenue was calculated by taking the power generated more than the UV system consumption and estimating the value of the electricity when sold to the electrical grid. For these UV systems and with this only available turbine, all alternatives had negative NPV (Table ST5). Alternatives 4 and 5 (hydropower UV LEDs) clearly had the least NPV compared to Alternative 3 (hydropowered LP UV), which was due to the high annual replacement cost. Systems where the UV LED can be replaced without replacing the entire unit, like how LP UV lamps are replaced, are needed to improve both ease of maintenance and economics. Despite the apparent poor economic viability from an energy savings lens alone, a more complete valuation would consider economic impacts of water quality and health benefits, such as through a quantitative microbial risk assessment (QMRA) [Citation69], but was outside the scope of the present study.
5. Opportunities and challenges for implementing hydropowered UV
Various technological, hydraulic, economic, and social opportunities and challenges for hydropowered UV disinfection were assessed. Different stakeholder groups and customer segments were assessed through interviews and literature review, with findings summarised here briefly. Perspectives of various customer segments were obtained through informal interviews conducted with individuals representing water utilities, hydropower industry, UV manufacturers, academia, government agencies, non-profit organisations, healthcare, and water engineers.
5.1. Municipal systems
Municipal hydropowered UV disinfection systems could be installed throughout water supplies for distributed UV disinfection [Citation70]. Important considerations for hydropower and UV systems would be water quality regulations, ease of installation, suitable footprint, integration with existing systems, operations and maintenance, and sufficient end use of the generated power (e.g. power sales or consumption). Sites with high economic return on investment, permissible hydraulic conditions (e.g. pressure and flow), and water quality needs could be ideal candidates for hydropowered UV systems. Hydraulic power ≥ 12 kW was previously reported as the minimum gross power needed for economically viable in-pipe hydropower systems at municipal scale [Citation71] which is theoretically feasible across a range of hydraulic conditions and theoretical turbine efficiencies (). Economic, energy, and health benefits assessed by NPV and QMRA analyses could aid utility decision making [Citation40,Citation72]. Water system planners should consider socioeconomic factors such as variability of hydraulic conditions, population growth, turbine selection, turbine efficiency, and accurate estimates of power generation [Citation40,Citation71].
Water utilities in the US can capitalise on funds provided by the Bipartisan Infrastructure Law [Citation73–75] by exploring how to synchronise future installation of in-pipe turbines and piloting hydropowered UV with the overdue replacement of existing pipes. This strategy may offer construction cost savings but would require coordination with multiple stakeholders (e.g. municipalities, in-pipe hydropower manufacturers, engineers, construction companies, politicians, contractors, etc.)
Analysis of pressurised water systems or gravity-fed water systems, such as with hydraulic modelling software (e.g. EPANET), could be performed to assess the hydraulic suitability of sites for implementation for optimal power generation and minimal disruption of water service (i.e. pressure loss) and strategic locations for booster disinfection [Citation29,Citation36,Citation76]. Previously, potential sites for in-line turbine installation were identified throughout water distribution systems using hydraulic analyses of pipe networks [Citation40]. Optimal turbine characteristics for in-line hydropowered UV systems include capability to operate under a wide range of hydraulic conditions, ease of installation, low cost, and availability of spare parts [Citation43].
Municipalities could benefit from optimised multi-barrier disinfection in chlorinated and non-chlorinated drinking water supplies [Citation77–80] to reduce microbial risk, especially for opportunistic pathogens (OPs), chlorine-resistant bacteria, taste and odour nuisance bacteria, and other emerging microbial threats (e.g. antibiotic resistant bacteria, ARB) [Citation7,Citation81–85]. Distributed UV can be a complementary secondary disinfection technique to chlorination and offers potential advanced oxidative processes for disinfection and contaminant degradation within the distribution system [Citation86–88].
5.2. Decentralised and rural contexts
In-line hydropower can overcome grid access challenges in rural and remote contexts. Installing turbines on-site at water treatment plants offers an economically attractive option for utilities that cannot afford costly grid-extension [Citation23,Citation89]. In-line hydropower can enable UV in a variety of off-grid sites where electrical lines might be costly to install [Citation53]. Gravity-fed water systems in mountainous regions (e.g. springs, reservoirs, artesian aquifers) are conducive for hydropower generation where UV can be implemented for water disinfection [Citation36,Citation90,Citation91]. Turbine systems are low maintenance and passive systems, which are appealing technology traits for developing contexts with limited electrification in rural areas [Citation39]. Pico-hydropower can be used to power low-cost and low-power UV disinfection systems to provide safe drinking water for remote communities, promoting access of water services to all peoples.
5.3. Point-of-entry
Hydropowered UV disinfection at POE scale can provide decentralised disinfection to address water quality issues such as physical breaches of distribution systems, loss of disinfection residual in distribution system, and release of contaminants from pipes and plumbing in buildings [Citation70,Citation92]. The main drivers for POE hydropowered UV disinfection in industrial, commercial, and residential applications, such as in warehouses, hotels, resorts, aquariums, and data centres may include reduced carbon emissions and reducing electrical consumption [Citation93,Citation94]. PRVs in buildings are a readily accessible location for installing hydropowered UV, as utilities may water pressures up to 150 psi (1034 kPa) [Citation95]. Moreover, pump-as-turbine (PAT) systems are already commonly installed in water systems and buildings in place of PRVs [Citation39,Citation61,Citation71], which can be readily feasible locations for installing hydropowered UV disinfection systems integrated with PAT systems for self-powering capability. The International Plumbing Code requires PRVs to reduce water pressure to below 80 psi (551 kPa) [Citation96], which would otherwise cause problems such as banging in pipes, water hammer, constantly running toilets, leaking faucets, and wasted water. POE hydropower UV may also be attractive to homeowners with well water systems.
5.4. Point-of-use
Hydropowered UV disinfection at POU scale offers treatment immediately before use. Self-powered UV disinfection would be beneficial for applications where electricity installation is not feasible, unsafe, or costly. Examples include rural communities, under-the-sink settings, showers, sink attachments, mobile settings (e.g. mobile homes, RVs, aeroplanes, tiny houses, etc.), or domestic appliances (e.g. ice makers, fridges, water fountains, drink dispensers). In communities with access to contaminated water sources (e.g. piped or rain water), POU hydropower UV can treat otherwise non-potable water and reduce the physical labour, health burden, and time–cost of hauling drinking water for households [Citation97–100]. POU UV also reduces exposure to pathogens, OP, and ARB and can reduce medical and healthcare costs [Citation81,Citation83,Citation84,Citation101,Citation102]. An important consideration for POU hydropower UV is designing the system to mitigate biofilm formation within the device during periods of low use [Citation103–107]. Technology advances such as more efficient pico- and femto-scale turbines and more efficient UV LEDs will enable more widespread applications due to hydraulic, cost, and electrical factors. Military, mobile, and disaster relief applications might also benefit from UV LED disinfection and coupled with hydropower. Ensuring the POU hydropowered UV system is simple to install, operate, and maintain would lower the adoption barrier for potential users.
5.5. Future directions: technology and research needs
At POE and municipal scale, the hydropowered UV reactor is theoretically feasible as indicated by the design envelope calculations and by manufacturer specifications for flow rates above 17 gal min−1 (0.00107 m3 s−1) (), but proof of concept is required. Municipal scale in-pipe hydropower systems (i.e. pico-hydro) have efficiencies around 40%–50% [Citation38], and POE in-pipe pump-as-turbine systems (i.e. pico-hydro) are around 30%–40% (e.g. Canyon Hydro). Creating databases of pressures, flows, and existing infrastructure (e.g. pipe material, diameters) for existing pipes and PRVs would provide engineers with a vital tool for site selection.
At the POU scale, turbine technology needs to be optimised at low flow rates to improve cost, adaptability, and implementation of POU scale hydropowered UV disinfection. As the results of this study demonstrated (), the hydropowered UV LED system is not yet feasible with existing pico-hydro turbine technology due to poor turbine efficiency (<1%). Turbine technology at the POU scale has been investigated previously [Citation22,Citation108,Citation109], but has substantial room for development. Battery charging systems and flow control systems should be optimised to address operation issues during times little or no flow where little to no power may be generated.
Hydropower UV has great potential to ‘enable’ other in-line technologies requiring electricity, but efficiencies of POU-scale turbine would need to increase by about 10%–20%. While hydropower-charged battery operation is already feasible for POU UV disinfection (), additional optimisation and system design (e.g. electrical controls, aesthetics, and engineering) are necessary to make the device ready for implementation. Possible areas of innovation include development of an integrated turbine and UV disinfection system design to reduce head losses from multiple chambers or reactors for the turbine and UV light source. Due to the inverse relationship between power generation and UV disinfection with flow rate, an integrated system offers the potential advantage of optimising flow rate performance for both electrical power generation and UV disinfection. Fibre optics emitting UV radiation [Citation110] could also be incorporated as a versatile and adaptable UV source in turbine runner or housing designs, in hard-to-reach infrastructure locations (e.g. distribution mains, pipes), and in building plumbing (e.g. sinks, showers, appliances). Modular parts and inserts (e.g. replacement of UV lights) should be considered for future designs of these units rather than full system replacement.
As efforts to increase LED efficiency have been ongoing and widespread [Citation17,Citation18,Citation111], optimisation in the hydrodynamics and generator should now be prioritised for this scale. At the POE scale, turbine technology is barely available, and the development of more efficient turbines at a wider variety of flow rates would provide an economically attractive and hydraulically efficient solution for POE applications. In addition to the need for decreasing the power requirement barrier for UV by improving electrical efficiency of reactors, improving turbine outputs at lower flow rates will promote the feasibility of hydropower UV disinfection.
6. Conclusion
A turbine-powered UV LED prototype served as a proof-of-concept for hydropowered UV disinfection. With further development, this technology can be implemented as a disinfectant alternative for small-scale applications in the built environment, while larger scale applications in the built environment may be feasible once the device is optimised through technological advancement and exploitation of economies of scale.
Hydropowered UV is already feasible with commercially available UV and turbine systems operating at or above POE scale, while turbines in the POU market are unable to generate sufficient power at POU flow rates needed for UV disinfection due to poor efficiency and limited development.
There is limited research and product development in hydro-turbines <1 kW, leaving much room for improvement. Additionally, UV LEDs continue to increase in efficiency and decrease in cost based on current market projections. Once hydropower and UV technology operating flow rates and power outputs/requirements have greater overlap, the two technologies combined will become even more feasible for self-powered water disinfection.
There are numerous possible applications within the water and wastewater sectors with existing pressurisation or pressure differentials, including decentralised disinfection (e.g. point-of-use, point-of-entry) in piped networks, off-grid gravity piped systems or sewage collection systems, rainwater systems, and rural and urban household disinfection in remote or developing communities with limited and unreliable access to electricity.
Overall, advancements in UV technology will help pioneer new UV disinfection techniques for protecting microbial water quality and safeguarding human health.
Combining hydropower and UV can help solve water-energy challenges to protect public health with sustainable solutions.
Author contributions
DM: Formal Investigation – Microbiology and Turbine Testing, Prototyping, Data Analysis, Writing – First Draft, Review, Revisions, Literature Review. NMH: Supervision, Conceptualisation, Technical Advising, Funding Acquisition, Administration, Writing – Review, Revisions. CB: Technical Advising – Hydropower Systems, Writing – Review, Revisions.
HydropowerUV_SI_RevisionsMay2024.docx
Download MS Word (1.5 MB)Acknowledgements
Daniel Ma was supported by a University Fellowship from The Ohio State University and lab start-up funding provided by Dr. Natalie Hull from the Department of Civil, Environmental and Geodetic Engineering at The Ohio State University. This project was also supported by funding from The Sustainability Institute at The Ohio State University. Undergraduate researcher assistants David McDonald and Jacob Huff helped with microbial challenge testing of hydropower UV LED systems. We thank Dr. Rich Simons of AquiSense Technologies, who is also Adjunct of the Faculty of Graduate Studies at Dalhousie University, for sharing his conference proceeding slides that informed the hypothetical UV reactor design calculations. In private communications, Dr. Simons also graciously reviewed the calculations of required power for UV systems, and suggested clarifications to the theoretical UV system power calculations. We thank Brian Genide from The Ohio State University for guiding the team through the Great Lakes Region local hub of NSF iCorps and his assistance in customer discovery.
Disclosure statement
No potential conflict of interest was reported by the author(s).
Data availability statement
Data are available upon reasonable request from the authors.
Additional information
Funding
References
- Hijnen WAM, Beerendonk EF, Medema GJ. Inactivation credit of UV radiation for viruses, bacteria and protozoan (oo)cysts in water: a review. Water Res. 2006;40:3–22. doi:10.1016/j.watres.2005.10.030
- Song K, Mohseni M, Taghipour F. Application of ultraviolet light-emitting diodes (UV-LEDs) for water disinfection: a review. Water Res. 2016;94:341–349.
- Chen J, Loeb S, Kim JH. LED revolution: fundamentals and prospects for UV disinfection applications. Environ Sci (Camb). 2017;3:188–202.
- Yin R, Shang C. UV LED 101: fundamentals and applications of UV LEDs in water treatment. IUVA News. 2018.
- Song K, Taghipour F, Mohseni M. Microorganisms inactivation by wavelength combinations of ultraviolet light-emitting diodes (UV-LEDs). Sci Total Environ. 2019;665:1103–1110. doi:10.1016/j.scitotenv.2019.02.041
- Sholtes K, Linden KG. Pulsed and continuous light UV LED: microbial inactivation, electrical, and time efficiency. Water Res. 2019;165:114965. doi:10.1016/j.watres.2019.114965
- Rattanakul S, Oguma K. Inactivation kinetics and efficiencies of UV-LEDs against Pseudomonas aeruginosa, Legionella pneumophila, and surrogate microorganisms. Water Res. 2018;130:31–37.
- Beck SE, Ryu H, Boczek LA, et al. Evaluating UV-C LED disinfection performance and investigating potential dual-wavelength synergy. Water Res. 2017;109:207–216. doi:10.1016/j.watres.2016.11.024
- Hull NM, Herold WH, Linden KG. UV LED water disinfection: validation and small system demonstration study. AWWA Water Sci. 2019;1:1–11.
- Jarvis P, Autin O, Goslan EH, et al. Application of ultraviolet light-emitting diodes (UV-LED) to full-scale drinking-water disinfection. Water (Basel). 2019;11:1894.
- Nguyen TMH, Suwan P, Koottatep T, et al. Application of a novel, continuous-feeding ultraviolet light emitting diode (UV-LED) system to disinfect domestic wastewater for discharge or agricultural reuse. Water Res. 2019;153:53–62. doi:10.1016/j.watres.2019.01.006
- Ibrahim MAS, MacAdam J, Autin O, et al. Evaluating the impact of LED bulb development on the economic viability of ultraviolet technology for disinfection. Environment, Science and Technology. 2013;35:400–406. doi:10.1080/09593330.2013.829858
- Simons RM, Pagan J, Lawal O. Low-maintenance, consumables-free disinfection by UV-C LEDs. 48th International Conference on Environmental Systems. 2018. p. 1–11.
- Simons R, Lawal O, Pagan J. (2022). State of the industry: UV-C LEDs and their applications [Internet]. UV Solutions. 2022 [cited 2022 Jan 8]. Available from: https://uvsolutionsmag.com/articles/2022/2022-state-of-the-industry-uv-c-leds-and-their-applications/.
- Lomaev MI, Sosnin EA, Tarasenko VF. Excilamps and their applications. Chem Eng Technol. 2016;39:39–50. doi:10.1002/ceat.201500229
- Nyangaresi PO, Qin Y, Chen G, et al. Effects of single and combined UV-LEDs on inactivation and subsequent reactivation of E. coli in water disinfection. Water Res. 2018;147:331–341. doi:10.1016/j.watres.2018.10.014
- Sun H, Long H, Wu F, et al. A massive boost for UV LED efficiency. Compd Semicond. 2020. https://compoundsemiconductor.net/article/110953/A_massive_boost_for_UV_LED_efficiency.
- McKain M, Pagan J, Lawal O, et al. UV-C LED devices and systems: current and future state. IUVA Americas Conference. 2018.
- Chatterley C, Linden K. Demonstration and evaluation of germicidal UV-LEDs for point-of-use water disinfection. J Water Health. 2010;8:479–486. doi:10.2166/wh.2010.124
- Wang Y, Ma B, He C, et al. Nitrate protects microorganisms and promotes formation of toxic nitrogenous byproducts during water disinfection by far-UVC Radiation. 2023.
- The White House. White House action plan on global water security. 2022.
- Williamson SJ, Lubitz WD, Williams AA, et al. Challenges facing the implementation of pico-hydropower technologies. J Sustain Res. 2020;2:e200003.
- Liu H, Masera D, Esser L, editors. World small hydropower development report 2013 [Internet]. 2013. Available from: www.smallhydroworld.org.
- Crawford MH, Banas MA, Ross MP, et al. Final LDRD report: ultraviolet water purification systems for rural environments and mobile applications. 2005.
- Huo Z, Lee D, Wang S, et al. Emerging energy harvesting materials and devices for self-powered water disinfection. Small Methods. 2021;5(7):2100093. doi:10.1002/smtd.202100093
- Uria-Martinez R, Johnson M, Rui S. U.S hydropower market report - water power technologies office. Office of Energy Efficiency & Renewable Energy. 2021.
- Ahmad AM, Julai S, Jauhari I, et al. In-pipe hydropower vertical axis parallel turbines prototype: performance and workability testing. Energy Sources, Part A: Recovery, Util Environ Eff. 2023;45:2317–2329. doi:10.1080/15567036.2023.2187098
- Kaunda CS, Kimambo CZ, Nielsen TK. Hydropower in the context of sustainable energy supply: a review of technologies and challenges. ISRN Renewable Energy. 2012;2012:1–15.
- Hamlehdar M, Yousefi H, Noorollahi Y, et al. Energy recovery from water distribution networks using micro hydropower: a case study in Iran. Energy. 2022: 252(C).
- Allen GS, Fay CN. In-conduit hydropower project - phase ii Report [Internet]. Holden, MA; 2013. Available from: https://www.mass.gov/doc/in-conduit-hydropower-project-phase-2-report/download.
- Badruzzaman M, Cherchi C, Sari MA, et al. California’s in-conduit hydropower implementation guidebook: a compendium of resources, best practices, and tools. 2020.
- DiPrimio R, Ramos O, Swindle M, et al. San Gabriel Valley water company “Plug-and-Play”. In-conduit hydropower development project. 2021.
- Ma T, Yang H, Guo X, et al. Development of inline hydroelectric generation system from municipal water pipelines. Energy. 2018;144:535–548. doi:10.1016/j.energy.2017.11.113
- Saber H, Mazaheri H, Ranjbar H, et al. Utilization of in-pipe hydropower renewable energy technology and energy storage systems in mountainous distribution networks. Renew Energy. 2021;172:789–801. doi:10.1016/j.renene.2021.03.072
- Boone A. How Portland is sourcing hydropower from its drinking water [Internet]. 2018. Available from: https://www.bloomberg.com/news/articles/2018-01-17/how-portland-is-sourcing-hydropower-from-its-drinking-water.
- Voltz TJ, Grischek T. Microturbines at drinking water tanks fed by gravity pipelines: a method and excel tool for maximizing annual energy generation based on historical tank outflow data. Water (Switzerland). 2019;11(7):1403.
- Kao S-C, George L, Hansen C, et al. An assessment of hydropower potential at national conduits; 2022.
- Lucid Energy Inc.. Lucid Energy Inc. In-conduit hydropower final research performance progress report. Portland, OR; 2013.
- Arriaga M. Pump as turbine – a pico-hydro alternative in Lao People’s Democratic Republic. Renew Energy. 2010;35:1109–1115. doi:10.1016/j.renene.2009.08.022
- Corcoran L, Coughlan P, McNabola A. Energy recovery potential using micro hydropower in water supply networks in the UK and Ireland. Water Supply. 2013;13:552–560. doi:10.2166/ws.2013.050
- Rossi M, Nigro A, Pisaturo GR, et al. Technical and economic analysis of pumps-as-turbines (PaTs) used in an Italian Water Distribution Network (WDN) for electrical energy production. 10th International Conference on Applied Energy, ICAE 2018 Aug 22–25; Hong Kong, People’s Republic of China. Hong Kong: Energy Procedia (Elsevier); 2019. p. 117–22.
- Su P-A, Karney B. Micro hydroelectric energy recovery in municipal water systems: a case study for Vancouver. Urban Water J. 2015;12:678–690. doi:10.1080/1573062X.2014.923919
- Fontana N, Giugni M, Portolano D. Losses reduction and energy production in water-distribution networks. J Water Resour Plan Manag. 2012;138:237–244. doi:10.1061/(ASCE)WR.1943-5452.0000179
- Hillsboro Oregon. Hillsboro in-pipe hydroelectric project.
- Hoffmann D, Willmann A, Göpfert R, et al. Energy harvesting from fluid flow in water pipelines for smart metering applications. J Phys Conf Ser. 2013;476:012104. https://iopscience.iop.org/article/10.1088/1742-6596/476/1/012104.
- Khan FU, Ahmad S. Flow type electromagnetic based energy harvester for pipeline health monitoring system. Energy Convers Manag. 2019;200:112089; doi:10.1016/j.enconman.2019.112089
- Adamski KT, Adamski JW, Urbaniak L, et al. 3D printed miniature water turbine with integrated discrete electronic elements for energy harvesting and water flow measurement. J Phys Conf Ser.. 2018;1052:012086. doi:10.1088/1742-6596/1052/1/012086
- WHO. Ensure availability and sustainable management of water and sanitation for all [Internet]. 2024 [cited 2024 May 16]. Available from: https://sdgs.un.org/goals/goal6.
- Sundar KP, Kanmani S. Design and evaluation of zero-energy UVC-LED reactor fitted with hand pump system for disinfection. J Water Supply: Res Technol-Aqua. 2021;70(1):77–88. doi:10.2166/aqua.2020.059
- Lui GY, Roser D, Corkish R, et al. Photovoltaic powered ultraviolet and visible light-emitting diodes for sustainable point-of-use disinfection of drinking waters. Sci Total Environ. 2021;493:185–196. doi:10.1016/j.scitotenv.2014.05.104
- Yu Jeco BMF, Larroder AC, Oguma K. Technosocial feasibility analysis of solar-powered UV-LED water treatment system in a remote island of Guimaras, Philippines. J Photonics Energy. 2019;9(4):043105. doi:10.1117/1.JPE.9.043105
- Şala DE, Dalveren Y, Kara A, et al. Design and optimization of piezoelectric-powered portable UV-led water disinfection system. Appl Sci (Switzerland). 2021;11.
- Kaunda CS, Kimambo CZ, Nielsen TK. Hydropower in the context of sustainable energy supply: a review of technologies and challenges. ISRN Renew Energy. 2012;2012:1–15.
- Klein SJW, Fox ELB. A review of small hydropower performance and cost. Renew Sustain Energy Rev. 2022;169:112898. doi:10.1016/j.rser.2022.112898
- Tolofari DL, Bartrand T, Haas CN, et al. Disability-adjusted life year frameworks for comparing health impacts associated with Mycobacterium avium, trihalomethanes, and haloacetic acids in a building plumbing system. ACS ES&T Water. 2022;2:1521–1531. doi:10.1021/acsestwater.2c00019
- Beck NK, Callahan K, Nappier SP, et al. Development of a spot-titer culture assay for quantifying bacteria and viral indicators. J Rapid Methods Autom Microbiol. 2009;17:455–464. doi:10.1111/j.1745-4581.2009.00182.x
- USEPA. Ultraviolet disinfection guidance manual for the final long term 2 enhanced surface water treatment rule. Environ Protect. 2006;2:1–436.
- Bolton JR, Linden KG. Standardization of methods for fluence (UV dose) determination in bench-scale UV experiments. J Environ Eng. 2003: 129.
- Linden BKG, Darby JL. Estimating effective germicidal dose from medium pressure UV lamps. J Environ Eng(United States). 1997;123:1142–1149.
- Hull NM, Linden KG. Synergy of MS2 disinfection by sequential exposure to tailored UV wavelengths. Water Res. 2018;143:292–300. doi:10.1016/j.watres.2018.06.017
- Du J, Yang H, Shen Z, et al. Micro hydro power generation from water supply system in high rise buildings using pump as turbines. Energy. 2017;137:431–440. doi:10.1016/j.energy.2017.03.023
- Cengel Y, Cimbala J. Fluid mechanics: fundamentals and applications. 4th ed. New York, NY: McGraw Hill; 2018.
- Simons R, Pagan J. Beyond EEO: derivation and application of a universal efficiency factor. IUVA World Congress. 2019.
- Simons RM. Developments in fluence rate modelling for ultraviolet light emitting diode based water treatment reactors. London: Imperial College; 2017.
- Hu Z, Morton LW, Mahler R. Bottled water: United States consumers and their perceptions of water quality. Int J Environ Res Public Health. 2011;8:565–578. doi:10.3390/ijerph8020565
- Cohen A, Rasheduzzaman M, Darling A, et al. Bottled and well water quality in a small central appalachian community: household-level analysis of enteric pathogens, inorganic chemicals, and health outcomes in rural southwest Virginia. Int J Environ Res Public Health. 2022;19:8610. doi:10.3390/ijerph19148610
- Victory KR, Cabrera NL, Larson D, et al. Comparison of fluoride levels in tap and bottled water and reported use of fluoride supplementation in a United States–Mexico border community. Front Public Health. 2017;5:1–8. doi:10.3389/fpubh.2017.00087
- Colburn AT, Kavouras SA. Tap water consumption and perceptions in United States Latinx adults. Nutrients. 2021;13:2999. doi:10.3390/nu13092999
- Haas CN, Rose JB, Gerba CP. Quantitative microbial risk assessment. 2nd ed. Hoboken, NJ: Wiley and Sons; 2014.
- Linden KG, Hull N, Speight V. Thinking outside the treatment plant: UV for water distribution system disinfection. Acc Chem Res. 2019;52. doi:10.1021/acs.accounts.9b00060.
- Mitrovic D, Novara D, García Morillo J, et al. Prediction of global efficiency and economic viability of replacing PRVs with hydraulically regulated pump-as-turbines at instrumented sites within water distribution networks. J Water Resour Plan Manag. 2022;52(5):1226–1233. doi:10.1061/%28ASCE%29WR.1943-5452.0001483
- Fernández García I, Mc Nabola A. Maximizing hydropower generation in gravity water distribution networks: determining the optimal location and number of pumps as turbines. J Water Resour Plan Manag. 2020;148(1):04021089. doi:10.1061/(ASCE)WR.1943-5452.0001152
- ASCE. Infrastructure report card [Internet]. 2021. Available from: https://infrastructurereportcard.org/.
- Zhang M, Batjargal T. Review on new spending of United States Bipartisan infrastructure bill. J Infrastruct Policy Dev. 2022;6:1507. doi:10.24294/jipd.v6i2.1507
- USEPA. Biden-Harris administration announces more than $130 million for clean water infrastructure upgrades through the bipartisan infrastructure law in Ohio. 2023.
- Islam N, Sadiq R, Rodriguez MJ. Optimizing locations for chlorine booster stations in small water distribution networks. J Water Resour Plan Manag. 2017;143(7):04017021. doi:10.1061/(ASCE)WR.1943-5452.0000759
- Seidel CJ, McGuire MJ, Summers RS, et al. Have utilities switched to chloramines? J Am Water Works Assoc. 2005;97:87–97. doi:10.1002/j.1551-8833.2005.tb07497.x
- Zhang C, Lu J. Optimizing disinfectant residual dosage in engineered water systems to minimize the overall health risks of opportunistic pathogens and disinfection by-products. Sci Total Environ. 2021;770:145356. doi:10.1016/j.scitotenv.2021.145356
- Prest EI, Hammes F, van Loosdrecht MCM, et al. Biological stability of drinking water: controlling factors, methods, and challenges. Front Microbiol. 2016;7:1–24. doi:10.3389/fmicb.2016.00045
- Smeets PWMH, Medema GJ, Van Dijk JC. The Dutch secret: how to provide safe drinking water without chlorine in the Netherlands. Drink Water Eng Sci. 2009;2:1–14. doi:10.5194/dwes-2-1-2009
- Ma B, Seyedi S, Wells E, et al. Inactivation of biofilm-bound bacterial cells using irradiation across UVC wavelengths. Water Res. 2022;217:118379. doi:10.1016/j.watres.2022.118379
- Oguma K, Rattanakul S, Masaike M. Inactivation of health-related microorganisms in water using UV light-emitting diodes. Water Sci Technol Water Supply. 2019;19:1507–1514. doi:10.2166/ws.2019.022
- Song JJX, Oguma K, Takizawa S. Inactivation kinetics of 280 nm UV-LEDs against Mycobacterium abscessus in water. Sci Rep. 2023;13:1–9. doi:10.1038/s41598-022-26890-9
- Buse HY, Hall JS, Hunter GL, et al. Differences in UV-C LED inactivation of Legionella pneumophila serogroups in drinking water. Microorganisms. 2022;10:1–10.
- Oguma K, Katayama H, Ohgaki S. Photoreactivation of Legionella pneumophila after inactivation by low- or medium-pressure ultraviolet lamp. Water Res. 2004;38:2757–2763. doi:10.1016/j.watres.2004.03.024
- Wang X, Hu X, Wang H, et al. Synergistic effect of the sequential use of UV irradiation and chlorine to disinfect reclaimed water. Water Res. 2012;46:1225–1232. doi:10.1016/j.watres.2011.12.027
- Li GQ, Huo ZY, Wu QY, et al. Synergistic effect of combined UV-LED and chlorine treatment on Bacillus subtilis spore inactivation. Sci Total Environ. 2018;639:1233–1240. doi:10.1016/j.scitotenv.2018.05.240
- Chen Y, Jafari I, Zhong Y, et al. Degradation of organics and formation of DBPs in the combined LED-UV and chlorine processes: effects of water matrix and fluorescence analysis. Sci Total Environ. 2022;846:17545.
- Robert FC, Gopalan S. Low cost, highly reliable rural electrification through a combination of grid extension and local renewable energy generation. Sustain Cities Soc. 2018;42:344–354. doi:10.1016/j.scs.2018.02.010
- Kleemeier E. The impact of participation on sustainability: an analysis of the Malawi rural piped scheme program. World Dev. 2000;28:929–944. doi:10.1016/S0305-750X(99)00155-2
- Crider YS, Sainju S, Shrestha R, et al. Evaluation of system-level, passive chlorination in gravity-fed piped water systems in rural Nepal. Environ Sci Technol. 2022;56:13985–13995. doi:10.1021/acs.est.2c03133
- Lee D, Gibson JM, Brown J, et al. Burden of disease from contaminated drinking water in countries with high access to safely managed water: a systematic review. Water Res. 2023;242:120244. doi:10.1016/j.watres.2023.120244
- Suman R, Javaid M, Nandan D, et al. Electricity generation through water supply pipes in high rise buildings. J Ind Integr Manage. 2021;6:449–468. doi:10.1142/S2424862220500098
- Aziz MS, Khan MA, Jamil H, et al. Design and analysis of in-pipe hydro-turbine for an optimized nearly zero energy building. Sensors. 2021;21(23):8154.
- USEPA. Distribution system water quality: protecting water quality through distribution system pressure management. 2021.
- IPC. International plumbing code: chapter 6 water supply and distribution. 2018.
- Gandhi S, Dilbaghi M, Raina K. Rural women carry the load of fetching water. Indian J Soc Work. 2003;64:65–75.
- Cassivi A, Dorea CC, Johnston R, et al. Access to drinking water: time matters. J Water Health. 2018;16:661–666. doi:10.2166/wh.2018.009
- Boone C, Glick P, Sahn DE. Household water supply choice and time allocated to water collection: Evidence from Madagascar. J Dev Stud. 2011;47:1826–1850. doi:10.1080/00220388.2011.579394
- Pickering AJ, Davis J. Freshwater availability and water fetching distance affect child health in sub-Saharan Africa. Environ Sci Technol. 2012;46:2391–2397. doi:10.1021/es203177v
- WHO. Results of round II of the WHO international scheme to evaluate household water treatment technologies. X: World Health Organization; 2019.
- Leslie E, Hinds J, Hai FI. Causes, factors and control measures of opportunistic premise plumbing pathogens—a critical review. Appl Sci (Switzerland). 2021;11(10):4474.
- Proctor CR, Hammes F. Drinking water microbiology-from measurement to management. Curr Opin Biotechnol. 2015;33:87–94. doi:10.1016/j.copbio.2014.12.014
- De Filippis P, Mozzetti C, Messina A, et al. Prevalence of Legionella in retirement homes and group homes water distribution systems. Sci Total Environ. 2018;643:715–724. doi:10.1016/j.scitotenv.2018.06.216
- Hamilton KA, Hamilton MT, Johnson W, et al. Risk-based critical concentrations of Legionella pneumophila for indoor residential water uses. Environ Sci Technol. 2019;53:4528–4541. doi:10.1021/acs.est.8b03000
- Cates EL, Torkzadeh H. Can incorporation of UVC LEDs into showerheads prevent opportunistic respiratory pathogens? – Microbial behavior and device design considerations. Water Res. 2020;168:115163. doi:10.1016/j.watres.2019.115163
- Logan-Jackson AR, Batista MD, Healy W, et al. A critical review on the factors that influence opportunistic premise plumbing pathogens: from building entry to fixtures in residences. Environ Sci Technol. 2023;57(16):6360–6372.
- Jawahar CP, Michael PA. A review on turbines for micro hydro power plant. Renew Sustain Rev. 2017;72:882–887. doi:10.1016/j.rser.2017.01.133
- Safdar I, Sultan S, Raza HA, et al. Empirical analysis of turbine and generator efficiency of a pico hydro system. Sustain Energy Technol Assess. 2020;37:100605. doi:10.1016/j.seta.2019.100605
- Lu G, Li C, Zheng Y, et al. A novel fiber optical device for ultraviolet disinfection of water. J Photochem Photobiol B. 2008;92:42–46. doi:10.1016/j.jphotobiol.2008.01.014
- Haitz’s Law [Internet]. Nat Photonics. 2007. Available from: doi:10.1038/nphoton.2006.78